Fig. 5
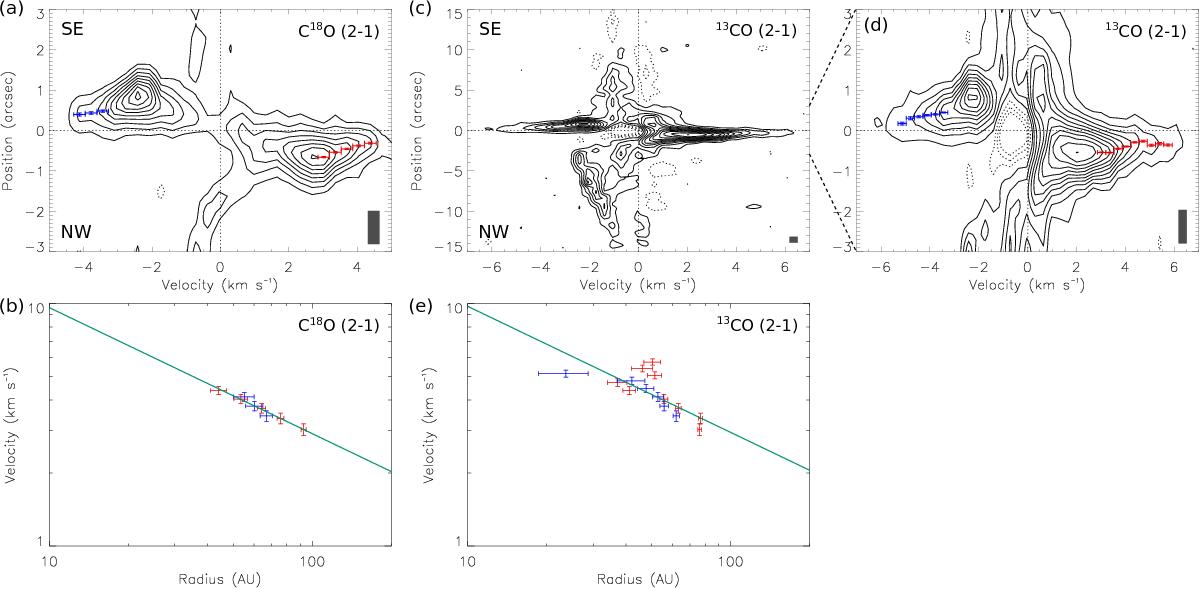
Position–velocity diagrams along the disk major axis in the C18O emission (panel a) and the 13CO emission (panel c). Panel d: zoom-in of panel c. Blue and red data points show the measured peak positions in different velocity channels. Rotational profiles measured from the data points in panels a and d are shown in panels b and e. Green solid lines show the best-fit power-law functions of the rotational profiles. Contour levels are from 3σ in steps of 3σ in panel a, where 1σ is 6.7 mJy Beam-1, and the levels are from 3σ in steps of 5σ in panels c and d, where 1σ is 7 mJy Beam-1. In the P–V diagrams, vertical and horizontal dotted lines denote the systemic velocity of VLSR = 7.04 km s-1 and the stellar position, respectively, and gray rectangles in the bottom right corners show the angular and velocity resolutions.
Current usage metrics show cumulative count of Article Views (full-text article views including HTML views, PDF and ePub downloads, according to the available data) and Abstracts Views on Vision4Press platform.
Data correspond to usage on the plateform after 2015. The current usage metrics is available 48-96 hours after online publication and is updated daily on week days.
Initial download of the metrics may take a while.