| Issue |
A&A
Volume 599, March 2017
|
|
|---|---|---|
| Article Number | A53 | |
| Number of page(s) | 14 | |
| Section | Extragalactic astronomy | |
| DOI | https://doi.org/10.1051/0004-6361/201629396 | |
| Published online | 28 February 2017 | |
The outflow of gas from the Centaurus A circumnuclear disk
Atomic spectral line maps from Herschel/PACS and APEX
1 Sterrewacht Leiden, Leiden University, PO Box 9513, 2300 RA Leiden, The Netherlands
e-mail: israel@strw.leidenuniv.nl
2 Max-Planck-Institut für Radioastronomie, Auf dem Hügel 69, 53121 Bonn, Germany
3 Space Telescope Science Institute, 3700 San Martin Drive, Baltimore, MD 21218, USA
4 I. Physikalisches Institut der Universität zu Köln, Zülpicher Strasse 77, 50937 Köln, Germany
Received: 25 July 2016
Accepted: 26 October 2016
The physical state of the gas in the central 500 pc of NGC 5128 (the radio galaxy Centaurus A), was investigated using the fine-structure lines of carbon [CI], [CII]; oxygen [OI], [OIII], and nitrogen [NII], [NIII] as well as the 12CO(4−3) molecular line. The circumnuclear disk (CND) is traced by emission from dust and the neutral gas ([CI] and 12CO). A gas outflow with a line-of-sight velocity of 60 km s-1 is evident in both lines. The [CI] emission from the CND is unusually strong with respect to that from CO. The center of the CND (R < 90 pc) is bright in [OI], [OIII], and [CII]; [OI] λ63 μm emission dominates that of [CII] even though it is absorbed with optical depths τ = 1.0−1.5. The outflow is well-traced by the [NII] and [NIII] lines and also seen in the [CII] and [OIII] lines that peak in the center. Ionized gas densities are highest in the CND (about 100 cm-3) and low everywhere else. Neutral gas densities range from 4000 cm-3 (outflow, extended thin disk ETD) to 20 000 cm-3 (CND). The CND radiation field (Go ≈ 4) is weak compared to the ETD starburst field (Go ≈ 40). The outflow has a much stronger radiation field (Go = 130). The total mass of all the CND gas is 9.1 ± 0.9×10⁷M⊙ but the mass of the outflowing gas is only 15−30% of that. The outflow most likely originates from the shock-dominated CND cavity surrounding the central black hole. With a factor of three uncertainty, the mass outflow rate is ≈ 2 M⊙ yr-1, a thousand times higher than the accretion rate of the black hole. Without replenishment, the CND will be depleted in 15−120 million years. However, the outflow velocity is well below the escape velocity.
Key words: galaxies: individual: Centaurus A (NGC 5128) / galaxies: active / galaxies: elliptical and lenticular, cD / galaxies: nuclei / galaxies: ISM / ISM: jets and outflows
© ESO, 2017
1. Introduction
Giant elliptical galaxies, including the nearest example NGC 5128 (D = 3.84 Mpc – Harris et al. 2010), frequently contain deeply embedded disks of dust and gas, remnants of smaller gas-rich galaxies that have fallen in. The embedded disks are a transient phenomenon. Eventually, the gas will be consumed by (a) accretion onto a central black hole; (b) expulsion in the form of jets and flows emanating from the nucleus; or (c) the formation of new stars. In fact, each of these processes occurs widely in a variety of galaxies. In (ultra)-luminous infra-red galaxies (LIRGs and ULIRGs), high-rate star formation is an important if not dominant mechanism of circumnuclear gas consumption. In galaxies with very active nuclei (AGNs), significant accretion onto the central black hole occurs whether or not the galaxy is actively forming stars. In radio galaxies (RGs) and many AGNs narrowly collimated jets emanate directly from the nucleus and travel at very high, sometimes relativistic, speeds. However, such jets carry little mass by themselves. Much higher masses characterize the atomic and molecular gas outflows from intense circumnuclear star-bursts, such as those in the nearby galaxies NGC 253 and M 82 (Bolatto et al. 2013; Leroy et al. 2015). These outflows travel much slower than nuclear jets and are driven by massive stellar winds. More powerful outflows, apparently not driven by stellar winds, have been identified in a variety of active galaxies primarily by their absorption of the host galaxy nuclear continuum. These include ULIRG/AGNs (such as Mrk 231, Feruglio et al. 2015), Seyfert galaxies (such as IC 5063, Morganti et al. 2015), and brightest cluster galaxies (such as those in Abell A1664 and A1835, Russell et al. 2014; McNamara et al. 2014). Very high outflow velocities up to 1000 km s-1 and molecular mass outflow rates of several hundred solar masses per year have been claimed (see e.g., Cicone et al. 2014; McNamara et al. 2014; Feruglio et al. 2015, and references therein). In most of these extreme cases the outflow is not spatially resolved but deduced from extended wings in molecular line profiles, and the quoted outflow rate depends on the essentially unknown CO-to- H2 conversion factor. It could be significantly lower, if the widely shared assumption that the CO outflow is optically thick and similar to the dense molecular gas in galaxy disks, is wrong. Indeed, Dasyra et al. (2016) have shown that the molecular outflow in IC 5063 is optically thin and much less massive than earlier assumed by some of the same authors (Morganti et al. 2015).
Most of these galaxies are so distant that circumnuclear disks with diameters less than a kiloparsec are hardly or not at all resolved, and emission from outflows is likewise hard to detect, making it difficult to derive physical conditions with a degree of confidence. A rare exception is NGC 5128, host of the huge FR I radio source Centaurus A (Cen A; see a review by Israel 1998). At a distance of 3.84 Mpc (Harris et al. 2010), it is more than an order of magnitude closer than almost all other active galaxies and even four times closer than the iconic Seyfert galaxy NGC 1068. Moreover, all three mechanisms of central (molecular) gas disk consumption (outflow, accretion, star formation) are potentially present in its center.
Optical images show a prominent dark band crossing the elliptical galaxy that is in reality the projection of an embedded warped, thin disk of gas and dust (Dufour et al. 1979; Bland 1986; Nicholson et al. 1992) extending over several kiloparsecs (hereafter called the extended thin disk, or ETD) with a mass of 1.5 × 10⁹M⊙, two per cent of the enclosed dynamical mass (cf. Israel 1998). The ETD appears to be the remnant interstellar medium (ISM) of a medium-sized late-type galaxy that was absorbed by the giant elliptical at most a few hundred million years ago (Graham 1979; Struve et al. 2010). Optical and UV images reveal large numbers of young, luminous blue stars. A recent estimate of the ETD star formation rate is ~1.6 M⊙ yr-1 (Wykes et al. 2015).
At the center of NGC 5128/Cen A is an accreting supermassive black hole of 5 × 10⁷M⊙ (Neumayer 2010). The black hole is surrounded and obscured by a very compact (400 pc) circumnuclear disk (CND; Israel et al. 1990). This CND has been imaged in CO by Espada et al. (2009), and its physical parameters have been explored by Israel et al. (2014, hereafter Paper I) with the Herschel HIFI and SPIRE instruments and ground-based (sub)millimeter telescopes. They found a CND total gas mass of 8.4 × 10⁷M⊙, partly excited by X-rays or shock-induced turbulence. The two submillimeter [C I] lines are unusually strong in the center of NGC 5128, with intensities exceeding those of the adjacent CO lines. PDR models consistent with the observed 12CO and 13CO fluxes predict only a fraction of such intensity.
The fine-structure line emission from neutral and ionized carbon atoms, as well as other species such as oxygen and nitrogen, is an important key to understanding the properties of the ISM in the region they originate from, as it provides almost all of the gas cooling. For instance, warm and relatively tenuous gas is traced by ionized carbon ([C II]) and oxygen ([O III]), warm and dense gas is traced by both neutral and ionized carbon ([C I] and [C II]) and neutral oxygen ([O I]), and cold and dense gas is primarily traced by carbon monoxide (CO). The two neutral carbon [C I] lines at 370 and 609 μm can be measured from the ground with some difficulty. Observation of the other fine-structure lines, from [O I] at 63 μm to [C II] at 158 μm requires the use of airborne or space-borne platforms.
In this paper, we present observations of these fine-structure lines and a molecular CO line covering the CND and part of the ETD in NGC 5128 in order to continue our study of the central region begun in Paper I, and further investigate the physical conditions applying to the wider surroundings of its super-massive black hole. Parkin et al. (2012, 2014) have published far-infrared line and continuum studies of a much larger part of the ETD than mapped by us. We have little to add to their results on the ETD, and we accept their conclusion that the ETD physical characteristics are similar to those of PDRs in spiral galaxy disks.
In contrast, the dynamics and the excitation of the dense CND gas are expected to reflect the processes occurring in the vicinity of the nuclear supermassive black hole, such as black hole accretion and jet expulsion. In particular, with our CO, [CI], and [CII] line measurements, we have sampled essentially all carbon in the galaxy’s center, allowing us to deduce total masses, as well as the mass fractions associated with the various ISM phases in a more accurate way than was possible before.
Log of Herschel observations.
2. Observations and data handling
2.1. Herschel Space Observatory
All Herschel1 (Pilbratt et al. 2010) observations with the HIFI and PACS instruments described in this paper were obtained as part of the Guaranteed Time Key Programme HEXGAL (PI: R. Güsten). The Herschel observations using HIFI (Heterodyne Instrument for the Far Infrared; de Graauw et al. 2010) and those using SPIRE-FTS (Spectral and Photometric Imaging Receiver and Fourier-Transform Spectrometer; Griffin et al. 2010) have been described in our previous paper on the NGC 5128 CND (Israel et al. 2014). A summary of all Herschel fine-structure line observations, including those already presented by Israel et al. (2014), is given in Table 1.
We have used the Photo-detector Array Camera and Spectrometer (PACS, Poglitsch et al. 2010) on-board Herschel to map the distribution of emission from various far-infrared atomic fine-structure lines in NGC 5128. The PACS array consisted of 5 × 5 “spaxels”, each of 9.4′′ size, combining into a field of 47′′×47′′ which corresponds to 872 × 872 pc at the distance of NGC 5128. The resolution of the Herschel/PACS array varied from 9.5′′ to 13′′ for wavelengths increasing from 60 μm to 180 μm, and was thus undersampled by the individual spaxels. Both PACS observations were carried out in stare mode using chopping and nodding. The array was pointed at the nominal position right ascension (J2000) = 201.3650, declination (J2000) = −43.0191, with a pointing accuracy of 2′′ rms. It was rotated over an angle of 308.9°, thus orienting the array columns in a position angle 129° (more or less) parallel to the extended thin disk (ETD) axis (see Fig. 1, but we note that the major axis of the CND is at a greater position angle (PA = 145°). We used range spectroscopy to cover the full PACS wavelength range in two observations. The first observation covered the wavelength ranges 70−105 μm and 140−220 μm, and the second covered the wavelength ranges 51−73 μm and 102−146 μm (see Table 1). According to the on-line Herschel/PACS observing manual, the photometric calibration accuracy was about 11−12% rms. The absolute wavelength calibration was quoted as better than 20%, approaching 10% in band centers. However, for point-like sources, the accuracy of the absolute wavelength was also determined by how well the point source was centered on the corresponding spaxel; the wavelength-dependent error easily amounted to several tens of kilometers per second.
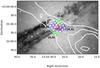 |
Fig. 1 The Herschel/PACS footprint (colored squares) overlay on the SDSS-gray-tone image of the NGC 5128 central region. The different colors have no specific meaning. White contours trace the 21 cm radio continuum emission from the Centaurus A nucleus and jets. The array is oriented along the dark band image of the extended think disk. The circumnuclear disk is not distinguishable in this image, but is oriented at right angles to the jet direction. In the image, 1′ corresponds to 1.1 kpc. |
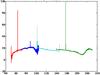 |
Fig. 2 Spectrum observed in the 175 pc sized central (2, 2) spaxel of the PACS array, extending over the full range of wavelengths observed. The emission lines from Table 2 are easily identified, as is the OH absorption line at a wavelength of 119 μm. The four PACS spectral bands are indicated by different colors. (Flux is in Jy, wavelength in μm.) |
Spectral lines observed with Herschel/PACS.
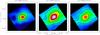 |
Fig. 3 Maps of the far-infrared continuum emission from the NGC 5128 central region. Left: 60 μm map; center 100 μm; right: 160 μm map. All maps have contours at intervals of 0.5 Jy per PACS spaxel over the range 0.5−5 Jy/spax, and 2 Jy/spax over the range 6−20 Jy/spax. Heavy contours are at 5, 10, and 15 Jy/spax. The maps cover an area of roughly 0.01°×0.01°, corresponding to 0.67 kpc × 0.67 kpc. |
The initial data processing was done using HIPE version 6.0. We used the standard PACS pipeline for chop/nod observations of extended sources, and version 16 of the PACS calibration. We then used custom-made IDL and Python scripts to further analyze the data. First, we extracted individual data cubes from the portions of the spectra (cf. Fig. 2) containing line emission. The lines are identified in Table 2. We removed linear baselines from these cubes, excluding those regions that contained lines or instabilities from the fit. This was sufficient for all the lines except for the [NIII]57 μm and [NII]205 μm lines that are close to band edges (see Fig. 2) where we had to subtract a third-order baseline. In addition, the absolute PACS calibration of the [NII]205 μm was very uncertain because of filter leakage and rapidly declining detector response (A. Poglitsch, priv. comm.) – see Fig. 2. We have therefore also scaled extracted line fluxes to fit the SPIRE-derived [NII]205 μm line flux (Israel et al. 2014) in the corresponding aperture. Finally, we have noted a strong and broad spectral feature in the [NII]122 μm line spectra, displaced by about 2000 km s-1 from the systemic velocity. According to information from the Herschel on-line PACS manual, this was a spectral ghost from the strong [CII]158 μm line caused by a second pass in the optics of the PACS spectrometer.
2.2. APEX 12 m
We have used the Vertex Antennentechnik ALMA prototype Atacama Pathfinder Experiment (APEX)2 12-m telescope (Güsten et al. 2006) to observe the nucleus of NGC 5128 in the two submillimeter [C I] transitions at 492 and 809 GHz, as well as the 12COJ = 4−3 transition at 461 GHz. The location of APEX at the high elevation of 5105 m rendered it very suitable to high-frequency observations from the ground. The observations were mostly made with the First Light APEX Submillimeter Heterodyne (FLASH) dual-frequency receiver (Heyminck et al. 2006; Klein et al. 2014) and the Carbon Heterodyne Array (CHAMP+) receiver (Güsten et al. 2008; Kasemann et al. 2006), both developed by the Max Planck Institut für Radioastronomie in Bonn (Germany); additional 492 GHz observations were obtained with the Swedish Heterodyne Facility Instrument (SHeFI) APEX-3 receiver (Vassilev et al. 2008). Main-beam efficiencies were 0.60 and 0.43 at operating frequencies of 464 and 812 GHz, respectively. At the same frequencies, the antenna temperature to flux density conversion factors were 48 and 70 Jy/K, respectively. APEX FWHM beamwidths are 13.5′′ at 461 GHz, 12.7′′ at 492 GHz, and 7.7′′ at 809 GHz, a range very similar to the resolution of the Herschel/PACS data described in this paper.
All observations were made under excellent weather conditions with typical overall system temperatures of 7500 K for CHAMP+-II (SSB, 800 GHz), and 500−800 K for FLASH-I (DSB, 460 and 490 GHz). Calibration errors were estimated at 15 to 20%. Observations were conducted with Fast Fourier Transform Spectrometer (FFTS; Klein et al. 2006) back-ends for all instruments, except CHAMP+, where only the two central pixels were attached to the FFTS back-ends. Other CHAMP+ pixels were attached to the MPI Array Correlator System (MACS) backends. FFTS backends were able to reach resolutions of 0.12 MHz (0.045 km s-1 at 800 GHz), while the MACS units were used at a resolution of 1 MHz (0.36 km s-1 at 800 GHz). For the CHAMP+ data, pointing was accurate within ~5′′. All observations were taken in position switching mode with reference positions in azimuth ranging from 600′′ to 3600′′.
The nuclear position was observed at various times between 2007 and 2011. We mapped the CND in four observing runs between Fall 2013 and Fall 2014 in both the [CI] 492 GHz and the 12COJ = 4−3 461 GHz transitions: (observing program 0-092.F-9332A-2013/M0025-92). The maps were made in a rectangular grid with full sampling (grid spacing 6.5′′) and a major axis position angle PA = 145°.
3. Results
3.1. The CND far-infrared continuum spectrum
The spatial resolution of the Herschel/PACS observations is sufficient to disentangle the circumnuclear disk far-infrared continuum emission from both the strong emission from the extended dust structures and from the nucleus itself. Except for small differences in resolution (see Table 2), the continuum maps shown in Fig. 3 resemble one another and also the CO(2−1) map published by Espada et al. (2009). At the PACS resolution, there is continuum emission in each map spaxel. The lowest levels in the map vary from 1 Jy/spax to 3 Jy/spax, typically about 15% of the peak emission in the map. Superposed on this base level is an extended emission structure roughly twice as bright that represents the so-called parallelogram structure that is seen in all far-infrared and submillimeter maps. Both the base level emission and the parallelogram emission are part of the ETD rather than the CND.
In the map centers, the bright and just-resolved emission from the CND is an elliptical source in position angle PA ≈135°, where the position angle is counted counter-clockwise from north. The peak at the nuclear position is partly due to the non-thermal nuclear point source coincident with the supermassive black hole. We may extrapolate the submillimeter nuclear flux densities summarized in Sect. 3.2 of Paper I with the power-law spectrum Fν∝ν-0.36 (Meisenheimer et al. 2007). At the wavelengths studied here, this milli-arcsecond nuclear source has a flux density of about 4 Jy. Taking into account this contribution, it still appears that the dusty disk depicted in Fig. 3 is significantly brighter in the center. However, the characteristic dimensions of the various continuum structures are close to the resolution and pixel size of the PACS observations, and a more accurate separation of the nuclear compact source, the slightly extended CND, and the more extended ETD structures is hard to achieve.
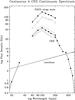 |
Fig. 4 Far-infrared spectra of the central disk in NGC 5128. The curve at the top is the sum of all flux densities in the maps. The straight line is the (extrapolated) emission from the milli-arcsecond nuclear point source. The spectrum of the CND is corrected for the contribution of this nuclear point source; the four unconnected segments mark data from Spitzer LL, PACS, SPIRE-SWS, and SPIRE-LWS, respectively. Thin lines around the PACS segment indicate the uncertainty mostly caused by the difficulty of separating the peak from the extended surroundings. The dotted line marks the spectrum of the emission in the map after subtraction of both the CND and nucleus flux contributions. |
In Fig. 4 we show the spectrum of the continuum emission summed over the entire PACS footprint, the extrapolated nuclear point source spectrum, and the spectrum of the emission from the bright circumnuclear disk only. In the CND spectrum we include the continuum flux densities measured with Herschel SPIRE (Paper I) and Spitzer (Weedman et al. 2005). The CND flux densities are summarized in Table 3. The SPIRE-SWS flux densities had a spatial resolution of 18′′ and should provide a reasonably good representation of the CND spectrum. The SPIRE-LWS flux densities were obtained with apertures between 36′′ and 30′′ and were less accurate as they will contain a varying contribution from the ETD in addition to the CND flux. The Spitzer data were obtained with slits 10′′−20′′ wide, comparable to the CND dimensions.
CND continuum flux densities.
APEX J = 1–0 [CI] and J = 4–3 12CO map line fluxes.
The nuclear point source outshines the entire CND at all wavelengths shorter than 25 μm and longer than 350 μm. The 60 μm/160 μm flux density ratios of the CND and ETD emission are significantly different at values of 0.95 and 0.55 respectively. This implies that the CND is warmer than the ETD, with Td = 31 K versus Td = 28 K for a Rayleigh-Jeans dust spectral index α = −4, close to the values found by Parkin et al. (2012) for the ETD emission from Cen A. The CND has a far-infrared luminosity (IRAS definition) FIR = 1.59 ×10⁻¹² W m-2. If the dust composition and size distribution in the CND are similar to those of the Milky Way – an uncertain assumption, see Galliano et al. 2011 – the CND dust mass would be Mdust≈3.5×10⁵M⊙ with a formal uncertainty less than 10%. In Paper I, we found a CND gas mass Mgas≈8.4×10⁷M⊙ within a factor of two (Israel et al. 2014) implying a CND gas-to-dust ratio of 240 with a similar uncertainty. In Sect. 5.4 of this paper, we will refine the mass determination to Mgas=9.1±0.9 M⊙, changing the gas-to-dust ratio to 260±40. This value falls within the range of gas-to-dust ratios 100−300 found by Parkin et al. (2012) for the ETD, but neither takes into account the systematic uncertainty caused by the assumed dust properties.
Finally, we note that in AGNs, the presence of a central compact far-infrared source is often interpreted as a high-star-formation nuclear cusp (see e.g., Mushotzky et al. 2014). The example of Cen A shows that this is not necessarily the case. The CND is compact and bright in the far-infrared, but its molecular gas is cold and not associated with star formation (Paper I). We could establish its true nature only because it is so near.
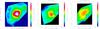 |
Fig. 5 Maps of the fitted J = 4−3 12CO (left panel) and J = 1−0 [CI] line (middle panel) integrated main-beam brightness temperatures towards the center of Cen A. The fitted maps are almosat completely insensitive to the absorption against the continuum nucleus that would otherwise depress the line fluxes at the center. Contour values are in steps of 6 K km s-1 for [CI] and 5 K km s-1 for CO and peak at 110 K km s-1 and 77 K km s-1, respectively (the color wedge is in units of |

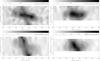 |
Fig. 6 Position-velocity diagrams of the observed emission in J = (1−0) [CI] (top panels) and J = 4−3 12CO (bottom panels). Panels on the left show the velocity distribution along the CND major axis, panels on the right the velocity distribution along a line perpendicular to this, corresponding to the position angle of the radio/X-ray jet. The velocity scale is VLSR. Emission from the CND is at X = ± 10′′ and VLSR = 550 ± 200 km s-1, emission from the ETD extends over the full X-range but is limited to VLSR = 550 ± 50 km s-1. The contours in the J = 4−3 12CO map at lower left are at multiples of 30 mK in Tmb, and at multiples of 40 mK in all other panels. The relatively low brightness at the center of all panels is due to the strong line absorption against the nuclear continuum. When this is taken into account, all diagrams show a central peak at X,Y = 0, VLSR = 550 km s-1 instead. |
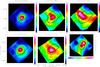 |
Fig. 7 Maps of the far-infrared fine structure line emission from the NGC 5128 central region. Left column: [OI]63 μm (top) and [OI]145 μm (bottom). Line emission contour levels are in steps of 4 × 10-16 and 2 × 10-17 W m-2 respectively. Center column: [CII]158 μm (top) and [OIII]88 μm (bottom). Line emission contour levels are in steps of 3.5 × 10⁻¹⁷ and 2 × 10-16 W m-2 respectively. Right column: [NII]122 μm (top) and [NIII]57 μm (bottom). Line emission contour levels are in steps of 1 × 10-17 and 1.5 × 10⁻¹⁷ W m-2 respectively. Thick solid lines mark the contours of the continuum emission at the line wavelength. Contours are at 8 and 16 Jy for the [OIII] and [CII] lines, and at 7 and 14 Jy for all other lines. |
NGC 5128 spectral line map fluxes.
Overview of atomic line fluxes.
3.2. The submillimeter emission lines
The unusually high brightness of the [C I] lines from the Cen A center with respect to the CO ladder is further illustrated by our new APEX [CI] 492 GHz and 12COJ = 4−3 maps. As discussed in Paper I, emission profiles from the central position are affected by line absorption against the nuclear continuum point source. To correct for this, we have determined velocity-integrated temperatures  dv from gaussians fitted to the observed profiles, excluding the velocity range VLSR = 520−620 km s-1 affected by absorption. The absorption-corrected CO(4−3) and [CI] maps are shown in Fig. 5. In both maps, the corrected emission peaks at the nucleus within the pointing error.
The [CI] emission is more compact (deconvolved FWHM 11′′) than the CO (4−3) emission (deconvolved FWHM 16′′). The bright [CI] is asymmetrical and fans out to the northeast. There is relatively little [CI] emission from the ETD. In contrast to the [CI], the bright CO is remarkable for its symmetrical extension along the northeast-southwest axis, in the same position angle as the radio jet. Its extension along the CND major axis is less conspicuous. Low surface brightness CO emission fills almost the entire map area implying that the ETD contributes significantly to the total CO emission.
In the rightmost panel of Fig. 5, the map of the [CI] to CO (4−3) integrated brightness temperature ratio reveals the relative strength of [CI] in both the CND and in the ISM extending to its northeast. Towards the CND, the [CI] line is 40% stronger than the CO (4−3) line. Northeast of it the ratio is 1.2. Thus, the unusually high [CI]/CO (4−3) ratio noted in Paper I can be directly related to the inner CND. Away from the CND, the ratio drops to the value of 0.5 that characterizes the ETD ISM at greater distances from the nucleus. This ratio is practically identical to the mean value of 0.46 ± 0.03 in a sample of actively star-forming galaxy centers (Israel et al. 2015) and it is thus consistent with the vigorous star-formation seen to take place in the ETD.
The differences between the [CI] and CO (4−3) distributions are underlined by the position-velocity (pV) diagrams in Fig. 6 which are constructed from the observed profiles, not corrected for absorption against the nucleus. The pV diagrams along the CND major axis (lefthand panels) are almost complementary. In the [CI] diagram (top left), the bright and well-defined CND emission contrasts strongly with much fainter ETD emission, once again underlining the dominating nature of [CI] in the CND. The CO (4−3) pV diagram (bottom left) shows the opposite: the bright CO emission from the ETD outshines the fainter CO in the CND.
Especially intriguing are the pV diagrams along the northeast-southwest axis perpendicular to the CND. The [CI]pV diagram (top right) reveals bright CND emission over the full velocity width of ΔV = 200 km s-1, the CO pV diagram (bottom right) shows the bright emission to be more concentrated in velocity. We draw attention to the extensions perpendicular to the CND, at Y = −15′′, VLSR=580 km s-1, and at Y = +20′′, VLSR=480 km s-1 which are relatively faint in the [CI] diagram, but more prominent in the CO (4−3) diagram. These features cover more than twice the CND extent in Y; they are not part of it. The observed CO pV distribution has the appearance of a blend of two components overlapping in the center, each at its own discrete velocity, most likely the signature of a bipolar outflow in both [CI] and CO. Unfortunately, the APEX resolution is insufficient to determine more detail that would provide further clues to the nature of the suspected outflow, and the relative roles of [CI] and CO.
Table 4 in Paper I provided the central [CI] fluxes in both the J = 2−1 and the J = 1−0 line in different apertures. With the aid of the [CI] (1−0) map in Fig. 5 we have reduced these measurements to common apertures for both lines. We found a constant I[CI] (2−1)/I[CI] (1−0) ratio of 0.67±0.05 (corresponding to a flux ratio of 3.0±0.3) for apertures ranging from 10′′ to 28′′.
3.3. The far-infrared fine-structure lines
The PACS spectral line maps (Fig. 7) show emission throughout the 47′′×47′′ (0.9×0.9 kpc) region mapped, although intensities approach zero at the northern boundary. Much of this emission must be due to the ETD, but at the PACS resolution, details are washed out and there is no clear counterpart to the “parallelogram” structure seen in other maps (cf. Espada et al. 2009). In addition to the extended diffuse emission, all line maps show compact, bright emission coincident with the center of the Cen A CND, as well as the northern X-ray/radio jet (cf. the [CII], [NII], [NIII], and [OIII] line maps). Although the CND is very clearly outlined in the continuum maps, the line maps do not unambiguously reveal CND emission outside the center.
The resolution of the images in Fig. 7 is insufficient to determine whether the strong central emission seen in the [OI] and [CII] lines represents a true point source exclusively associated with the nuclear region, or a slightly extended source incorporating the inner CND. We will address this question in Sect. 5.2. Nitrogen line emission is seen primarily towards the northern jet, peaking at a projected distance of 9′′ (165 pc) from the nucleus. This is unlike the emission in the [CII] and [OIII] lines that also extends towards the northern jet but peaks at the center. The ionized nitrogen and carbon maps also show a weak extension to the southwest, away from the jet direction.
In Table 6, we have listed the line fluxes from the various parts of the PACS maps together with the ISO LWS fluxes from Unger et al. (2000). We have included the [CI] and CO(4−3) fluxes from the APEX maps, where necessary integrated over an area corresponding to the PACS flux sums. Comparison of the line intensities in Table 6 shows that, notwithstanding the bright emission from the Cen A nucleus and jet positions, [CII], [OI] and [OIII] emission is also widespread in the ETD. The weak [OI]145 μm line contributes proportionally less to the ETD than the much stronger [OI]63 μm line. The [NII] line emission is seen predominantly towards the nucleus and the jet.
4. Analysis
4.1. LVG modeling of the neutral gas from the sub-millimeter lines
In a previous paper (Israel et al. 2015), we presented an LVG analysis using the Leiden RADEX code of the average properties of the molecular ISM in a sample of 76 luminous galaxies based on the [CI] and selected CO line fluxes. Cen A is part of the sample but its line ratios differ significantly from those of the other galaxies at similar distances. Here we have again applied the method described in that paper to determine the (molecular) ISM properties of the Cen-A CND. We have reduced the fluxes from Paper I and this paper to an aperture of 19′′, essentially covering the CND. The CO and [C I] line ratios shown in Fig. 8 (top) define a mean CND temperature Tkin = 45 K and a density log n( H2) = 4.2 cm-2. The CO/[CI] ratios in Fig. 8 (bottom) were then used to determine the CND mean CO and [CI] column densities at this temperature and density. The various 12CO(4−3)/[CI](1−0) curves correspond to the range of ratios evident in the map in Fig. 5; the three curves shown for 12CO(7−6)/[CI](2−1) illustrate that the results are relatively insensitive to the actual value of that ratio.
The interpretation of the observed fluxes in model terms is complicated by the possibility that part of the [CI] emission from the center is not due to the CND, but comes from the outflow, and that the actual CND temperature is lower than 45 K. We have therefore derived three different solutions exploring the possible range of CND physical parameters. The three solutions are summarized in Table 7. The first assumes that the nominal line ratios at the center are representative for the CND. The second assumes that only two thirds of the central [CI] flux comes from the CND, but that the CND temperature is unchanged at 45 K. The third solution assumes that again only two thirds of the flux comes from the CND, and that the temperature is only 25 K.
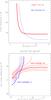 |
Fig. 8 Top: both [CI](2−1)/(1−0) (red) and 12CO(7−6)(4−3) (blue) flux ratios are degenerate with respect to H2 kinetic temperature and density, but the intersection of the two degenerate curves defines a unique value for both. Bottom: with the H2 temperature and density from the left panel, the flux ratios [CI](1−0)/12CO(4−3) (red) and [CI](2−1)/12CO(7−6) (blue) can be used to find neutral carbon and carbon monoxide column densities. Curves are shown for 12CO(4−3)/[CI](1−0) ratios of 1.2 to 0.6 (left to right; the flux ratio of 0.8 is marked by a thicker line) and for 12CO(7−6)/[CI](2−1) ratios of 8, 6, and 4 (thick line). |
From the model column densities, the corresponding gas masses can be calculated. We assumed a CND surface area of 6.8×10⁻⁹ sr (1×10⁵ pc2), and applied filling factors defined as the ratio of the observed flux to the model flux. In order to transform carbon column densities into those of total hydrogen, we assumed a metallicity of 0.75 solar (Table 8), i.e. 12 + log [O] / [H] = 8.55, from which we deduce log [C]/[O] = −0.35 (cf. Garnett et al. 2004). This defined a carbon elemental abundance xC=1.6×10⁻⁴. In the neutral gas, a significant fraction of all carbon may be locked up in dust grains. Reliable estimates of the resulting carbon elemental depletion exist only for the Milky Way (Jenkins 2009). Following this work, we assumed that 60( ± 20)% of all carbon is locked up in dust. Hence, we found a carbon neutral gas-phase abundance  =0.65×10⁻⁴. Finally, all masses were multiplied by a factor of 1.35 to account for the helium component of the ISM. The resulting masses are given in Table 7. In all cases, there is more neutral carbon than carbon monoxide. Only if we lower the temperature to 25 K, does the inferred amount of carbon in neutral atomic form approach that in molecular form.
However, this is not all. The line ratios we have used so far are relatively insensitive to molecular gas at low temperatures and densities, that is mostly sampled by 12CO emission in lower J transitions. With RADEX, we have modeled these lower J CO lines in two extreme cases. In the first, we assumed that this cool, tenuous gas does not contribute to the J = 4−3 transition. In this case, we found a mass Mgas = (1.5 ± 0.7)×107M⊙ with kinetic temperature Tkin = 20 K and space density n H2 = 100 cm-3. This would significantly increase the CO masses in Table 7, making CO a much more important component. In the second case, we allowed as much as half of the CO(4−3) flux to come from the tenuous gas, which then required a lower additional mass Mgas = (0.5 ± 0.3)×107M⊙ at a substantially higher kinetic temperature Tkin = 125±25 K and higher space density n H2 = 500 cm-3. The previously derived dense gas space density is increased by a factor of a few but its mass is virtually unchanged, and the impact of the additional mass to the the total is modest. In either case, the amount of gas associated with neutral carbon is essentially unchanged. We thus conclude that there is an additional mass Mgas = (1.0 ± 0.5)×107M⊙ associated with tenuous molecular gas over and above the mass of dense gas deduced from Fig. 8, also listed in Table 7.
In Paper I, we presented three possible solutions to the LVG analysis of the CND 12CO and 13CO fluxes but were unable to decide which of these was most representative of actual conditions. The analysis presented here suggests the final of these three solutions best describes the CND molecular gas content.
4.2. PDR modeling of the neutral and ionized gas from the far-infrared lines
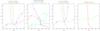 |
Fig. 9 Determination of radiation field G and density no from PDR Tool Box line ratio fits for the CND (left two panels), ETD (second from right), and outflow (rightmost) components using the data from Table 8. The two CND panels illustrate the sequential procedure: in the lefthand CND diagram we fit the [OI] line ratio to the intersection of the [CI] and the [CI]/CO line ratios in order to find the [OI] absorption multiplication factor and then plot the corrected [OI] and [CII] line ratios in the diagram next to it. |
From the fluxes in Table 6, we have derived the representative line ratios in Table 8. These line ratios were then used to diagnose the physical parameters also listed in that table.
Diagnostic line ratios and physical parameters.
For the ionized gas, we have used the [OIII], [NII], and [NIII] lines that all have ionization potentials above 13.6 eV (see Table 2) guaranteeing that they originate in fully ionized (HII) regions. Electron densities ne follow from the [NII]122 μm/[NII]205 μm line ratios, after which the [CII]158 μm/[NII]205 μm is used to find the fractions of the [CII] emission from neutral and fully ionized gas (cf. Oberst et al. 2006). The electron densities so deduced are low throughout (ne≈10 cm-3) except in the CND where they are ten times higher. Fully ionized gas is a modest contributor to the observed [CII] emission, except in the outflow region where it provides a quarter of the flux. The [NIII]57 μm/[NII]122 μm ratio gauges the hardness of the UV radiation field expressed as the mean effective temperature Teff of the exciting stars (see Rubin et al. 1994; Abel et al. 2005). It is lowest in the CND and highest in the outflow, but the differences are small. The metallicity is derived from the ratio of the [OIII] and [NII] lines to the [NIII]57 μm line (Nagao et al. 2012). The modestly sub-solar metallicity in Table 8 is consistent with the value of 0.95 ± 0.35 derived from X-ray observations by Markowitz et al. (2007), and the finding by Möllenhoff (1981) that the HII regions in the ETD have roughly solar abundances.
We have used the on-line calculator PDR Tool Box described by Pound & Wolfire (2008) to derive the conditions in the neutral gas. This exploits the distinctly different dependencies on neutral gas density no and irradiating UV field G exhibited by the various line ratios of species such as [CI], [OI], [CII] and CO combined with the FIR continuum emission (Kaufman et al. 1999, 2006).
Although the bright [OI]63 μm line is commonly used in combination with the [CII] line and the FIR continuum as the primary diagnostic for PDR density and irradiation, its actual usefulness is severely limited because it can be strongly absorbed by its foreground (see for instance Vasta et al. 2010). For this reason, we have first determined the parameters no and G from the CO (4−3) and the two [CI] lines only. This procedure was feasible owing to the fact that both [CI] lines have been observed, which is often not the case. The results were in excellent agreement with those obtained from the LVG analysis in the previous section. In the next step, we determined the [OI]63 μm line intensity multiplication factor that makes the [OI]145 μm/[OI]63 μm ratio fit those values. We found optical depths of 1.5 ± 0.3 for the CND emission and 0.54 ± 0.10 for the ETD emission from the multiplication factors of 4.5 and 1.7 thus obtained (Fig. 9 and Table 8). An independent determination of no and G from the corrected [OI] and [CII] line fluxes combined with the FIR continuum flux density yielded consistent results. We emphasize that the use of [OI] line fluxes in the diagnostic diagrams would have led us to both underestimate the density and overestimate the radiation field by more than an order of magnitude if we had trusted the observed [OI]63 μm line flux without correction.
In the very center of the Cen A CND, the atomic gas cooling is dominated by the [OI]63 μm line even though the line is strongly absorbed. This is the only part of Cen A where the cooling is not dominated by the [CII]158 μm line. The neutral gas densities are much higher than those of the ionized gas, which suggests that the latter are low-density outer layers of dense neutral clouds, ionized by the UV photons from the luminous stars in the ETD. The radiation field of the starburst-hosting ETD, G≈40 G◦, exceeds that of the CND by an order of magnitude, consistent with the absence of star formation in the CND. The very low [OIII]88 μm/[OI]63 μm ratio further illustrates the dominance of the [OI] emission from very dense neutral gas in the CND, in stark contrast to the ten times higher ratio in the more ionized outflow.
Finally, the column density of ionized carbon can be calculated if both gas density and kinetic temperature are known (Pineda et al. 2013, Eq. (1)). We used the data from Table 6, with a spontaneous decay rate Aul = 2.3×10⁻⁶, and collisional de-excitation rate coefficients Rul (electrons) = 1.4×10⁻⁶T-0.37, and Rul ( H2 molecules) = 3.4×10⁻¹⁰T-0.02. Carbon column densities thus obtained are transformed into the column densities of the parent hydrogen gas by assuming the abundances discussed in Sect. 4.1. for a metallicity of 0.75 solar.
Amount of [CII]-related gas in the Cen A center.
The results are shown in Table 9. The mass for the central CND was calculated by taking all [CII] flux from the central pixel; it might in actual fact contain a significant contribution from the outflow. The outflow has an ionized hydrogen mass fraction of about 16%. In the CND, that fraction is ten times lower but the actual mass of gas associated with ionized carbon is eight times larger in the CND than in the outflow.
5. Discussion
5.1. The extent and pressure of gas in the center
The far-infrared fine-structure line maps in Fig. 7 reveal a high-contrast compact core surrounded by lower surface brightness emission from the resolved CND and the much larger ETD. Mid-infrared fine-structure lines, mostly from species with a higher ionization potential, have been observed with ISO and Spitzer (Sturm et al. 2002; Weedman et al. 2005; Quillen et al. 2008; Ogle et al. 2010). They did not resolve the CND but supported the results summarized in Table 8. The [NeV] 14 μm/24 μm and [SIII] 18 μm/33 μm ratios both indicate electron densities less than a few hundred cm-3. The neon lines imply an average ionisation parameter log U ≈ −3.2 (Sturm et al. 2000; Dudik et al. 2007; Nagao et al. 2011), and a total hydrogen column density NH> 1021 cm-2 (Pereira-Santaella et al. 2010). Assuming an electron temperature of about 104 K, appropriate to a fully ionized gas, the ionized gas pressure is nekTe ≈ 10-12 N m-2.
The compactness and structure of the bright core can at present only be determined from high-resolution observations of near-infrared lines. Ground-based Pa-β and [FeII] images showed ridges of hydrogen emission extending from a compact core along the northern radio jet over at least 4′′ (Krajnović et al. 2007), and the [NeII] emission observed by Sturm et al. (2002) originated in nuclear region no more than 3′′ (55 pc) across (Siebenmorgen et al. 2004). K-band H2 observations (Israel et al. 1990; and Israel 1998, his Fig. 10) likewise suggested a size of 3′′−4′′, as well as an enclosed dynamical mass (stars+black hole) of M(dyn) ≥ 5×10⁸M⊙. Detailed HST (Pa-α, [FeII]; Schreier et al. 1998) and VLT-Sinfoni images ([SiVI], Br-γ, [FeII]; Neumayer et al. 2007) revealed an unresolved (d< 0.2′′, <3.7 pc) peak at the nucleus, surrounded by a small (2.5′′×1.5′′, 45 × 30 pc) emission nebula elongated along the jet axis. The distribution of the excited molecular hydrogen mapped by Neumayer et al. (2007), also extends along the radio jet. Its extent is similar to that of the ionic lines but it is less concentrated towards the center.
Thus, the currently available high-resolution information shows that the bright ionized gas at the center of the CND is contained within a radius of at most 30 pc from the nucleus with the exception of more extended emission along the radio jet that we ascribe to outflow (see below). It is very likely that the emission in the far-infrared fine-structure lines discussed in this paper follows the same pattern. This extent is very close to that proposed for the CND central cavity (Israel et al. 1990), and we conclude that the ionized gas is limited to the cavity, either filling it or tracing its edges. The neutral gas outside the cavity has a much higher density and a much lower temperature (Table 8), implying again a pressure nokTk ≈ 10-12 N m-2. We thus find that in the inner CND, the neutral gas just outside the cavity is in approximate pressure equilibrium with the ionized gas inside the cavity.
5.2. The outflow of gas from the center
The PACS maps (Fig. 7) clearly show the presence of ionized gas outflow from the nucleus perpendicular to the CND plane along the radio jet axis. In the nitrogen, lines this outflow outshines even the central core, and it is also prominent in the high-ionization [OIV] and [NeV] lines mapped by Quillen et al. (2008). Ionized emission traces the outflow over a projected distance of about 220 pc, in the same position angle as the elongation of the compact ionized gas traced by the near-infrared emission lines on scales of a few tens of parsecs. Thus, the structure seen in the near-infrared lines represents an ionization cone rather than a compact disk rotating perpendicularly to the CND as has sometimes been proposed (cf. Schreier et al. 1998). This ionization cone was first identified and mapped by Sharp & Bland-Hawthorn (2010) using optical integral-field spectroscopy.
Both the mid-infrared [OIV] and [NeV]Spitzer images and the far-infrared [CII], [NII] and [NIII] PACS images also show an apparent outflow feature towards the southwest. The axis of this complementary feature is offset from that of the northeastern outflow, and it is much less clearly defined. Its reality is, however, not in doubt as it is seen in all the images. The difference between the two sides of the ionized gas outflow resembles the larger-scale difference between the synchrotron and X-ray emission from the Cen A northern and southern inner lobes. In both cases, we see a narrowly collimated feature to the northeast and a much more poorly constrained feature to the southwest.
As shown above, the outflow is also identified in the neutral gas traced by [CI] atoms and excited CO molecules (Figs. 5 and 6). The neutral gas seems to be symmetrically distributed over the two sides of the outflow, although it is really at the limit of our resolution.
5.3. Shocked molecular gas in the center
The dense gas in the compact central core, so close to a supermassive black hole, is in a highly energetic state as shown by the kinematics mapped at high resolution through near-infrared lines (Neumayer et al. 2007).
The K-band (1–0)S(J) H2 line ratios imply the presence either of shock-excited gas at a temperature of ≤1000 K or of fluorescent high-density gas irradiated by a strong UV radiation fields (Israel et al. 1990). However, the central region has negligible star formation (Paper I, Radomski et al. 2008). Shock excitation of the gas is supported by the presence of shock indicators such as ionized iron and silicon, and high [FeII]/Paschen line ratios (cf. Marconi et al. 2000; Krajnović et al. 2007). The sharp rise of the [FeII]/[PII] ratio with apertures up to 1.25′′ (Krajnović et al. 2007) suggests an increasingly dominating shock contribution (see Terao et al. 2016). In addition, the high surface brightness of the 1−0 S(1) (Israel et al. 1990), [FeII]26 μm and [SIII]35 μm lines (Sturm et al. 2002; Ogle et al. 2010) is likewise characteristic for shock excitation and incompatible with the PDR models of Kaufman et al. (2006) for any reasonable combination of density n° and radiation field G. At least the [SIII] flux originates in a region less than 11′′ across, excluding emission from either the outer CND or the outflow.
Ogle et al. (2010) found H2 0–0S(J) fluxes an order of magnitude stronger than the K-band (1–0)S(J) flux. This suggests that most of the warm molecular gas is excited by modest shock velocities well below 20 km s-1 at temperatures below 450 K (Draine et al. 1983; Burton et al. 1992). Ogle et al. modeled their observed H2 (0–0)S(J) fluxes with three temperature components between 100 and 1500 K, assuming a source size of 3.7′′×3.7′′ equal to the Spitzer spectroscopic slit width. The actual source size is not established by the observations and the modeled mass is critically dependent on the assumed temperature of the “coolest” warm gas component. When corrected to our assumed distance, their shocked molecular hydrogen mass is ~ 11% of all the molecular gas in the whole CND (Paper I; this Paper, next section). However, Fig. 10 in Ogle et al. showed that the measured H2 line fluxes are consistent with a two-temperature model at 290 K and 1500 K, lacking the presumptive 100 K component (see also Quillen et al. 2008). This reduced the mass of shocked molecular gas to M( H2) = 0.4×10⁶M⊙, corresponding to a much more reasonable fraction (0.4%) of the total CND gas mass.
5.4. Central mass budget
How does the mass of gas associated with the [CII] emission relate to that associated with neutral atomic carbon and molecular carbon monoxide? The lower angular resolution of the [CI] and CO observations discussed in Sect. 3.2 does not allow us to determine the mass of individual components in the same detailed way as we did for [CII]. Thus, we can only compare the total [CII] related CND gas mass, 5.0×10⁷M⊙, to the masses associated with CO and [CI] from Table 7, (1.3−2.9)×107M⊙ and (1.4−2.8)×107M⊙, respectively. We adopt a CND total mass of dense gas Mgas(dense) = (9.1 ± 0.9)×107M⊙. This value is about 10% higher but more accurate than and consistent with the result from Paper I. It is about half of the mass derived by Kamenetzky et al. (2014) but, as they suggest, that difference is easily explained by the contribution from the ETD in their larger aperture.
Depending on assumptions, the fraction of CND gas directly associated with CO is between 14% (nominal case) and 17−30% (reduced cases); it is a minor fraction under any circumstance. The mass associated with [CI] is similar, between 30% in the nominal case and 18−22% in the reduced cases. Obviously, most of the mass, between 55% nominal and 50−65% reduced, is associated with ionized carbon rather than neutral carbon in any form. Thus, [CII] is the best tracer of dense gas in the center of Cen A, outperforming CO by up to a factor four.
5.5. Outflow dynamics
In Sect. 4.2, we found a [CII]-associated total gas mass for the outflow in PACS pixel (2, 1) of at least 3.4×10⁶M⊙ and nominally 8.0×10⁶M⊙. An even higher mass would be found if either the temperature or the density is significantly lower than we assumed. As the assumed density is close to the critical density, an increase has little effect: if it were a factor of four higher the mass would still be about two thirds of what we determined. However, if the density is a factor of four lower (i.e., log (n) = 3.0) the implied mass would be more than a factor of two higher. Furthermore, only ~ 60% of the total mass in the CND is associated with [CII]. If that also holds for the outflow, its total gas mass will be significantly higher. We therefore adopt a best value Mout( [CII] ) = 1.2(−0.6, + 1.5)×107M⊙, a mass uncertain by a factor two.
In the position-velocity maps of the submillimeter lines presented in Sect. 3.2, we noted features that we interpreted as part of the outflow better seen in the ionized carbon and nitrogen lines. In that case, the northern outflow would have a projected radial velocity  . The pixel size of 9.4′′ corresponds to a projected linear size of l′=174 pc. If i is the angle of the outflow to the line of sight, the actual length is l = l′/sin(i), the space velocity is
  , and it takes a time t = l/v = (l′/v′)tan(i)-1 for matter to clear the outflow pixel. Unfortunately, the viewing angle i is poorly known. If we assume that the CND, whatever its true nature, is a spherically symmetrical structure, its axial ratio of 0.5 suggests i ≈ 60°. Tingay et al. (1998) deduced from the radio jet properties that i should be 50° or higher (up to 80°), Hardcastle et al. (2003) argued for a value less than 50°, preferably about 15°, and Müller et al. (2014) found i to lie between 12° and 45°. Fits of the velocity field of (ionized) gas in the inner 1′′−2′′ suggest outflow viewing angles i = 25°−45° (Neumayer 2010).
If we take i = 50°, the outflow velocity is 95 ± 15 km s-1, and the clearing time is t50 = 2.5 million years. If instead we take i = 15°, the velocity is 60 ± 10 km s-1 but the clearing time increases to t15 = 11 million years. Thus, the uncertainty in viewing angle i is a major source of error. We adopt a viewing angle i = 24°(−9°, + 26°), which corresponds to an intermediate value for the clearing time t24 = 6.5 ± 3.1 million years, again an overall uncertainty by a factor of two.
With these numbers, we deduced a mass outflow rate dM/dt = 1.8 M⊙/yr uncertain by a factor of three. The (mostly atomic) outflow in Cen A is therefore modest compared to the molecular outflows attributed to very luminous galaxies such as Mkn 231. The situation observed in Cen A is superficially similar to that seen in 500 pc surrounding the AGN of M 51 (less energetic by two to three orders of magnitude), where Querejeta et al. (2016) found that the outflow also roughly balances the inflow with about one solar mass per year each. They noted that the ionization cone is lacking in molecular gas although such gas is found along its edges. However, the jet in M 51 is only modestly inclined to the central disk (i ≈ 15°) and their interaction appears to be more complex than that in Cen A with jet and outflow perpendicular to the CND. We note that the Cen A outflow mass found by us is very similar to the reduced mass, M=2×10⁶M⊙, of optically thin molecular gas in the fast (650 km s-1) IC 5063 outflow derived by Dasyra et al. (2016). The Cen A outflow is also comparable to the ionized gas outflows in other nearby AGN and Seyfert galaxies, as summarized by Storchi-Bergmann (2014). These likewise extend over a few hundred of parsecs, with total ionized gas masses very similar to what we found, and mass outflow rates of 1–10 M⊙. Storchi-Bergmann (2014) noted that the mass outflow rates are 100–1000 times the AGN accretion rate, and suggested that the outflows are due to mass loading of AGN jets as they move through the circumnuclear ISM of the host galaxy. In Cen A, the mass outflow rate is also more than three orders of magnitude higher than the accretion rate of the central black hole (dM/dt = 1.2(−0.3, + 0.9)×10-3M⊙/yr, Rafferty et al. 2006), though mass loading of the AGN jet does not appear to be the case. The mass outflow is much more efficient than black hole infall in emptying the circumnuclear cavity, but the mechanism is not clear, nor is its relation to nuclear feedback. At the present mass outflow rate, the entire CND would be depleted of gas in a time somewhere between 15 and 120 million years. Since the ETD is the remnant of a merger that most likely took place 240±80 million years ago (Quillen et al. 1993; Struve et al. 2010), the CND depletion time is a significant fraction of the time elapsed since the creation of the ETD; it may be comparable to it.
Finally, we point out that only for viewing angles well above i = 80°, the outflow space velocity would be high enough to allow material to escape from the inner parts of Cen A. For the more probable lesser viewing angles, the outflowing gas is expected to slow down, become turbulent and spread out over the inner kiloparsec or so. What fraction, if any, will fall back to refuel the CND is at present unclear.
6. Conclusion
We have used the Herschel/PACS instrument and the ground-based APEX telescope to map the inner 0.75×0.75 kpc of the giant elliptical galaxy NGC 5128, hosting the FR-1 radio source, in various lines of atomic carbon, oxygen, and nitrogen, and the J = 4−3 transition of molecular carbon monoxide. This has allowed us to deduce the physical parameters of the interstellar medium in the central region of a galaxy dominated by a supermassive black hole. Although the spatial resolutions 9.5′′–13.5′′ provided are still unsurpassed at these wavelengths, they only just allowed us to resolve the most important structures in the Cen A center.
The most conspicuous is the bright central object, about 20′′ in diameter, that is called the circumnuclear disk (CND), although its actual morphology and structure are unknown. The continuum emission from warm dust in the CND dominates the emission from the nuclear point source only between wavelengths of 25 μm and 300 μm. Under the assumption of a single dust emission curve, the CND temperature is 31 K. Uncertain by factors of two, its mass is about 3.5×10⁵M⊙ and its dust to gas ratio is 260. Neutral gas dominates the CND, only 10% is ionized. The neutral gas has a three-quarter solar metallicity, a gas density of about 20 000 cm-3, and a temperature of 45 K, well above the temperature of the CND dust.
The CND does not appear to be heated by UV photons from newly formed stars, because there is no sign of the intense star formation that is seen in the extended thin disk (ETD) at greater distances to the nucleus. The cooling of the CND is dominated by the [CII]158 μm kine except in the center where the [OI]63 μm emission is strongest, even though it suffers a great deal of absorption.
The CND has a total gas mass (including helium) of Mgas=9.1×10⁷M⊙, with 10% error. Both dense (n=104−105 cm-3) and tenuous (density of a few hundred) molecular gas occurs in the CND. In the dense gas, relatively little carbon is found in CO. More than half of the carbon is ionized and emits in the [CII] line. We found nominal column density ratios 4:2:1 for [CII], [CI], and CO respectively. Although only a few resolution elements cover the CND, the ionized emission appears to be more intense in the center than in the outer parts of the CND. Further comparison with previously published observations of ionized emission at mid-infrared and near-infrared wavelengths suggests that much of the total ionized luminosity of the CND originates in a small central cavity, only a few dozen parsec across, with edges coated by shock-excited H2. The shocked molecular gas mass is probably less than a per cent of the total CND gas mass, but shocks and turbulence nevertheless appear to dominate the central energetics.
An important result from the study described in this paper is the discovery of an outflow of gas from the center of Cen A along an axis close to that of the northern X-ray/radio jet. The outflow was just detected in the neutral gas traced by CO and [CI] emission that suggest a projected outflow velocity of about 60 km s-1, very much less than the sub-relativistic speeds assigned to the radio jet. The outflow was easily seen in the [CII], [NII], and [NIII] emission lines. Although the [CII] intensity peaks at the central position, and gradually decreases along the outflow, the [NII] and [NIII] intensities are highest in the outflow. There may be a less distinct southern counterpart to the well-collimated northern outflow. Because of the marginal resolution, and the tilted appearance of the CND, the mass of gas in the outflow is difficult to establish. The outflow projected clear of the CND has a mass of 8 million solar masses with 30% error. The part of the outflow projected against the CND may have a similar mass (which would reduce the CND mass quoted before to by the same amount).
The mass outflow rate is estimated to be about two solar masses per year, uncertain by a factor of three. The uncertainty is dominated, in equal parts, by possible errors in the mass calculation, and the poorly known viewing angle that determines the projection effects. Notwithstanding the uncertainty, the outflow rate is typically three orders of magnitude higher than the estimated accretion rate of the supermassive black hole. At the same time, it is close to the mass outflow rates identified in nearby Seyfert galaxies. Unless viewing angle are more extreme than seems likely at present, the outflow material will not escape from NGC 5128 altogether, although most of it may not directly fall back onto the CND.
Acknowledgments
We gratefully acknowledge assistance provided in the early stages of this work by Edo Loenen, who supplied most of Table 4, as well as Figs. 1 and 2. We also thank Renske Smit and Sarka Wykes for useful comments that led to improvements in the paper.
References
- Abel, N. P., Ferland, G. J., Shaw, G., & van Hoof, P. M. 2005, ApJS, 161, 65 [NASA ADS] [CrossRef] [Google Scholar]
- Bland, J. 1986, Ph.D. Thesis, Univ. of Sussex (UK) [Google Scholar]
- Bolatto, A. D., Warren, S. R., Leroy, A. K., et al. 2013, Nature, 499, 450 [NASA ADS] [CrossRef] [PubMed] [Google Scholar]
- Burton, M. G., Hollenbach, D. J., & Tielens, A. G. G. M. 1992, ApJ, 399, 563 [NASA ADS] [CrossRef] [Google Scholar]
- Cicone, C., Maiolino, R., Sturm, E., et al. 2014, A&A, 562, A21 [NASA ADS] [CrossRef] [EDP Sciences] [Google Scholar]
- Dasyra, K. M., Combes, F., Oosterloo, T., et al. 2016, A&A, 595, L7 [NASA ADS] [CrossRef] [EDP Sciences] [Google Scholar]
- de Graauw, Th., Helmich, F. P., Phillips, T. G., et al. 2010, A&A, 518, L6 [NASA ADS] [CrossRef] [EDP Sciences] [Google Scholar]
- Draine, B. T., Roberge, W. G., & Dalgarno, A. 1983, ApJ, 264, 485 [NASA ADS] [CrossRef] [Google Scholar]
- Dudik, R. P., Weingartner, J. C., Satyapal, S., et al. 2007, ApJ, 664, 71 [NASA ADS] [CrossRef] [Google Scholar]
- Dufour, R. J., Harvel, C. A., Martins, D. M., et al. 1979, AJ, 84, 284 [NASA ADS] [CrossRef] [Google Scholar]
- Espada, D., Matsushita, S., Peck, A., et al. 2009, ApJ, 695, 116 [NASA ADS] [CrossRef] [Google Scholar]
- Feruglio, C., Fiore, F., Carniani, S., et al. 2015, A&A, 583, A99 [NASA ADS] [CrossRef] [EDP Sciences] [Google Scholar]
- Galliano, F., Hony, S., Bernard, J.-P., et al. 2011, A&A, 536, A88 [NASA ADS] [CrossRef] [EDP Sciences] [Google Scholar]
- Garnett, D. R., Edmunds, M. G., Henry, R. B. C., Pagel, B. E. J., & Skillman, E. D. 2004, AJ, 128, 2772 [NASA ADS] [CrossRef] [Google Scholar]
- Graham, J. A. 1979, ApJ, 232, 60 [NASA ADS] [CrossRef] [Google Scholar]
- Griffin, M. J., Abergel, A., Abreu, A., et al. 2010, A&A, 518, L3 [Google Scholar]
- Güsten, R., Nyman, L.-A., Schilke, P., et al. 2006, A&A, 454, L13 [NASA ADS] [CrossRef] [EDP Sciences] [Google Scholar]
- Güsten, R., Baryshev, A., Bell, A., et al. 2008, SPIE, 7020, 25 [NASA ADS] [Google Scholar]
- Hardcastle, M. J., Worrall, D. M., Kraft, R. P., et al. 2003, ApJ, 593, 169 [NASA ADS] [CrossRef] [Google Scholar]
- Harris, G. L. H., Rejkuba, M., & Harris, W. E. 2010, PASA, 27, 457 [NASA ADS] [CrossRef] [Google Scholar]
- Heyminck, S., Kasemann, C., Güsten, R., de Lange, G., & Graf, U. U. 2006, A&A, 454, L21 [NASA ADS] [CrossRef] [EDP Sciences] [Google Scholar]
- Israel, F. P. 1998, A&ARv, 8, 237 [NASA ADS] [CrossRef] [Google Scholar]
- Israel, F. P., van Dishoeck, E. F., Baas, F., et al. 1990, A&A, 227, 342 [NASA ADS] [Google Scholar]
- Israel, F. P., Güsten, R., Meijerink, R., et al. 2014, A&A, 562, A96 [NASA ADS] [CrossRef] [EDP Sciences] [Google Scholar]
- Israel, F. P., Rosenberg, M. J. F., & van der Werf, P. 2015, A&A, 57, A95 [NASA ADS] [CrossRef] [EDP Sciences] [Google Scholar]
- Jenkins, E. B. 2009, ApJ, 734, 65 [Google Scholar]
- Kamenetzky, J., Rangwala, N., Glenn, J., Maloney, P. R., & Conley, A. 2014, ApJ, 785, 174 [NASA ADS] [CrossRef] [Google Scholar]
- Kasemann, C., Güsten, R., Heyminck, S., et al. 2006, SPIE, 6275, 19 [NASA ADS] [Google Scholar]
- Kaufman, M. J., Wolfire, M. G., Hollenbach, D. J., & Luhman, M. J. 1999, ApJ, 527, 795 [NASA ADS] [CrossRef] [Google Scholar]
- Kaufman, M. J., Wolfire, M. G., & Hollenbach, D. J. 2006, ApJ, 644, 283 [NASA ADS] [CrossRef] [Google Scholar]
- Klein, B., Philipp, S. D., Krämer, I., et al. 2006, A&A, 454, L29 [NASA ADS] [CrossRef] [EDP Sciences] [Google Scholar]
- Klein, T., Ciechanowicz, M., Leinz, C., et al. 2014, IEEE Trans. TeraHertz Sci. Tech., 4, 588 [CrossRef] [Google Scholar]
- Krajnović, D., Sharp, R., & Thatte, N., 2007, MNRAS, 374, 385 [NASA ADS] [CrossRef] [Google Scholar]
- Leroy, A. K., Waqlter, F., Martini, P., et al. 2015, ApJ, 814, 83 [NASA ADS] [CrossRef] [Google Scholar]
- McNamara, B. R., Russell, H. R., Nulsen, P. E. J., et al. 2014, ApJ, 785, 44 [NASA ADS] [CrossRef] [Google Scholar]
- Marconi, A., Schreier, E. J., Koekemoer, A., et al. 2000, ApJ, 528, 276 [NASA ADS] [CrossRef] [Google Scholar]
- Markowitz, A., Takahashi, T., Watanabe, S., et al. 2007, ApJ, 665, 209 [NASA ADS] [CrossRef] [Google Scholar]
- Meisenheimer, K., Tristram, K. R. W., Jaffe, W., et al. 2007, A&A, 471, 453 [NASA ADS] [CrossRef] [EDP Sciences] [Google Scholar]
- Möllenhoff, C. 1981, A&A, 99, 341 [NASA ADS] [Google Scholar]
- Morganti, R., Oosterloo, T., Oonk, J. B. R., Frieswijk, W., & Tadhunter, C. 2015, A&A, 580, A1 [NASA ADS] [CrossRef] [EDP Sciences] [Google Scholar]
- Müller, C., Kadler, N., Ojha, R., et al. 2014, A&A, 569, A115 [NASA ADS] [CrossRef] [EDP Sciences] [Google Scholar]
- Mushotzky, R. F., Shimizu, T. T., Meléndez, M., & Koss, M. 2014, ApJ, 781, L34 [NASA ADS] [CrossRef] [Google Scholar]
- Nagao, T., Maiolino, R., Marconi, A., & Matsuhara, H. 2011, A&A, 526, A149 [NASA ADS] [CrossRef] [EDP Sciences] [Google Scholar]
- Neumayer, N. 2010, PASA, 27, 449 [NASA ADS] [CrossRef] [Google Scholar]
- Neumayer, N., Cappellari, M., Reunanen, J., et al. 2007, ApJ, 671, 1329 [NASA ADS] [CrossRef] [Google Scholar]
- Nicholson, R. A., Bland-Hawthorn, J., & Taylor, K. 1992, ApJ, 387, 503 [NASA ADS] [CrossRef] [Google Scholar]
- Oberst, T. E., Parshley, S. C., Stacey, G. J., et al. 2006, ApJ, 652, L125 [NASA ADS] [CrossRef] [MathSciNet] [Google Scholar]
- Ogle, P., Boulanger, F., Guillard, P., et al. 2010, ApJ, 724, 1193 [NASA ADS] [CrossRef] [Google Scholar]
- Parkin, T. J., Wilson, C. D., Foyle, K., et al. 2012, MNRAS, 422, 2291 [NASA ADS] [CrossRef] [Google Scholar]
- Parkin, T. J., Wilson, C. D., Schirm, M. R. P., et al. 2014, ApJ, 787, 16 [NASA ADS] [CrossRef] [Google Scholar]
- Pereira-Santaella, M., Diamond-Stanic, A. M., Alonso-Herrera, A., & Rieke, G. H. 2010, ApJ, 725, 2270 [NASA ADS] [CrossRef] [Google Scholar]
- Pilbratt, G. L., Riedinger, J. R., Passvogel, T., et al. 2010, A&A, 518, L1 [CrossRef] [EDP Sciences] [Google Scholar]
- Pineda, J. L., Langer, W. D., Velusamy, T., & Goldsmith, P. F. 2013, A&A, 554, A103 [NASA ADS] [CrossRef] [EDP Sciences] [Google Scholar]
- Poglitsch, A., Waelkens, C., Geis, N., et al. 2010, A&A, 518, L22 [NASA ADS] [CrossRef] [EDP Sciences] [Google Scholar]
- Pound, M. W., & Wolfire, M. G. 2008, Astronomical Data Analysis Software and Systems, eds. R. W. Argyle, P. S. Bunclark, & J. R. Lewis, ASP Conf. Ser., 394, 654 [Google Scholar]
- Quillen, A. C., Graham, J. R., & Frogel, J. A. 1993, ApJ, 412, 550 [NASA ADS] [CrossRef] [Google Scholar]
- Quillen, A. C., Bland-Hawthorn, J., Green, J. D., et al. 2008, MNRAS, 384, 1469 [NASA ADS] [CrossRef] [Google Scholar]
- Radomski, J. T., Packham, C., Levenson, N. A., et al. 2008, ApJ, 681, 141 [NASA ADS] [CrossRef] [Google Scholar]
- Rafferty, D. A., McNamara, B. R., Nulsen, P. E. J., & Wise, M. W. 2006, ApJ, 652, 216 [NASA ADS] [CrossRef] [Google Scholar]
- Rubin, R. H., Simpson, J. P., Lord, S. D., et al. 1994, ApJ, 420, 772 [NASA ADS] [CrossRef] [Google Scholar]
- Russell, H. R., McNamara, B. R., Edge, A. C., et al. 2014, ApJ, 784, 78 [NASA ADS] [CrossRef] [Google Scholar]
- Schreier, E. J., Marconi, A., Axon, D. J., et al. 1998, ApJ, 499, L143 [NASA ADS] [CrossRef] [Google Scholar]
- Sharp, R. G., & Bland-Hawthorn, J. 2010, ApJ, 711, 818 [NASA ADS] [CrossRef] [Google Scholar]
- Siebenmorgen, R., Krügel, E., & Spoon, H. W. W. 2004, A&A, 414, 123 [NASA ADS] [CrossRef] [EDP Sciences] [Google Scholar]
- Sturm, E., Lutz, D., Verma, A., et al. 2002, A&A, 393, 821 [NASA ADS] [CrossRef] [EDP Sciences] [Google Scholar]
- Storchi-Bergmann, T. 2014, Proc. IAU, 303, 354 [NASA ADS] [Google Scholar]
- Struve, C., Oosterloo, T. A., Morganti, R., & Saripalli, L. 2010, A&A, 515, A67 [NASA ADS] [CrossRef] [EDP Sciences] [Google Scholar]
- Terao, K., Nagao, T., Hashimoto, T., et al. 2016, ApJ, ApJ, 833, 190 [NASA ADS] [CrossRef] [Google Scholar]
- Tingay, S. J., Jauncey, D. L., Reynolds, J. E., et al. 1998, AJ, 115, 960 [NASA ADS] [CrossRef] [Google Scholar]
- Unger, S. J., Clegg, P. E., Stacey, G. J., et al. 2000, A&A, 355, 885 [NASA ADS] [Google Scholar]
- Vassilev, V., Meledin, D., Lapkin, I., et al. 2008, A&A, 490, 1157 [NASA ADS] [CrossRef] [EDP Sciences] [Google Scholar]
- Vasta, M., Barlow, M. J., Viti, S., Yates, J. A., & Bell, T. A. 2010, MNRAS, 404, 1910 [NASA ADS] [Google Scholar]
- Weedman, D. W., Hao, L., Higdon, S. J. U., et al. 2005, ApJ, 633, 706 [NASA ADS] [CrossRef] [Google Scholar]
- Wykes, S., Hardcastle, M. J., Karakas, A. I., & Vink, J. S. 2015, MNRAS, 447, 1001 [NASA ADS] [CrossRef] [Google Scholar]
- Querejeta, M., Schinnere, E., García-Burillo, S., et al. 2016, A&A, 593, A118 [NASA ADS] [CrossRef] [EDP Sciences] [Google Scholar]
All Tables
All Figures
|
Fig. 1 The Herschel/PACS footprint (colored squares) overlay on the SDSS-gray-tone image of the NGC 5128 central region. The different colors have no specific meaning. White contours trace the 21 cm radio continuum emission from the Centaurus A nucleus and jets. The array is oriented along the dark band image of the extended think disk. The circumnuclear disk is not distinguishable in this image, but is oriented at right angles to the jet direction. In the image, 1′ corresponds to 1.1 kpc. |
| In the text | |
|
Fig. 2 Spectrum observed in the 175 pc sized central (2, 2) spaxel of the PACS array, extending over the full range of wavelengths observed. The emission lines from Table 2 are easily identified, as is the OH absorption line at a wavelength of 119 μm. The four PACS spectral bands are indicated by different colors. (Flux is in Jy, wavelength in μm.) |
| In the text | |
|
Fig. 3 Maps of the far-infrared continuum emission from the NGC 5128 central region. Left: 60 μm map; center 100 μm; right: 160 μm map. All maps have contours at intervals of 0.5 Jy per PACS spaxel over the range 0.5−5 Jy/spax, and 2 Jy/spax over the range 6−20 Jy/spax. Heavy contours are at 5, 10, and 15 Jy/spax. The maps cover an area of roughly 0.01°×0.01°, corresponding to 0.67 kpc × 0.67 kpc. |
| In the text | |
|
Fig. 4 Far-infrared spectra of the central disk in NGC 5128. The curve at the top is the sum of all flux densities in the maps. The straight line is the (extrapolated) emission from the milli-arcsecond nuclear point source. The spectrum of the CND is corrected for the contribution of this nuclear point source; the four unconnected segments mark data from Spitzer LL, PACS, SPIRE-SWS, and SPIRE-LWS, respectively. Thin lines around the PACS segment indicate the uncertainty mostly caused by the difficulty of separating the peak from the extended surroundings. The dotted line marks the spectrum of the emission in the map after subtraction of both the CND and nucleus flux contributions. |
| In the text | |
|
Fig. 5 Maps of the fitted J = 4−3 12CO (left panel) and J = 1−0 [CI] line (middle panel) integrated main-beam brightness temperatures towards the center of Cen A. The fitted maps are almosat completely insensitive to the absorption against the continuum nucleus that would otherwise depress the line fluxes at the center. Contour values are in steps of 6 K km s-1 for [CI] and 5 K km s-1 for CO and peak at 110 K km s-1 and 77 K km s-1, respectively (the color wedge is in units of |
| In the text | |
|
Fig. 6 Position-velocity diagrams of the observed emission in J = (1−0) [CI] (top panels) and J = 4−3 12CO (bottom panels). Panels on the left show the velocity distribution along the CND major axis, panels on the right the velocity distribution along a line perpendicular to this, corresponding to the position angle of the radio/X-ray jet. The velocity scale is VLSR. Emission from the CND is at X = ± 10′′ and VLSR = 550 ± 200 km s-1, emission from the ETD extends over the full X-range but is limited to VLSR = 550 ± 50 km s-1. The contours in the J = 4−3 12CO map at lower left are at multiples of 30 mK in Tmb, and at multiples of 40 mK in all other panels. The relatively low brightness at the center of all panels is due to the strong line absorption against the nuclear continuum. When this is taken into account, all diagrams show a central peak at X,Y = 0, VLSR = 550 km s-1 instead. |
| In the text | |
|
Fig. 7 Maps of the far-infrared fine structure line emission from the NGC 5128 central region. Left column: [OI]63 μm (top) and [OI]145 μm (bottom). Line emission contour levels are in steps of 4 × 10-16 and 2 × 10-17 W m-2 respectively. Center column: [CII]158 μm (top) and [OIII]88 μm (bottom). Line emission contour levels are in steps of 3.5 × 10⁻¹⁷ and 2 × 10-16 W m-2 respectively. Right column: [NII]122 μm (top) and [NIII]57 μm (bottom). Line emission contour levels are in steps of 1 × 10-17 and 1.5 × 10⁻¹⁷ W m-2 respectively. Thick solid lines mark the contours of the continuum emission at the line wavelength. Contours are at 8 and 16 Jy for the [OIII] and [CII] lines, and at 7 and 14 Jy for all other lines. |
| In the text | |
|
Fig. 8 Top: both [CI](2−1)/(1−0) (red) and 12CO(7−6)(4−3) (blue) flux ratios are degenerate with respect to H2 kinetic temperature and density, but the intersection of the two degenerate curves defines a unique value for both. Bottom: with the H2 temperature and density from the left panel, the flux ratios [CI](1−0)/12CO(4−3) (red) and [CI](2−1)/12CO(7−6) (blue) can be used to find neutral carbon and carbon monoxide column densities. Curves are shown for 12CO(4−3)/[CI](1−0) ratios of 1.2 to 0.6 (left to right; the flux ratio of 0.8 is marked by a thicker line) and for 12CO(7−6)/[CI](2−1) ratios of 8, 6, and 4 (thick line). |
| In the text | |
|
Fig. 9 Determination of radiation field G and density no from PDR Tool Box line ratio fits for the CND (left two panels), ETD (second from right), and outflow (rightmost) components using the data from Table 8. The two CND panels illustrate the sequential procedure: in the lefthand CND diagram we fit the [OI] line ratio to the intersection of the [CI] and the [CI]/CO line ratios in order to find the [OI] absorption multiplication factor and then plot the corrected [OI] and [CII] line ratios in the diagram next to it. |
| In the text | |
Current usage metrics show cumulative count of Article Views (full-text article views including HTML views, PDF and ePub downloads, according to the available data) and Abstracts Views on Vision4Press platform.
Data correspond to usage on the plateform after 2015. The current usage metrics is available 48-96 hours after online publication and is updated daily on week days.
Initial download of the metrics may take a while.