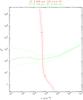
Fig. 9
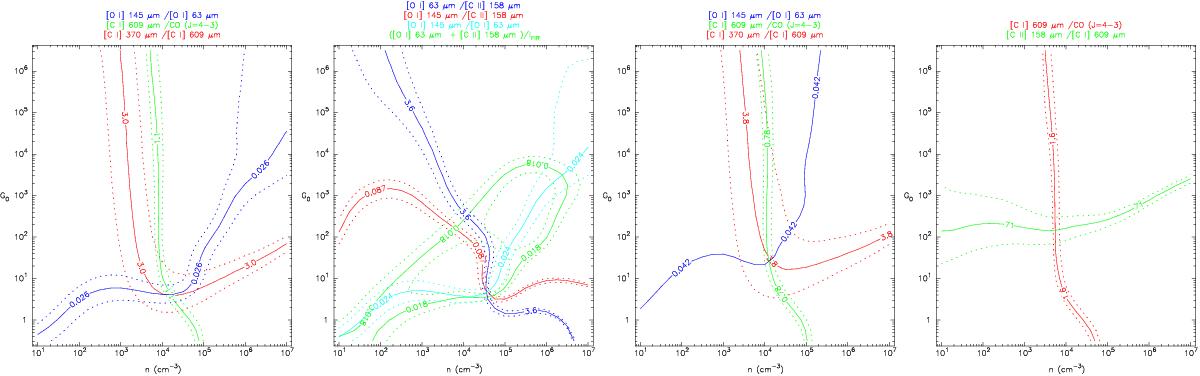
Determination of radiation field G and density no from PDR Tool Box line ratio fits for the CND (left two panels), ETD (second from right), and outflow (rightmost) components using the data from Table 8. The two CND panels illustrate the sequential procedure: in the lefthand CND diagram we fit the [OI] line ratio to the intersection of the [CI] and the [CI]/CO line ratios in order to find the [OI] absorption multiplication factor and then plot the corrected [OI] and [CII] line ratios in the diagram next to it.
Current usage metrics show cumulative count of Article Views (full-text article views including HTML views, PDF and ePub downloads, according to the available data) and Abstracts Views on Vision4Press platform.
Data correspond to usage on the plateform after 2015. The current usage metrics is available 48-96 hours after online publication and is updated daily on week days.
Initial download of the metrics may take a while.