Fig. 2
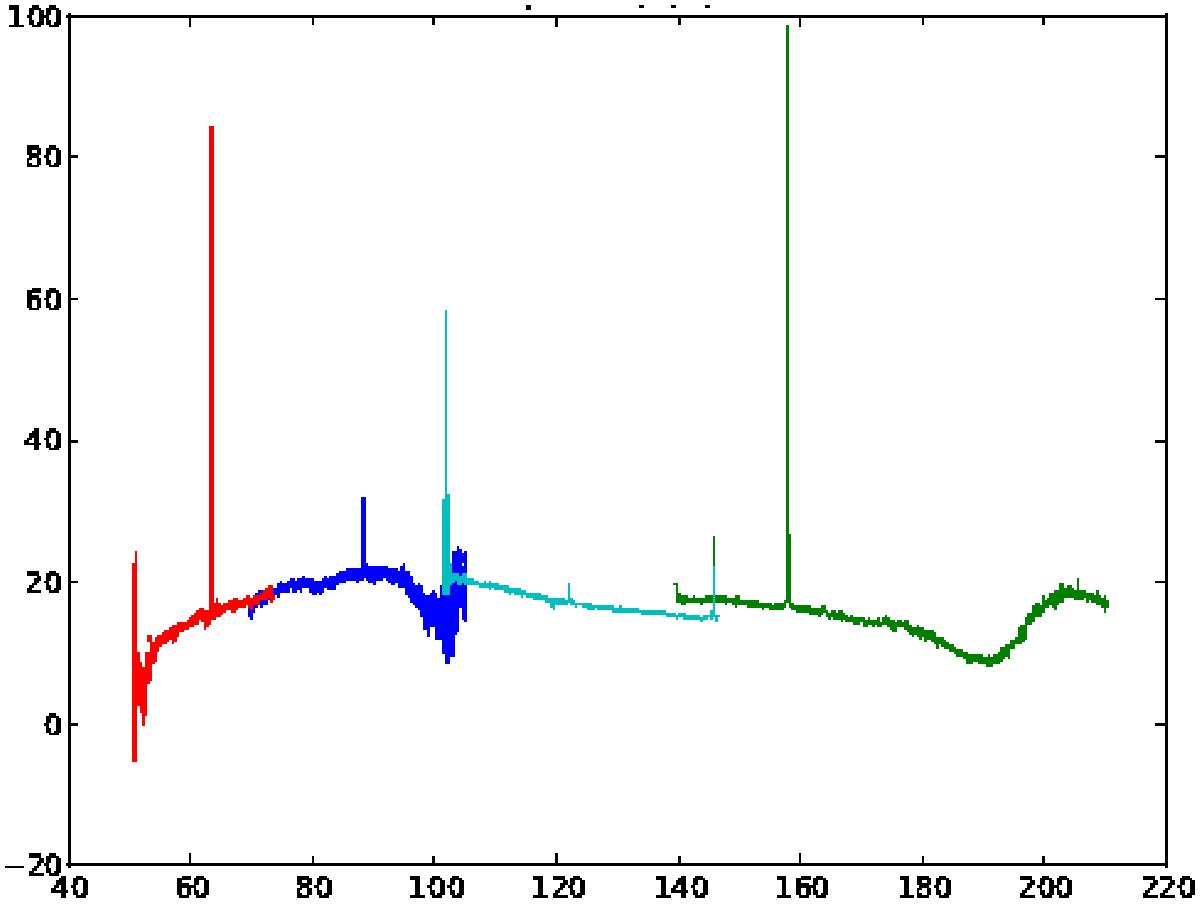
Spectrum observed in the 175 pc sized central (2, 2) spaxel of the PACS array, extending over the full range of wavelengths observed. The emission lines from Table 2 are easily identified, as is the OH absorption line at a wavelength of 119 μm. The four PACS spectral bands are indicated by different colors. (Flux is in Jy, wavelength in μm.)
Current usage metrics show cumulative count of Article Views (full-text article views including HTML views, PDF and ePub downloads, according to the available data) and Abstracts Views on Vision4Press platform.
Data correspond to usage on the plateform after 2015. The current usage metrics is available 48-96 hours after online publication and is updated daily on week days.
Initial download of the metrics may take a while.