Fig. 3
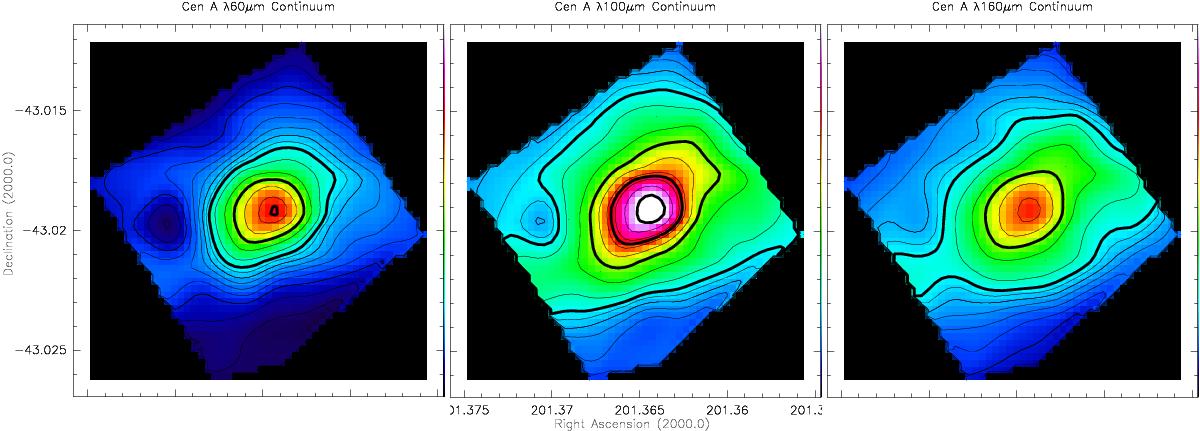
Maps of the far-infrared continuum emission from the NGC 5128 central region. Left: 60 μm map; center 100 μm; right: 160 μm map. All maps have contours at intervals of 0.5 Jy per PACS spaxel over the range 0.5−5 Jy/spax, and 2 Jy/spax over the range 6−20 Jy/spax. Heavy contours are at 5, 10, and 15 Jy/spax. The maps cover an area of roughly 0.01°×0.01°, corresponding to 0.67 kpc × 0.67 kpc.
Current usage metrics show cumulative count of Article Views (full-text article views including HTML views, PDF and ePub downloads, according to the available data) and Abstracts Views on Vision4Press platform.
Data correspond to usage on the plateform after 2015. The current usage metrics is available 48-96 hours after online publication and is updated daily on week days.
Initial download of the metrics may take a while.