Fig. 5
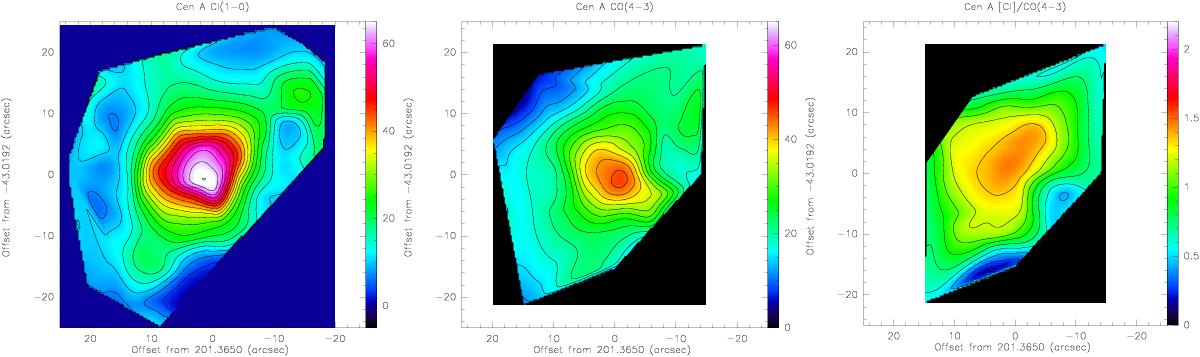
Maps of the fitted J = 4−3 12CO (left panel) and J = 1−0 [CI] line (middle panel) integrated main-beam brightness temperatures towards the center of Cen A. The fitted maps are almosat completely insensitive to the absorption against the continuum nucleus that would otherwise depress the line fluxes at the center. Contour values are in steps of 6 K km s-1 for [CI] and 5 K km s-1 for CO and peak at 110 K km s-1 and 77 K km s-1, respectively (the color wedge is in units of ![]() = 0.6 Tmb). The [CI]/CO ratio map (right panel) has contours at intervals of 0.15 which clearly reveal the outline of the CND and its northeastern extension.
= 0.6 Tmb). The [CI]/CO ratio map (right panel) has contours at intervals of 0.15 which clearly reveal the outline of the CND and its northeastern extension.
Current usage metrics show cumulative count of Article Views (full-text article views including HTML views, PDF and ePub downloads, according to the available data) and Abstracts Views on Vision4Press platform.
Data correspond to usage on the plateform after 2015. The current usage metrics is available 48-96 hours after online publication and is updated daily on week days.
Initial download of the metrics may take a while.