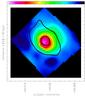
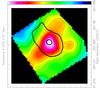
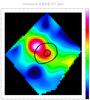
Fig. 7
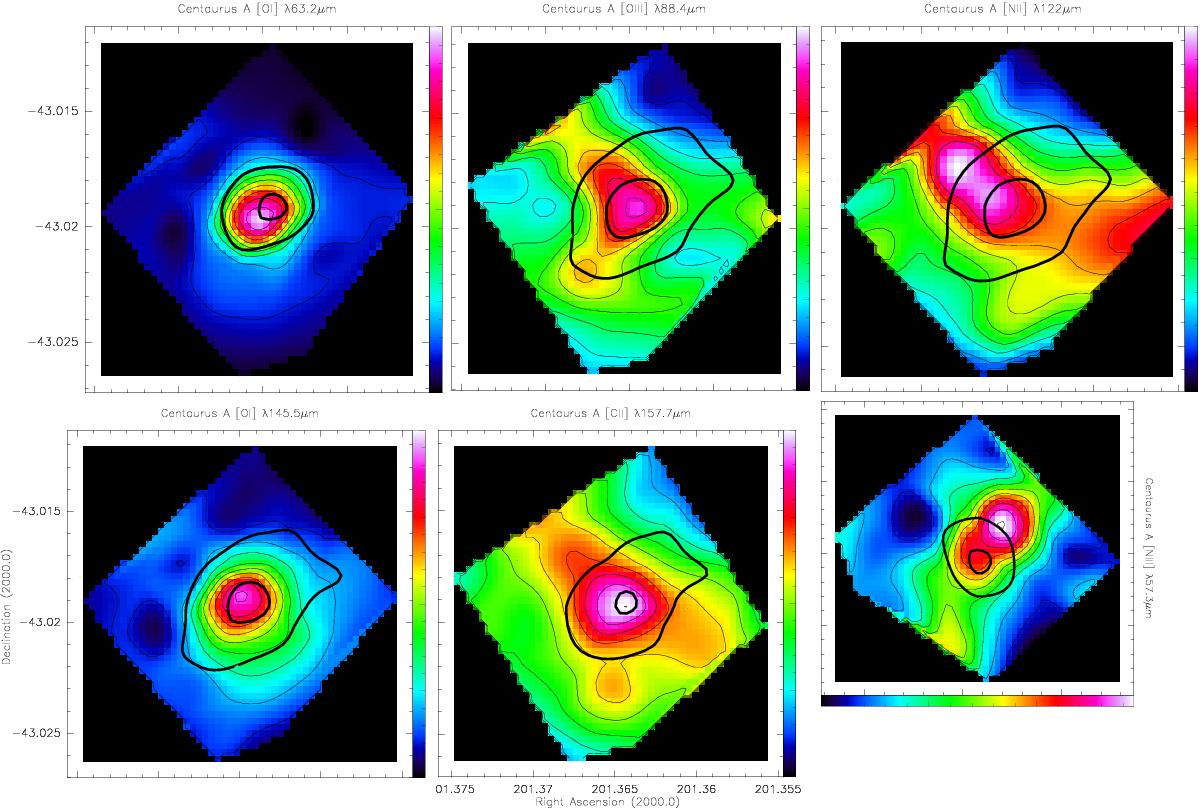
Maps of the far-infrared fine structure line emission from the NGC 5128 central region. Left column: [OI]63 μm (top) and [OI]145 μm (bottom). Line emission contour levels are in steps of 4 × 10-16 and 2 × 10-17 W m-2 respectively. Center column: [CII]158 μm (top) and [OIII]88 μm (bottom). Line emission contour levels are in steps of 3.5 × 10⁻¹⁷ and 2 × 10-16 W m-2 respectively. Right column: [NII]122 μm (top) and [NIII]57 μm (bottom). Line emission contour levels are in steps of 1 × 10-17 and 1.5 × 10⁻¹⁷ W m-2 respectively. Thick solid lines mark the contours of the continuum emission at the line wavelength. Contours are at 8 and 16 Jy for the [OIII] and [CII] lines, and at 7 and 14 Jy for all other lines.
Current usage metrics show cumulative count of Article Views (full-text article views including HTML views, PDF and ePub downloads, according to the available data) and Abstracts Views on Vision4Press platform.
Data correspond to usage on the plateform after 2015. The current usage metrics is available 48-96 hours after online publication and is updated daily on week days.
Initial download of the metrics may take a while.