Fig. 4
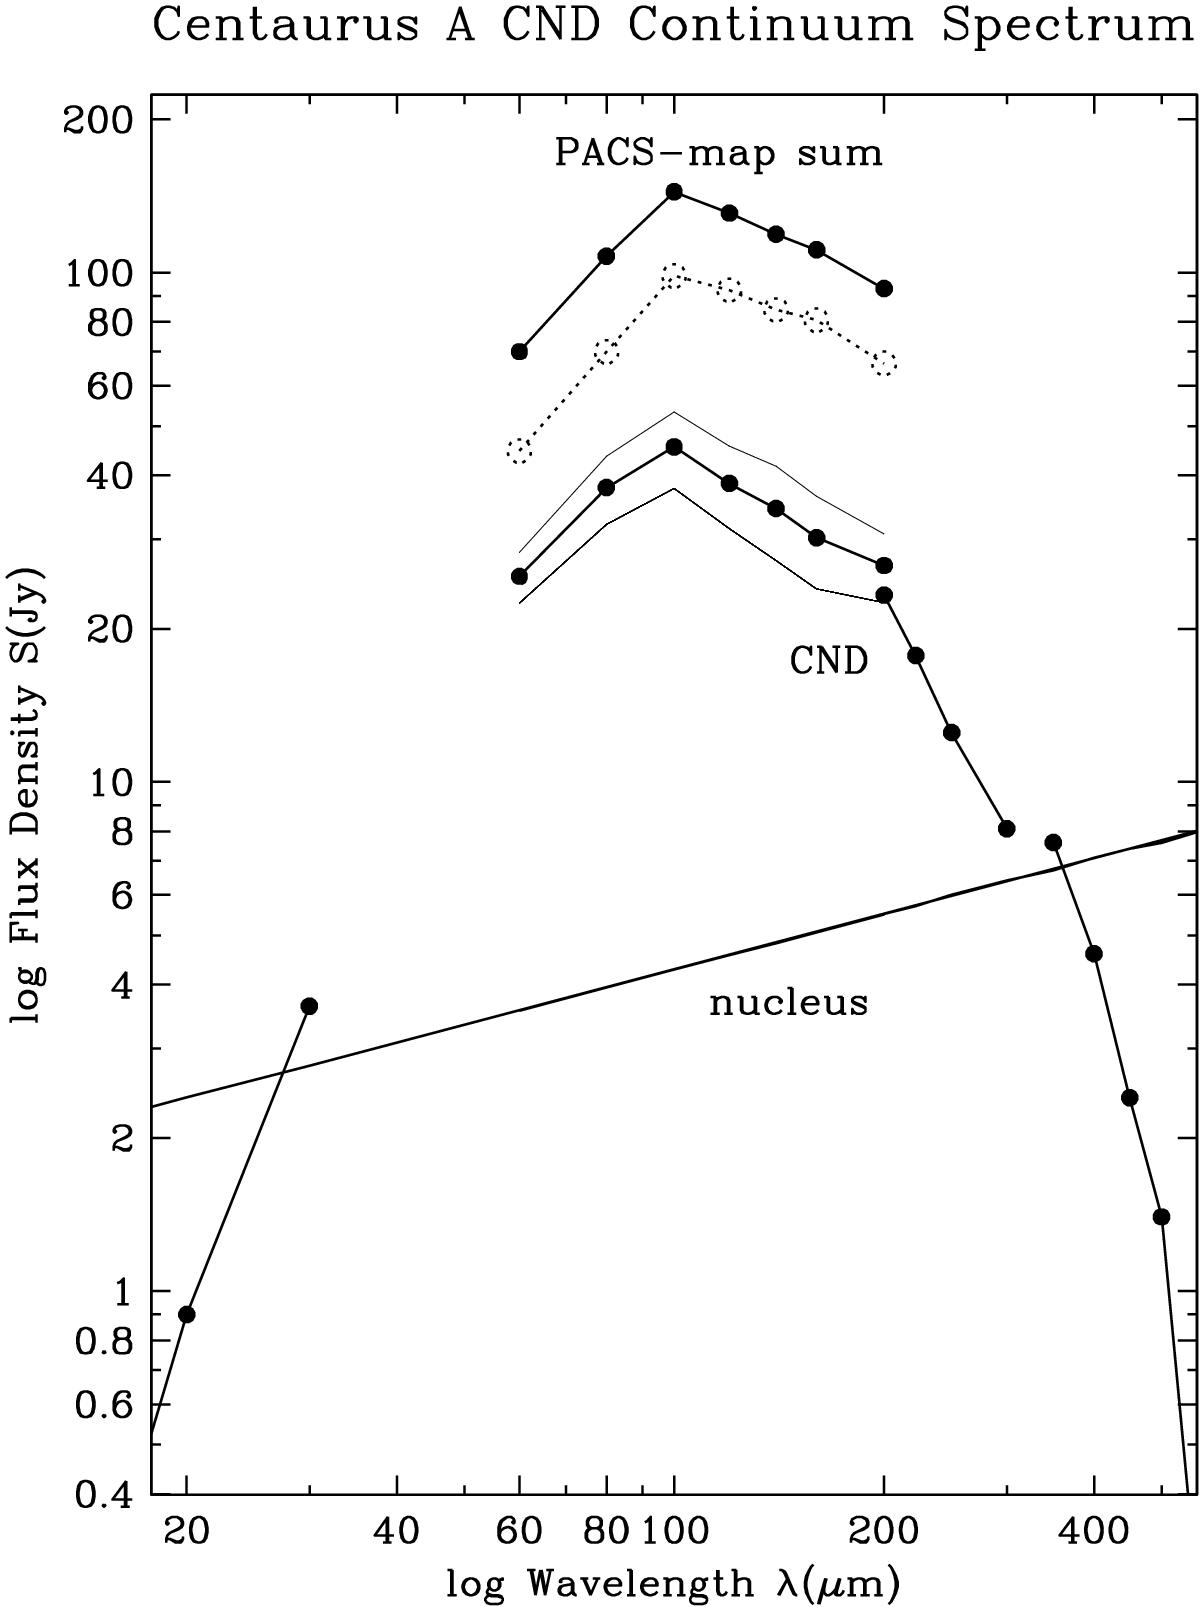
Far-infrared spectra of the central disk in NGC 5128. The curve at the top is the sum of all flux densities in the maps. The straight line is the (extrapolated) emission from the milli-arcsecond nuclear point source. The spectrum of the CND is corrected for the contribution of this nuclear point source; the four unconnected segments mark data from Spitzer LL, PACS, SPIRE-SWS, and SPIRE-LWS, respectively. Thin lines around the PACS segment indicate the uncertainty mostly caused by the difficulty of separating the peak from the extended surroundings. The dotted line marks the spectrum of the emission in the map after subtraction of both the CND and nucleus flux contributions.
Current usage metrics show cumulative count of Article Views (full-text article views including HTML views, PDF and ePub downloads, according to the available data) and Abstracts Views on Vision4Press platform.
Data correspond to usage on the plateform after 2015. The current usage metrics is available 48-96 hours after online publication and is updated daily on week days.
Initial download of the metrics may take a while.