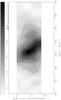
Fig. 6
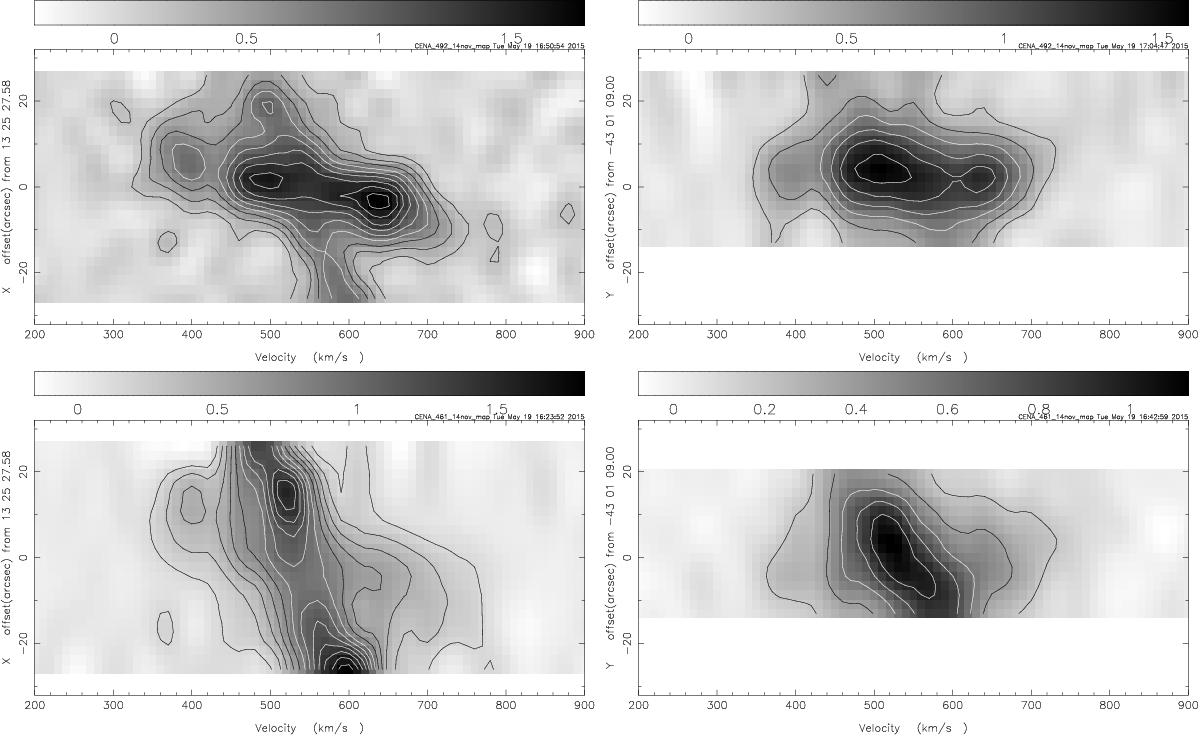
Position-velocity diagrams of the observed emission in J = (1−0) [CI] (top panels) and J = 4−3 12CO (bottom panels). Panels on the left show the velocity distribution along the CND major axis, panels on the right the velocity distribution along a line perpendicular to this, corresponding to the position angle of the radio/X-ray jet. The velocity scale is VLSR. Emission from the CND is at X = ± 10′′ and VLSR = 550 ± 200 km s-1, emission from the ETD extends over the full X-range but is limited to VLSR = 550 ± 50 km s-1. The contours in the J = 4−3 12CO map at lower left are at multiples of 30 mK in Tmb, and at multiples of 40 mK in all other panels. The relatively low brightness at the center of all panels is due to the strong line absorption against the nuclear continuum. When this is taken into account, all diagrams show a central peak at X,Y = 0, VLSR = 550 km s-1 instead.
Current usage metrics show cumulative count of Article Views (full-text article views including HTML views, PDF and ePub downloads, according to the available data) and Abstracts Views on Vision4Press platform.
Data correspond to usage on the plateform after 2015. The current usage metrics is available 48-96 hours after online publication and is updated daily on week days.
Initial download of the metrics may take a while.