| Issue |
A&A
Volume 595, November 2016
|
|
|---|---|---|
| Article Number | A72 | |
| Number of page(s) | 14 | |
| Section | Extragalactic astronomy | |
| DOI | https://doi.org/10.1051/0004-6361/201629441 | |
| Published online | 04 November 2016 | |
GRB 980425 host: [C II], [O I], and CO lines reveal recent enhancement of star formation due to atomic gas inflow ⋆
1 Scottish Universities Physics Alliance (SUPA), Institute for Astronomy, University of Edinburgh, Royal Observatory, Blakford Hill, Edinburgh, EH9 3HJ, UK
e-mail: This email address is being protected from spambots. You need JavaScript enabled to view it.
2 Herschel Science Centre (ESA-ESAC), 28.692 Villanueva de la Cañada, Madrid, Spain
3 Dark Cosmology Centre, Niels Bohr Institute, University of Copenhagen, Juliane Maries Vej 30, 2100 Copenhagen Ø, Denmark
4 Centre for Extragalactic Astronomy, Department of Physics, Durham University, South Road, Durham DH13 LE, UK
5 Centre for Astronomy, Nicolaus Copernicus University, Faculty of Physics, Astronomy and Informatics, Grudziadzka 5, 87100 Toruń, Poland
6 Astronomical Observatory, Adam Mickiewicz University, Słoneczna 36, 60-268, Poznań, Poland
7 Centro de Astronomia e Astrofísica da Universidade de Lisboa, Observatório Astronómico de Lisboa, Tapada da Ajuda, 1349-018 Lisbon, Portugal
8 Leiden Observatory, Leiden University, PO Box 9513, 2300 RA Leiden, The Netherlands
9 INAF–Osservatorio Astrofisico di Arcetri, Largo E. Fermi 5, 50125 Firenze, Italy
10 Sterrenkundig Observatorium, Universiteit Gent, Krijgslaan 281-S9, 9000 Gent, Belgium
11 Instituto de Astrofísica de Andalucía (IAA-CSIC), Glorieta de la Astronomía s/n, 18. 008 Granada, Spain
12 Department of Physics and Astrophysics, Vrije Universiteit Brussel, Pleinlaan 2, 1050 Brussels, Belgium
13 Laboratoire AIM-Paris-Saclay, CEA/DSM/Irfu – CNRS – Université Paris Diderot, CE-Saclay, pt courrier 131, 91191 Gif-sur-Yvette, France
14 XMM Science Operation Centre, ESAC/ESA, Villafranca del Castillo, 28692 Madrid, Spain
15 Thüringer Landessternwarte Tautenburg, Sternwarte 5, 07778 Tautenburg, Germany
16 Technical University of Denmark, Department of Physics, Fysikvej, building 309, 2800 Kgs. Lyngby, Denmark
17 Centro de Astrobiología (INTA-CSIC), Ctra. M-108, km 4, 28850 Torrejón de Ardoz, Madrid, Spain
18 INAF-IASF Bologna, via Gobetti 101, 40129 Bologna, Italy
19 Max-Planck-Institut für Extraterrestrische Physik, Giessenbachstraße, 85748 Garching, Germany
20 The Oskar Klein Centre, Department of Astronomy, AlbaNova, Stockholm University, 106 91 Stockholm, Sweden
21 Key Laboratory of Space Astronomy and Technology, National Astronomical Observatories, Chinese Academy of Sciences, 20A Datun Road, Beijing 100012, PR China
Received: 30 July 2016
Accepted: 6 September 2016
Abstract
Context. Accretion of gas from the intergalactic medium is required to fuel star formation in galaxies. We have recently suggested that this process can be studied using host galaxies of gamma-ray bursts (GRBs).
Aims. Our aim is to test this possibility by studying in detail the properties of gas in the closest galaxy hosting a GRB (980425).
Methods. We obtained the first ever far-infrared (FIR) line observations of a GRB host, namely Herschel/PACS resolved [C ii] 158 μm and [O i] 63 μm spectroscopy, and an APEX/SHeFI CO(2–1) line detection and ALMA CO(1–0) observations of the GRB 980425 host.
Results. The GRB 980425 host has elevated [C ii]/FIR and [O i]/FIR ratios and higher values of star formation rates (SFR) derived from line ([C ii], [O i], Hα) than from continuum (UV, IR, radio) indicators. [C ii] emission exhibits a normal morphology, peaking at the galaxy centre, whereas [O i] is concentrated close to the GRB position and the nearby Wolf-Rayet region. The high [O i] flux indicates that there is high radiation field and high gas density at these positions, as derived from modelling of photo-dissociation regions. The [C ii]/CO luminosity ratio of the GRB 980425 host is close to the highest values found for local star-forming galaxies. Indeed, its CO-derived molecular gas mass is low given its SFR and metallicity, but the [C ii]-derived molecular gas mass is close to the expected value.
Conclusions. The [O i] and H i concentrations and the high radiation field and density close to the GRB position are consistent with the hypothesis of a very recent (at most a few tens of Myr ago) inflow of atomic gas triggering star formation. In this scenario dust has not had time to build up (explaining high line-to-continuum ratios). Such a recent enhancement of star formation activity would indeed manifest itself in high SFRline/SFRcontinuum ratios because the line indicators are sensitive only to recent (≲10 Myr) activity, whereas the continuum indicators measure the SFR averaged over much longer periods (~100 Myr). Within a sample of 32 other GRB hosts, 20 exhibit SFRline/SFRcontinuum> 1 with a mean ratio of 1.74 ± 0.32. This is consistent with a very recent enhancement of star formation that is common among GRB hosts, so galaxies that have recently experienced inflow of gas may preferentially host stars exploding as GRBs. Therefore GRBs may be used to select a unique sample of galaxies that is suitable for the investigation of recent gas accretion.
Key words: dust, extinction / galaxies: individual: ESO 184-G82 / galaxies: ISM / galaxies: star formation / submillimeter: galaxies / gamma-ray burst: individual: 980425
Herschel is an ESA space observatory with science instruments provided by European-led Principal Investigator consortia and with important participation from NASA.
© ESO, 2016
1. Introduction
One of the most important aspects of the evolution of the Universe is how galaxies acquire the gas that fuels star formation. Numerical galaxy formation models require significant gas inflows from the intergalactic medium (IGM) to fuel star formation (e.g. Schaye et al. 2010), and indeed the current gas reservoirs in many galaxies are too low to sustain the current level of star formation, even for normal galaxies like the Milky Way (e.g. Draine 2009). However, despite much indirect evidence for gas inflows (e.g. Sancisi et al. 2008; Sánchez Almeida et al. 2013, 2014b,a; Stott et al. 2013; Wang et al. 2015), they have been claimed to be observationally detected in only a handful of galaxies (Ribaudo et al. 2011; Martin et al. 2014; Michałowski et al. 2015; Turner et al. 2015; Rauch et al. 2016), including host galaxies of long (duration > 2 s) gamma-ray bursts (GRBs).
Because GRBs are explosions of very massive and short-lived stars (e.g. Hjorth et al. 2003; Stanek et al. 2003; for a review see Hjorth & Bloom 2012), they pinpoint locations of recent star formation. Star formation is usually assumed to be fuelled by molecular gas (Carilli & Walter 2013; Rafelski et al. 2016), but several GRB host galaxies show a deficit in molecular gas (H2; Hatsukade et al. 2014; Stanway et al. 2015b). This deficit is unusual for galaxies with normal star formation rates (SFRs) unlike for extreme starbursts. This deficiency is not due to a high CO-to-H2 conversion factor (which happens at low metallicity; Bolatto et al. 2013), as CO-targeted GRB hosts have metallicities 12 + log (O/H) ~ 8.7–9.0 (Castro-Tirado et al. 2007; Levesque et al. 2010b; Stanway et al. 2015a), using the calibrations of Pagel et al. (1979), Kewley & Dopita (2002), Pettini & Pagel (2004), and Maiolino et al. (2008), which is close to the solar metallicity of 12 + log (O/H) ~ 8.66 (Asplund et al. 2004). Moreover, optical spectroscopy of GRB afterglows implies that the molecular phase constitutes only a small fraction of the gas along the GRB line of sight (Vreeswijk et al. 2004; Fynbo et al. 2006; Tumlinson et al. 2007; Prochaska et al. 2009; D’Elia et al. 2010, 2014; Krühler et al. 2013; Friis et al. 2015).
On the other hand, the Australia Telescope Compact Array (ATCA) 21 cm line survey of GRB host galaxies revealed high levels of atomic hydrogen (H i), suggesting that the connection between atomic gas and star formation is stronger than previously thought (Michałowski et al. 2015). Star formation may be directly fuelled by atomic gas, as has been theoretically shown to be possible (Glover & Clark 2012; Krumholz 2012; Hu et al. 2016), and this is supported by the existence of H i-dominated, star-forming regions in other galaxies (Bigiel et al. 2008, 2010; Fumagalli & Gavazzi 2008; Elmegreen et al. 2016). This can happen in a low metallicity gas that is recently acquired, even if the metallicity in other parts of a galaxy is higher, near the onset of star formation because cooling of gas (necessary for star formation) is faster than the H i-to-H2 conversion (Krumholz 2012). Indeed, large atomic gas reservoirs, together with low molecular gas masses (Hatsukade et al. 2014; Stanway et al. 2015b) and stellar masses (Perley et al. 2013, 2015; Vergani et al. 2015), indicate that GRB hosts are preferentially galaxies that have very recently started a star formation episode. This provides a natural route for forming GRBs in low-metallicity environments, as found for most GRB hosts (Fruchter et al. 2006; Modjaz et al. 2008; Levesque et al. 2010a; Han et al. 2010; Boissier et al. 2013; Schulze et al. 2015; Vergani et al. 2015; Japelj et al. 2016; Perley et al. 2016), except of a few examples of hosts with solar or super-solar metallicities (Prochaska et al. 2009; Levesque et al. 2010b; Krühler et al. 2012; Savaglio et al. 2012; Elliott et al. 2013; Schulze et al. 2014; Hashimoto et al. 2015; Schady et al. 2015; Stanway et al. 2015a). Indeed, the GRB collapsar model requires that most of the GRB progenitors have low metallicity (below solar) in order to reduce the loss of mass and angular momentum that is required for launching the jet (Yoon & Langer 2005; Yoon et al. 2006; Woosley & Heger 2006). We note however that other models, while still predicting the metallicity preference (e.g. Izzard et al. 2004; Podsiadlowski et al. 2004; Detmers et al. 2008), allow higher metallicities owing to differential rotation (Georgy et al. 2012), binary evolution (Podsiadlowski et al. 2010; van den Heuvel & Portegies Zwart 2013), or weaker magnetic fields (Petrovic et al. 2005).
Summarising the ATCA H i data support a scenario whereby GRBs are preferentially produced when low-metallicity gas accretes onto a galaxy and undergoes rapid cooling and star formation before it either forms H2 or mixes with the higher metallicity gas in the remainder of the galaxy. This scenario provides a natural explanation for the low-metallicity and low-MH2 preferences. In contrast, at later stages of star formation molecular gas is the dominant phase in the interstellar medium, but the metals are well mixed, and gas has been further enriched, so massive stars do not end their lives as GRBs, and such metal- and molecular-rich galaxies do not become GRB hosts.
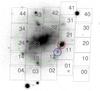 |
Fig. 1 Image in the R-band of the GRB 980425 host (Sollerman et al. 2005) with the position and numbers of the PACS spaxels indicated. The panel is 60′′ × 60′′ (11kpc × 11kpc). The blue and red circles show the position of the GRB and WR region, respectively. Green circle shows the APEX beam for the CO(2–1) observations. |
The gas inflow scenario is also supported by the existence of the companion H i object with no optical counterpart ~19 kpc from the GRB 060505 host, which may be a stream of gas inflowing on this galaxy. In addition the H i centroids of the GRB 980425 and 060505 hosts do not coincide with the optical centres of these galaxies, but are located close to the GRB positions (Michałowski et al. 2015). The concentration of H i close to the GRB 980425 position has been confirmed with high-resolution H i imaging by the Giant Metrewave Radio Telescope (GMRT; Arabsalmani et al. 2015).
Here, we test the gas inflow scenario by investigating in detail the properties of gas in the GRB 980425 host. GRB 980425 at redshift z = 0.0085 (Tinney et al. 1998) and its associated supernova SN 1998bw (Galama et al. 1998) is the closest GRB, and is located in the barred spiral galaxy ESO 184-G82. Hence, it is one of the few GRB hosts for which resolved gas properties can be studied. Of particular importance is a Wolf-Rayet (WR) region ~800 pc northwest of the GRB/SN position (Hammer et al. 2006), dominating the emission of the galaxy at 24 μm (Le Floc’h et al. 2006), 100 μm, and radio (Michałowski et al. 2014b). This region is young (1–6 Myr; Hammer et al. 2006; Christensen et al. 2008) and exhibits the lowest metallicity among star-forming regions within the host with 12 + log (O/H) = 8.16, i.e. 0.3 solar (Christensen et al. 2008), compared with 12 + log (O/H) = 8.6, i.e. 0.8 solar (Sollerman et al. 2005) for the entire host. These values were obtained with the calibrations of Pettini & Pagel (2004) and Kewley & Dopita (2002), respectively.
We use a cosmological model with H0 = 70 km s-1 Mpc-1, ΩΛ = 0.7, and Ωm = 0.3, and so GRB 980425 at z = 0.0085 is at a luminosity distance of 36.5 Mpc and 1′′ corresponds to 175 pc at its redshift.
2. Data
We obtained Herschel (Pilbratt et al. 2010) observations of the GRB 980425 host (project No. OT2_jmcastro_3, PI: J. M. Castro Cerón) using the Photodetector Array Camera and Spectrometer (PACS; Poglitsch et al. 2010) with a total integration time of 4097 s, on 20 Apr. 20131. The data were taken in the line spectroscopy mode with medium chopping/nodding to off source (and off-galaxy) positions, which aids background subtraction. Because of the expected relative brightnesses of the [O i] 63 μm and [C ii] 158 μm lines, the [O i] wavelength was observed approximately nine times longer. The positions of the spaxels are shown on the optical image of the host in Fig. 1.
Data reduction for PACS was performed in the Herschel Imaging Processing Environment (Hipe; Ott 2010) v12.1.0 with version 65.0 of the PACS calibration tree. We used the Ipipe background normalisation script for chop/nod range scan data, which is optimised for faint sources by using off-source positions in the background subtraction and flux calibration. To avoid introducing correlated noise we set the upsample factor to 1 during flat fielding, and to minimise signal losses we also masked the spectral regions in which spectral lines are expected during this process. The final spectra are binned to be Nyquist sampled at the native PACS resolution.
We also performed CO(2–1) observations of the GRB 980425 host on 29 Aug. (precipitable water vapour [pwv] of 1.7 mm), 12 Sep. (pwv of 0.75–0.85 mm), 16 Sep. (pwv of 1.43–1.57 mm), 31 Oct. (pwv of 1.22–1.96 mm), and 01 Nov. 2015 (pwv of 0.66–0.85 mm) using the Swedish Heterodyne Facility Instrument (SHeFI; Vassilev et al. 2008) mounted at the Atacama Pathfinder Experiment (APEX; Güsten et al. 2006; project Nos. 096.D-0280 and 096.F-9302, PI: M. Michałowski). A total of 4.92 h of on-source data were obtained. The APEX-1 single-sideband (SSB) was tuned to the observed frequency of the CO(2–1) line of 228.6 GHz. At this frequency the APEX beam size is 27′′ (~4.8 kpc at the distance of the GRB). All observations were completed in the on-off pattern and the position-switching mode. The fluxes were corrected using the main beam efficiency of 0.75. We reduced and analysed the data using the Continuum and Line Analysis Single Dish Software (Class) package within the Grenoble Image and Line Data Analysis Software2 (Gildas; Pety 2005).
We performed Band 3 ALMA observations on 1 Sep. 2012 (project No. 2011.0.00046.S, PI: M. Michałowski). A total of 67.4 min of on-source data were obtained. Four 1.875 GHz spectral windows were centred at 100.6, 102.4, 112.5, and 114.3 GHz. Twenty-three antennas and baselines ranging between 24 and 384 m were available. Neptune, J1733-130, and J1945-552 were used as flux, bandpass, and phase calibrators, respectively. The amount of precipitable water vapour ranged between 1.8–2.15 mm. The data reduction and analysis were carried out using the Casa package (McMullin et al. 2007). The original spectral resolution was ~488 kHz (~1.3  ). The continuum map was presented in Michałowski et al. (2014b), whereas here we present a data cube at the frequency of the CO(1–0) line (114.288 GHz) binning ten channels resulting in spectral resolution of ~4.9 MHz (corresponding to ~13 ). The synthesised beam of the cube is ~1.7 ″.
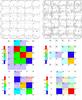 |
Fig. 2 Top: [C ii] (left) and [O i] (right) spectra of each spaxel. The integrated fluxes were measured within inner dotted lines, with the errors within the outer lines excluding the inner region. Middle: [C ii] (left) and [O i] (right) spatial distribution of integrated flux in each spaxel. Bottom: distribution of derived density and radiation field strength. In order to improve the readability of the plots we adopted the following convention. The line-filled boxes correspond to upper limits on the corresponding property if the flux measurement has <3σ significance, but if the measured value is below the lowest value on the colour bar, then the box is white. If the property cannot be measured (n and G0 for spaxels with no detections at [C ii] and [O i]), then the box is also white with no values indicated. The [C ii] emission exhibits a normal radial profile, whereas [O i] emission is concentrated close to the WR region. |
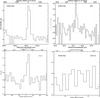 |
Fig. 3 [C ii] (top left), [O i] (top right), CO(2–1) (bottom left), and CO(1–0) (bottom right) spectra of the entire host. The integrated fluxes were measured within inner dotted lines, with the errors within the outer lines excluding the inner region. |
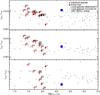 |
Fig. 4 [C ii]-to-continuum (top), [O i]-to-continuum (middle), and [O i]-to-[C ii] (bottom) luminosity ratios as a function of FIR luminosity (40–120 μm). Red circles denote PACS spaxels, blue square denotes the entire host, whereas plus signs, crosses and green diamonds represent normal local galaxies (Malhotra et al. 2001), dwarf galaxies (Cormier et al. 2015), and the Large Magellanic Cloud; the point at a lower luminosity is 30 Doradus and that at the higher luminosity is the entire galaxy (Poglitsch et al. 1995; Israel et al. 1996). The GRB 980425 host has elevated [C ii]/FIR and [O i]/FIR ratios for its FIR luminosity. |
3. Methods
We obtained three estimates of SFRs. First, we calculated 100 μm fluxes within each spaxel using the Herschel/PACS map presented in Michałowski et al. (2014b). We converted these fluxes to total (8–1000 micron) infrared (IR) luminosities using the spectral energy distribution (SED) model of the WR region in the GRB 980425 host (Michałowski et al. 2014b), and to SFRs using the Kennicutt (1998) conversion for the Chabrier (2003) initial mass function (IMF; SFR/M⊙ yr-1 = 10-10LIR/L⊙). We probe close to the peak of the SED, so if we used other templates (e.g. Silva et al. 1998; Iglesias-Páramo et al. 2007; Michałowski et al. 2008, 2010a,b) we would obtain similar results. Then, we estimated the SFRs from the [C ii] and [O i] lines using the conversion of De Looze et al. (2014, their Table 3, the first two rows).
Using far-infrared (FIR) luminosities integrated over 40–120 μm, we modelled the [O i] / [C ii] and ([O i] + [C ii] )/FIR ratios using the Photo Dissociation Region (PDR) Toolbox (Pound & Wolfire 2008; Kaufman et al. 2006)3 with the addition of our own routine to extract errors on density and radiation field intensity from two-dimensional χ2 distributions. In this way we derived the gas density, n, and the ultraviolet (UV) strength of the radiation field, G0, in the unit of the radiation field strength in the solar neighbourhood of 1.6 × 10⁻³ ergs-1 cm-2 (or Habing unit; Habing 1968).
We estimated the molecular gas mass from the CO(2–1) line assuming the flux conversion SCO(1−0) = 0.5 × SCO(2−1) (Fig. 4 in Carilli & Walter 2013), i.e.  , assuming the Galactic CO-to-H2 conversion factor αCO = 5 M⊙/ (K km s-1 pc2).
Finally, we estimated the molecular gas mass from the [C ii] line using the [C ii]/CO(1–0) luminosity ratio of around 5000, typical for star-forming galaxies (Crawford et al. 1985; Wolfire et al. 1989; Stacey et al. 1991, 2010; Swinbank et al. 2012; Rigopoulou et al. 2014; Gullberg et al. 2015; Hughes et al. 2016). As noted by Neri et al. (2014), the luminosities of these lines expressed in brightness temperature units, L′ (K km s-1 pc2), are approximately equal (within a factor of two). Hence, we substituted  with
with  and obtained molecular gas masses with
  , assuming the same CO-to-H2 conversion factor as above.
4. Results
The resulting [C ii] and [O i] spectra in each PACS spaxel are presented in the top row of Fig. 2, whereas the summed spectra of the entire galaxy are shown in Fig. 3. The integrated fluxes were measured within inner dotted lines, with the errors within the outer lines excluding the inner region. Fluxes and luminosities are presented in Table A.1. The flux spatial distributions are shown in the middle row of Fig. 2. The [C ii] flux distribution follows a normal radial dependence with the brightest spaxel at the centre of the galaxy. In contrast, most of the [O i] flux is not at the galaxy centre, but is concentrated close to the WR region (spaxel 11).
The ratios of the [C ii] and [O i] lines and the line-to-continuum ratios of all spaxels and the entire host are shown in Fig. 4, and compared with local normal star-forming galaxies (Malhotra et al. 2001), dwarf galaxies (Cormier et al. 2015) from the Dwarf Galaxy Survey (Madden et al. 2013) and the Large Magellanic Cloud (LMC; Poglitsch et al. 1995; Israel et al. 1996). The GRB 980425 host has elevated [C ii]/FIR and [O i]/FIR ratios for its FIR luminosity and a low [O i]/[C ii] ratio.
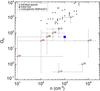 |
Fig. 5 Gas density vs. interstellar radiation field obtained from the PDR modelling. Red circles denote PACS spaxels, blue square denotes the entire host, whereas plus signs represent normal local galaxies (Malhotra et al. 2001). The WR region (spaxel 11) exhibits a high inferred radiation field and density. |
The results of the PDR modelling are shown in the bottom row of Fig. 2 and in Fig. 5. The derived densities and radiation field strengths together with SFRs and molecular gas masses are presented in Table 1. Spaxel 11 has the highest [O i]/[C ii] luminosity ratio (~1.7) among all regions in the host, which leads to the highest radiation field of G0 ~ 1000. Spaxels near the WR regions in the southwestern part of the galaxy (number 11, 22, 31) also have the highest densities in excess of 1000 cm-3.
Figure 6 shows the SFRs derived using luminosities of emission lines: [C ii], [O i] (the calibration of De Looze et al. 2014) and Hα (as reported by Sollerman et al. 2005; Christensen et al. 2008) as a function of SFRs derived from total IR (8–1000 μm) continuum emission. All line estimates are ~1.5–6 times larger than the IR and UV estimates (see Michałowski et al. 2009, 2014b). This is robust because we are comparing the line estimates to the relatively high value of 0.26 M⊙ yr-1 obtained by SED modelling in Michałowski et al. (2014b). If we used the calibration of Kennicutt (1998), then we would obtain 0.1 M⊙ yr-1, whereas that of Murphy et al. (2011, their Eq. (18)) would give 0.17 M⊙ yr-1. On the other hand, if, instead of the calibration of De Looze et al. (2014), we used that of Sargsyan et al. (2012), then for the entire host we would obtain SFR[C ii] ~ 0.465 ± 0.023 M⊙ yr-1, which is also a factor of ~1.7 higher than the IR estimate. In contrast, the calibration of Herrera-Camus et al. (2015) gives a SFR[C ii] ~ 0.115 ± 0.005 M⊙ yr-1, that is lower than SFRIR. It is unclear why this calibration is a factor of ~6 lower than that of De Looze et al. (2014). Yet, we use the calibration of De Looze et al. (2014) given the larger sample size it is based on (530 versus 46), and because the [C ii]/FIR luminosity ratio of the GRB 980425 host is indeed larger than that of other galaxies (Fig. 4), so it is expected that SFR[C ii] > SFRIR.
The APEX CO(2–1) spectrum of the entire host is shown in Fig. 3 and the CO flux, luminosity, and the resulting molecular gas mass are presented in Table 2. The CO-derived molecular mass of ~5.4 × 10⁷M⊙ is lower than the [C ii]-derived molecular mass of ~1.3 × 10⁸M⊙. Both estimates are based on a similar area over which the emission is summed (see Fig. 1), and are lower than the upper limit of 3 × 10⁸M⊙ derived by Hatsukade et al. (2007). Figure 7 demonstrates the high [C ii]/CO(1–0) luminosity ratio of the GRB 980425 host compared with local galaxies (Crawford et al. 1985; Stacey et al. 1991).
The ALMA CO(1–0) spectra extracted from the extents of PACS spaxels are shown in Fig. 9, whereas the spectrum of the WR region extracted within a 1.7′′ radius aperture is shown in Fig. 10. No significant emission is detected, so we measured fluxes within 40 km s-1 width (the H i velocity width at a given position; Fig. 5 of Arabsalmani et al. 2015) at the frequency giving the highest conservative upper limit. These frequencies are shown as dotted lines in Figs. 9, and 10. Figure 3 shows the CO(1–0) spectrum of the entire host extracted within the region shown in Fig. 1 as a green circle. However, this region has a diameter of ~27″, whereas our ALMA observations are not sensitive to smooth emission extended over scales of more than ~11″. Hence, if such emission is present, then our CO(1–0) flux of the entire host is underestimated. The integrated flux ratio of SCO(2−1)/SCO(1−0) > 10 (2σ) is indeed higher than that of any other galaxy (Carilli & Walter 2013), therefore our ALMA observations do not seem to probe the main emission component in the GRB 980425 host. The CO(1–0) fluxes, luminosities, and the resulting molecular gas masses are listed in Table 3. Again, Fig. 7 shows the high [C ii]/CO luminosity ratio of the spaxels that are detected at [C ii].
Physical properties of each spaxel and the entire host.
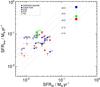 |
Fig. 6 SFRs derived from IR luminosity (8–1000 μm; with the calibration of Kennicutt 1998) vs. those derived from [C ii] (blue), [O i] (red; with the calibration of De Looze et al. 2014), and Hα (green, higher values include dust correction as derived by Christensen et al. 2008) lines. Circles denote PACS spaxels, and squares denote the entire host. The IR estimates are from Michałowski et al. (2014b). The Hα estimate for the WR region is from Christensen et al. (2008), and for the entire host from Sollerman et al. (2005). Dotted lines show the locations at which the SFRline is higher than the SFRIR by the indicated factors. The SFRs derived from line ([C ii], [O i], Hα) indicators are higher than those from continuum (UV, IR, radio) indicators. |
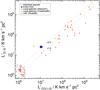 |
Fig. 7 [C ii] luminosity as a function CO(1–0) luminosity of individual spaxels (red arrows), the entire GRB 980425 host (blue square), local galaxies (plus signs, diamonds, and crosses; Stacey et al. 1991; Crawford et al. 1985) and the LMC (green diamond; Israel et al. 1996). The GRB 980425 host has an elevated [C ii]/CO ratio compared with local galaxies. |
APEX CO(2-1) line fluxes and luminosities.
ALMA CO(1–0) line fluxes and luminosities of each spaxel and the WR region.
The resulting star formation efficiency (SFE) is  (assuming ). This is higher than the average for local spirals of ~(48 ± 7) L⊙/ (K km s-1 pc2) derived by Daddi et al. (2010, their Fig. 13), close to the top end of the distribution. Together with three GRB hosts reported to be CO deficient (Hatsukade et al. 2014; Stanway et al. 2015b), the picture emerges that GRB hosts exhibit the lowest CO luminosities among star-forming galaxies, given their SFRs. On the other hand, if we assume that [C ii] is a good tracer of molecular gas, then
  , in agreement with local galaxies.
In order to quantify further the potential molecular-gas deficiency of the GRB 980425 host, we used the relation between the metallicity, atomic gas, and molecular gas for dwarf galaxies provided by Filho et al. (2016, their Sect. 4), based on the calibration of Amorín et al. (2016): log (MH2) = 1.2log (MHI)−1.5 × [12 + log (O/H)−8.7] −2.2. For its atomic gas mass log (MHI/M⊙) ~ 8.849 (Michałowski et al. 2015) and metallicity 12 + log (O/H) ~ 8.6 (Sollerman et al. 2005), the GRB 980425 host should have MH2 ~ 4 × 10⁸M⊙, ~7 times higher than the CO estimate (Table 2) and ~3 times higher than the [C ii] estimate (Table 1). Hence, the GRB 980425 host has a low molecular gas mass for its atomic gas mass and metallicity. A similar conclusion can be obtained from the relation between SFR, CO luminosity, and metallicity presented in Hunt et al. (2015, their Fig. 5): log (SFR/L′CO) = −2.25 × [12 + log (O/H)] + 11.31. According to this relation SFR/L′CO of the GRB 980425 host should be equal to 9.1 × 10⁻⁹M⊙ yr-1/ (K km s-1 pc2), whereas using SFRIR the measured value is ~2.5 times higher: 24 ± 9 × 10⁻⁹M⊙ yr-1/ (K km s-1 pc2), indicating low CO luminosity for its SFR and metallicity.
5. Discussion
5.1. Recent inflow of atomic gas from the intergalactic medium triggering star formation
Summarising, we have the following pieces of information about the GRB 980425 host: i) it has elevated [C ii]/FIR and [O i]/FIR ratios (Fig. 4) and higher values of SFRs derived from line ([C ii], [O i], Hα) than from continuum (UV, IR, radio) indicators (Fig. 6); ii) its [C ii] emission exhibits a normal radial profile, whereas [O i] emission is concentrated close to the WR region (Fig. 2), leading to high inferred radiation field and density (Fig. 5); and iii) its CO luminosity is at the lower end of the distribution for other galaxies, leading to an elevated [C ii]/CO ratio (Fig. 7) and MH2 derived from CO lower by a factor of ~2 than that inferred from [C ii].
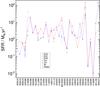 |
Fig. 8 Compilation of SFRs measured from emission lines (red; circles: [C ii], squares: [O i], diamonds: [O ii], asterisks: Hα) and continuum indicators (blue; asterisks: ultraviolet, circles: infrared, squares: radio). The x-axis position corresponds to different GRB hosts. The red and blue lines show the average line- and continuum-based SFR for a given GRB host, respectively. The line-based indicators give on average systematically higher estimates. |
All these observables can be explained by the hypothesis presented in Michałowski et al. (2015) that this galaxy in particular, and possibly most GRB hosts, experienced a very recent inflow of atomic gas triggering star formation. Indeed, H i is concentrated close to the position of the WR region (our spaxels 11, 12, 21; Arabsalmani et al. 2015). In this scenario the newly acquired atomic gas quickly becomes cool and dense, leading to intense star formation (giving rise to the birth of the GRB 980425 progenitor), and explaining the high [O i] and high derived radiation field and density. The accretion event disturbs the gas reservoir in other parts of the galaxy as well, and therefore the total SFR and ionised carbon emission are enhanced. However, dust has not had time to build up and the reprocessing of stellar emission by dust is much slower (see below), and so the infrared emission is still low giving rise to high [C ii]/FIR and SFR[C ii]/SFRIR ratios.
We note that high gas density close to the GRB position (Fig. 5) is consistent with the conclusion of Michałowski et al. (2014b) based on the properties of the WR region. Far-infrared spectroscopy of other GRB hosts is needed to test whether having a high density and radiation field is a condition necessary for GRB explosions.
Our [C ii] and [O i] maps are not of enough resolution to investigate the spatial distribution of the resulting specific SFR (sSFR ≡ SFR/M∗). However, stellar mass is distributed relatively smoothly across the host, and in particular the WR region does not have an exceptionally high or low mass (Christensen et al. 2008; Michałowski et al. 2009). Hence, SFR and sSFR distributions based on Hα emission are very similar (Christensen et al. 2008).
Our data allows us to estimate the timescale of the required gas inflow. The line emission ([C ii], [O i], Hα) is connected with the most massive (O type) stars, hence it traces very recent star formation that happened during the last ~10 Myr. On the other hand, UV, IR, and radio emission traces the average SFR over the last ~100 Myr (Kennicutt 1998), so the continuum emission is relatively insensitive to the enhancement in star formation due to very recent gas inflow. Hence, our hypothesis requires the inflow to happen at most a few tens of Myr ago, so that the line SFR indicators still give higher values than the continuum SFR indicators.
The timescale of less than a few tens of Myr is consistent with the estimates of the age of the GRB progenitor for GRB 980425 in particular, and for all GRBs in general. Sollerman et al. (2005) obtained the stellar age of the region in which GRB 980425 exploded of ~6 Myr, which is consistent with the timescale we propose for the trigger of star formation. Similarly, if the progenitor of GRB 980425 was a runaway star expelled from the WR region (Hammer et al. 2006; van den Heuvel & Portegies Zwart 2013), then it would need only ~3–6 Myr to reach its explosion site assuming a reasonable kick velocity of ~130–260 km s-1. Similar ages of stellar progenitors were derived for other GRBs (Thöne et al. 2008; Östlin et al. 2008).
On the other hand, the free-fall time is  (1)where G is the gravitational constant, ρ is gas density, and n is the number density for which we assumed ρ = nmp, where mp is the proton mass (i.e. assuming atomic gas only). For our measured density of n ~ 1000 cm-3 (Fig. 5 and Table 1) the free-fall time is a few Myr. Star formation starts after one to a few tff, so if, as proposed above, the inflow happened a few tens of Myr ago, then this is long enough for star formation to start.
We investigate the relation between SFRs of other GRB hosts derived from line and continuum emission in Fig. 8, in which we compiled the Hα, [O ii]λ3727, UV, IR and radio estimates (Bloom et al. 1998, 2001; Djorgovski et al. 2001, 2003; Price et al. 2002; Garnavich et al. 2003; Christensen et al. 2004; Prochaska et al. 2004; Gorosabel et al. 2005; Sollerman et al. 2005, 2006; Castro Cerón et al. 2006, 2010; Della Valle et al. 2006; Thöne et al. 2008; Michałowski et al. 2009, 2012b, 2014b, 2015; Savaglio et al. 2009; Levesque et al. 2010b,a; Stanway et al. 2010; Watson et al. 2011; Hjorth et al. 2012; Jakobsson et al. 2012; Perley & Perley 2013; Perley et al. 2015; Hunt et al. 2014a; Schady et al. 2014). If needed, we converted them to the Chabrier (2003) IMF by dividing the estimates based on the Salpeter (1955) IMF by 1.8. We note that the [O ii]λ3727 estimator is strongly metallicity-dependent (Kewley et al. 2004), but in our sample these estimates are consistent with those from Hα (mean ratio of 1.1 ± 0.32).
In principle it would also be advantageous to investigate sSFRs of GRB hosts. This would not change line-to-continuum ratios, but, if carried out properly, it could decrease the scatter in Fig. 8. This is because stellar mass estimates depend on many assumptions such as star formation histories, initial mass function, and stellar models (Michałowski et al. 2012a, 2014a; Pacifici et al. 2012; Mitchell et al. 2013; Simha et al. 2014), which may not be universal in the sample of GRB hosts. However, the inhomogeneity of optical and near-infrared data for this sample renders this investigation beyond the scope of this paper.
In 20 out of 32 cases the line SFR is higher than the continuum SFR. The mean ratio of the SFR derived from line indicators to that from the continuum indicator is 1.74 ± 0.32. This is consistent with a very recent enhancement of star formation (reflected in stronger line emission, but not influencing the continuum yet) being common among GRB hosts. Hence, galaxies that have recently experienced inflow of gas may preferentially host stars exploding as GRBs. This may be due to the GRB metallicity bias favouring metal-poor environments (Yoon & Langer 2005; Yoon et al. 2006; Woosley & Heger 2006; Piranomonte et al. 2015; Schulze et al. 2015; Trenti et al. 2015; Vergani et al. 2015; Japelj et al. 2016; Perley et al. 2016). Hence the accretion of the metal-poor gas from the intergalactic medium is likely required to produce regions with low enough metallicity. Therefore GRBs may be used to select unique samples of galaxies suitable for the investigation of recent gas accretion.
The line and continuum indicators were calibrated so that they are consistent with each other on average for star-forming galaxies (see e.g. Wijesinghe et al. 2011; Davies et al. 2016; Wang et al. 2016), and therefore the higher line-based SFRs of GRB hosts are not due to systematic effects. Our interpretation of strong line emission is consistent with the investigation of other galaxies. The influence of the star formation history on the measured SFRs with various indicators was investigated by Guo et al. (2016), who interpreted low far-UV-to-Hα SFR ratio of star-forming galaxies as a sign of recent starburst because this ratio anti-correlates with specific SFR measured with Hα (their Fig. 6, see also Sullivan et al. 2000; Iglesias-Páramo et al. 2004; Boselli et al. 2009; Lee et al. 2009; Meurer et al. 2009; Fumagalli et al. 2011; Weisz et al. 2012; da Silva et al. 2014).
Michałowski et al. (2015) proposed that star formation may proceed directly in the accreted atomic gas before the conversion to molecular gas. This is possible because the cooling timescale is much shorter than the H i-to-H2 conversion timescale, so just after the atomic gas is accreted it can start forming stars before it converts to the molecular phase (Glover & Clark 2012; Krumholz 2012; Hu et al. 2016). As a result, molecular gas mass of GRB hosts is lower than what would be expected from their SFRs, which is partially fuelled by atomic gas.
5.2. Alternative explanations
Here we provide arguments that show why alternative explanations for our data are less likely.
High SFR/CO, [C ii]/CO, and H i/CO ratios are usually found at low metallicities (1/6–1/5 solar or below; Poglitsch et al. 1995; Israel et al. 1996; Madden et al. 1997; Madden 2000; Rubin et al. 2009; Cormier et al. 2010; Hunt et al. 2014b, 2015; Amorín et al. 2016), so the GRB 980425 host in principle might be a normal metal-poor dwarf. However, the average metallicity of the host is 12 + log (O/H) ~ 8.6 or ~0.8 solar (Sollerman et al. 2005), so it is difficult to advocate that its properties are due to metallicity effects. Indeed, as shown in the previous section, the GRB 980425 host has a low molecular gas mass even taking its metallicity into account. Moreover, the [C ii]/FIR and [O i]/FIR ratios of the GRB 980425 host are higher than those of other local dwarf galaxies with similar FIR luminosity (Fig. 4).
Another possibility is that the GRB 980425 host is at the end of a star formation episode, which would imply molecular gas dissipation (hence weak CO emission) by massive stars (Hatsukade et al. 2014; Stanway et al. 2015b). However, in that case the WR region, which is forming stars most intensely, would be the most metal rich and dust free because dust would be destroyed together with molecular gas. On the contrary, the WR region is metal poor (Christensen et al. 2008) and dusty (Michałowski et al. 2014b). Moreover, if star formation activity was decreasing, then the [C ii], [O i], and Hα emission would decrease almost instantaneously, whereas infrared emission would need a longer time to react. This would result in a lower (or at most equal) SFRline than SFRIR, contrary to observations (Fig. 6). The dust heating from older low-mass stars would make this effect even stronger.
In order to explain the H i concentration close to the WR region and the disturbed H i velocity field in the GRB 980425 host, Arabsalmani et al. (2015) invoked a minor merger scenario. This is actually not much different than our atomic gas inflow scenario because an H i-dominated dwarf galaxy merging with the host is conceptually close to what we call an infalling H i cloud. However, we do not see the enhancement of [C ii] close to the position of the WR region (similar to the H i concentration), so the smaller galaxy needs to be relatively unevolved in the merger scenario, such that it does not bring significant amount of carbon.
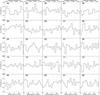 |
Fig. 9 ALMA CO(1–0) spectra of all spaxels. The integrated fluxes were measured within inner dotted lines. They are different for different spaxels because for each one we conservatively selected a 40 km s-1 region that gives the highest flux upper limit. |
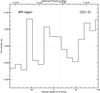 |
Fig. 10 ALMA CO(1–0) spectrum of the WR region within an 1.7′′ aperture. The flux was measured within inner dotted lines. |
6. Conclusions
Using [C ii], [O i] and CO spectroscopy we found that the GRB 980425 host has elevated [C ii]/FIR and [O i]/FIR ratios and higher values of SFRs derived from line ([C ii], [O i], Hα) than from continuum (UV, IR, radio) indicators. [C ii] emission exhibits a normal morphology, peaking at the galaxy centre, whereas [O i] is concentrated close to the GRB position and the nearby Wolf-Rayet region. The high [O i] flux indicates that there is high radiation field and high gas density at these positions, as derived from modelling of photo-dissociation regions. The [C ii]/CO luminosity ratio of the GRB 980425 host is close to the highest values found for local star-forming galaxies. Indeed, its CO-derived molecular gas mass is low given its SFR and metallicity, but the [C ii]-derived molecular gas mass is close to the expected value.
The [O i] and H i concentrations and the high radiation field and density close to the GRB position are consistent with the hypothesis of a very recent (at most a few tens of Myr ago) inflow of atomic gas triggering star formation. In this scenario dust has not had time to build up, which explains high line-to-continuum ratios. Such a recent enhancement of star formation activity would indeed manifest itself in high SFRline/SFRcontinuum ratios because the line indicators are sensitive only to recent (<10 Myr) activity, whereas the continuum indicators measure the SFR averaged over much longer periods (~100 Myr). We found similarly high SFR ratios for other GRB hosts. This is consistent with a very recent enhancement of star formation that is common among GRB hosts, so galaxies that have recently experienced inflow of gas may preferentially host stars exploding as GRBs. Therefore GRBs may be used to select a unique sample of galaxies that is suitable for the investigation of recent gas accretion.
OBSIDs: 1342270641.
Acknowledgments
We thank Joanna Baradziej for help with improving this paper; Per Bergman, Carlos De Breuck, and Katharina Immer for help with the APEX observations; Tom Muxlow, and Eelco van Kampen with the ALMA observations; and our referee for useful comments.
M.J.M. acknowledges the support of the UK Science and Technology Facilities Council. The Dark Cosmology Centre is funded by the Danish National Research Foundation. J.L.W. is supported by a European Union COFUND/Durham Junior Research Fellowship under EU grant agreement number 267209, and acknowledges additional support from STFC (ST/L00075X/1). A.K. acknowledges support from the Foundation for Polish Science (FNP) and the Polish National Science Center grant 2013/11/N/ST9/00400. A.J.C.T. acknowledges support from the Spanish Ministry Project AYA2015-71718-R. D.X. acknowledges the support by the One-Hundred-Talent Program of the Chinese Academy of Sciences, and by the Strategic Priority Research Program “Multi-wavelength Gravitational Wave Universe” of the Chinese Academy of Sciences (No. XDB23000000).
PACS has been developed by a consortium of institutes led by MPE (Germany) and including UVIE (Austria); KU Leuven, CSL, IMEC (Belgium); CEA, LAM (France); MPIA (Germany); INAF-IFSI/OAA/OAP/OAT, LENS, SISSA (Italy); IAC (Spain). This development has been supported by the funding agencies BMVIT (Austria), ESA-PRODEX (Belgium), CEA/CNES (France), DLR (Germany), ASI/INAF (Italy), and CICYT/MCYT (Spain). This publication is based on data acquired with the Atacama Pathfinder Experiment (APEX). APEX is a collaboration between the Max-Planck-Institut fur Radioastronomie, the European Southern Observatory, and the Onsala Space Observatory. Based on observations collected at the European Organisation for Astronomical Research in the Southern Hemisphere under ESO programmes 096.D-0280 and 096.F-9302. This paper makes use of the following ALMA data: ADS/JAO.ALMA#2011.0.00046.S. ALMA is a partnership of ESO (representing its member states), NSF (USA) and NINS (Japan), together with NRC (Canada) and NSC and ASIAA (Taiwan), in cooperation with the Republic of Chile. The Joint ALMA Observatory is operated by ESO, AUI/NRAO and NAOJ. This research has made use of the GHostS database (http://www.grbhosts.org), which is partly funded by Spitzer/NASA grant RSA Agreement No. 1287913; the NASA/IPAC Extragalactic Database (NED), which is operated by the Jet Propulsion Laboratory, California Institute of Technology, under contract with the National Aeronautics and Space Administration; SAOImage DS9, developed by Smithsonian Astrophysical Observatory (Joye & Mandel 2003); and the NASA’s Astrophysics Data System Bibliographic Services.
References
- Amorín, R., Muñoz-Tuñón, C., Aguerri, J. A. L., & Planesas, P. 2016, A&A, 588, A23 [NASA ADS] [CrossRef] [EDP Sciences] [Google Scholar]
- Arabsalmani, M., Roychowdhury, S., Zwaan, M. A., Kanekar, N., & Michałowski, M. J. 2015, MNRAS, 454, L51 [NASA ADS] [CrossRef] [Google Scholar]
- Asplund, M., Grevesse, N., Sauval, A. J., Allende Prieto, C., & Kiselman, D., 2004, A&A, 417, 751 [NASA ADS] [CrossRef] [EDP Sciences] [Google Scholar]
- Bigiel, F., Leroy, A., Walter, F., et al. 2008, AJ, 136, 2846 [NASA ADS] [CrossRef] [Google Scholar]
- Bigiel, F., Leroy, A., Walter, F., et al. 2010, AJ, 140, 1194 [NASA ADS] [CrossRef] [Google Scholar]
- Bloom, J. S., Djorgovski, S. G., Kulkarni, S. R., & Frail, D. A. 1998, ApJ, 507, L25 [NASA ADS] [CrossRef] [Google Scholar]
- Bloom, J. S., Djorgovski, S. G., & Kulkarni, S. R. 2001, ApJ, 554, 678 [NASA ADS] [CrossRef] [Google Scholar]
- Boissier, S., Salvaterra, R., Le Floc’h, E., et al. 2013, A&A, 557, A34 [NASA ADS] [CrossRef] [EDP Sciences] [Google Scholar]
- Bolatto, A. D., Wolfire, M., & Leroy, A. K. 2013, ARA&A, 51, 207 [Google Scholar]
- Boselli, A., Boissier, S., Cortese, L., et al. 2009, ApJ, 706, 1527 [NASA ADS] [CrossRef] [Google Scholar]
- Carilli, C. L., & Walter, F. 2013, ARA&A, 51, 105 [NASA ADS] [CrossRef] [EDP Sciences] [Google Scholar]
- Castro Cerón, J. M., Michałowski, M. J., Hjorth, J., et al. 2006, ApJ, 653, L85 [NASA ADS] [CrossRef] [Google Scholar]
- Castro Cerón, J. M., Michałowski, M. J., Hjorth, J., et al. 2010, ApJ, 721, 1919 [NASA ADS] [CrossRef] [Google Scholar]
- Castro-Tirado, A. J., Bremer, M., McBreen, S., et al. 2007, A&A, 475, 101 [NASA ADS] [CrossRef] [EDP Sciences] [Google Scholar]
- Chabrier, G. 2003, ApJ, 586, L133 [NASA ADS] [CrossRef] [Google Scholar]
- Christensen, L., Hjorth, J., & Gorosabel, J. 2004, A&A, 425, 913 [NASA ADS] [CrossRef] [EDP Sciences] [Google Scholar]
- Christensen, L., Vreeswijk, P. M., Sollerman, J., et al. 2008, A&A, 490, 45 [NASA ADS] [CrossRef] [EDP Sciences] [Google Scholar]
- Cormier, D., Madden, S. C., Hony, S., et al. 2010, A&A, 518, L57 [NASA ADS] [CrossRef] [EDP Sciences] [Google Scholar]
- Cormier, D., Madden, S. C., Lebouteiller, V., et al. 2015, A&A, 578, A53 [NASA ADS] [CrossRef] [EDP Sciences] [Google Scholar]
- Crawford, M. K., Genzel, R., Townes, C. H., & Watson, D. M. 1985, ApJ, 291, 755 [NASA ADS] [CrossRef] [Google Scholar]
- da Silva, R. L., Fumagalli, M., & Krumholz, M. R. 2014, MNRAS, 444, 3275 [NASA ADS] [CrossRef] [Google Scholar]
- Daddi, E., Bournaud, F., Walter, F., et al. 2010, ApJ, 713, 686 [NASA ADS] [CrossRef] [Google Scholar]
- Davies, L. J. M., Driver, S. P., Robotham, A. S. G., et al. 2016, MNRAS, 461, 458 [NASA ADS] [CrossRef] [Google Scholar]
- De Looze, I., Cormier, D., Lebouteiller, V., et al. 2014, A&A, 568, A62 [NASA ADS] [CrossRef] [EDP Sciences] [Google Scholar]
- D’Elia, V., Fynbo, J. P. U., Covino, S., et al. 2010, A&A, 523, A36 [NASA ADS] [CrossRef] [EDP Sciences] [Google Scholar]
- D’Elia, V., Fynbo, J. P. U., Goldoni, P., et al. 2014, A&A, 564, A38 [NASA ADS] [CrossRef] [EDP Sciences] [Google Scholar]
- Della Valle, M., Chincarini, G., Panagia, N., et al. 2006, Nature, 444, 1050 [NASA ADS] [CrossRef] [PubMed] [Google Scholar]
- Detmers, R. G., Langer, N., Podsiadlowski, P., & Izzard, R. G. 2008, A&A, 484, 831 [NASA ADS] [CrossRef] [EDP Sciences] [Google Scholar]
- Djorgovski, S. G., Frail, D. A., Kulkarni, S. R., et al. 2001, ApJ, 562, 654 [NASA ADS] [CrossRef] [Google Scholar]
- Djorgovski, S. G., Bloom, J. S., & Kulkarni, S. R. 2003, ApJ, 591, L13 [NASA ADS] [CrossRef] [Google Scholar]
- Draine, B. T. 2009, ASP Conf. Ser., 414, 453 [Google Scholar]
- Elliott, J., Krühler, T., Greiner, J., et al. 2013, A&A, 556, A23 [NASA ADS] [CrossRef] [EDP Sciences] [Google Scholar]
- Elmegreen, B. G., Kaufman, M., Bournaud, F., et al. 2016, ApJ, 823, 26 [NASA ADS] [CrossRef] [Google Scholar]
- Filho, M. E., Sánchez Almeida, J., Amorín, R., et al. 2016, ApJ, 820, 109 [NASA ADS] [CrossRef] [Google Scholar]
- Friis, M., De Cia, A., Krühler, T., et al. 2015, MNRAS, 451, 4686 [Google Scholar]
- Fruchter, A. S., Levan, A. J., Strolger, L., et al. 2006, Nature, 441, 463 [NASA ADS] [CrossRef] [PubMed] [Google Scholar]
- Fumagalli, M., & Gavazzi, G. 2008, A&A, 490, 571 [NASA ADS] [CrossRef] [EDP Sciences] [Google Scholar]
- Fumagalli, M., da Silva, R. L., & Krumholz, M. R. 2011, ApJ, 741, L26 [NASA ADS] [CrossRef] [Google Scholar]
- Fynbo, J. P. U., Starling, R. L. C., Ledoux, C., et al. 2006, A&A, 451, L47 [NASA ADS] [CrossRef] [EDP Sciences] [Google Scholar]
- Galama, T. J., Vreeswijk, P. M., van Paradijs, J., et al. 1998, Nature, 395, 670 [NASA ADS] [CrossRef] [Google Scholar]
- Garnavich, P. M., Stanek, K. Z., Wyrzykowski, L., et al. 2003, ApJ, 582, 924 [NASA ADS] [CrossRef] [Google Scholar]
- Georgy, C., Ekström, S., Meynet, G., et al. 2012, A&A, 542, A29 [NASA ADS] [CrossRef] [EDP Sciences] [Google Scholar]
- Glover, S. C. O., & Clark, P. C. 2012, MNRAS, 421, 9 [NASA ADS] [Google Scholar]
- Gorosabel, J., Pérez-Ramírez, D., Sollerman, J., et al. 2005, A&A, 444, 711 [NASA ADS] [CrossRef] [EDP Sciences] [Google Scholar]
- Gullberg, B., De Breuck, C., Vieira, J. D., et al. 2015, MNRAS, 449, 2883 [NASA ADS] [CrossRef] [Google Scholar]
- Guo, Y., Rafelski, M., Faber, S. M., et al. 2016, ApJ, submitted [arXiv:1604.05314] [Google Scholar]
- Güsten, R., Nyman, L. Å., Schilke, P., et al. 2006, A&A, 454, L13 [NASA ADS] [CrossRef] [EDP Sciences] [Google Scholar]
- Habing, H. J. 1968, Bull. Astron. Inst. Netherlands, 19, 421 [Google Scholar]
- Hammer, F., Flores, H., Schaerer, D., et al. 2006, A&A, 454, 103 [NASA ADS] [CrossRef] [EDP Sciences] [Google Scholar]
- Han, X. H., Hammer, F., Liang, Y. C., et al. 2010, A&A, 514, A24 [NASA ADS] [CrossRef] [EDP Sciences] [Google Scholar]
- Hashimoto, T., Perley, D. A., Ohta, K., et al. 2015, ApJ, 806, 250 [NASA ADS] [CrossRef] [Google Scholar]
- Hatsukade, B., Kohno, K., Endo, A., et al. 2007, PASJ, 59, 67 [NASA ADS] [CrossRef] [Google Scholar]
- Hatsukade, B., Ohta, K., Endo, A., et al. 2014, Nature, 510, 247 [NASA ADS] [CrossRef] [Google Scholar]
- Herrera-Camus, R., Bolatto, A. D., Wolfire, M. G., et al. 2015, ApJ, 800, 1 [NASA ADS] [CrossRef] [Google Scholar]
- Hjorth, J., & Bloom, J. S. 2012, in Gamma Ray Burst (Cambridge University Press), 169 [Google Scholar]
- Hjorth, J., Sollerman, J., Møller, P., et al. 2003, Nature, 423, 847 [NASA ADS] [CrossRef] [PubMed] [Google Scholar]
- Hjorth, J., Malesani, D., Jakobsson, P., et al. 2012, ApJ, 756, 187 [NASA ADS] [CrossRef] [Google Scholar]
- Hu, C. Y., Naab, T., Walch, S., Glover, S. C. O., & Clark, P. C. 2016, MNRAS, 458, 3528 [NASA ADS] [CrossRef] [Google Scholar]
- Hughes, T. M., Ibar, E., Villanueva, V., et al. 2016, A&A, submitted [Google Scholar]
- Hunt, L. K., Palazzi, E., Michałowski, M. J., et al. 2014a, A&A, 565, A112 [NASA ADS] [CrossRef] [EDP Sciences] [Google Scholar]
- Hunt, L. K., Testi, L., Casasola, V., et al. 2014b, A&A, 561, A49 [NASA ADS] [CrossRef] [EDP Sciences] [Google Scholar]
- Hunt, L. K., García-Burillo, S., Casasola, V., et al. 2015, A&A, 583, A114 [NASA ADS] [CrossRef] [EDP Sciences] [Google Scholar]
- Iglesias-Páramo, J., Boselli, A., Gavazzi, G., & Zaccardo, A. 2004, A&A, 421, 887 [NASA ADS] [CrossRef] [EDP Sciences] [Google Scholar]
- Iglesias-Páramo, J., Buat, V., Hernández-Fernández, J., et al. 2007, ApJ, 670, 279 [NASA ADS] [CrossRef] [Google Scholar]
- Israel, F. P., Maloney, P. R., Geis, N., et al. 1996, ApJ, 465, 738 [NASA ADS] [CrossRef] [Google Scholar]
- Izzard, R. G., Ramirez-Ruiz, E., & Tout, C. A. 2004, MNRAS, 348, 1215 [NASA ADS] [CrossRef] [Google Scholar]
- Jakobsson, P., Hjorth, J., Malesani, D., et al. 2012, ApJ, 752, 62 [NASA ADS] [CrossRef] [Google Scholar]
- Japelj, J., Vergani, S. D., Salvaterra, R., et al. 2016, A&A, 590, A129 [NASA ADS] [CrossRef] [EDP Sciences] [Google Scholar]
- Joye, W. A., & Mandel, E. 2003, in Astronomical Data Analysis Software and Systems XII, eds. H. E. Payne, R. I. Jedrzejewski, & R. N. Hook, ASP Conf. Ser., 295, 489 [Google Scholar]
- Kaufman, M. J., Wolfire, M. G., & Hollenbach, D. J. 2006, ApJ, 644, 283 [NASA ADS] [CrossRef] [Google Scholar]
- Kennicutt, R. C. 1998, ARA&A, 36, 189 [Google Scholar]
- Kewley, L. J., & Dopita, M. A. 2002, ApJS, 142, 35 [NASA ADS] [CrossRef] [Google Scholar]
- Kewley, L. J., Geller, M. J., & Jansen, R. A. 2004, AJ, 127, 2002 [NASA ADS] [CrossRef] [Google Scholar]
- Krühler, T., Fynbo, J. P. U., Geier, S., et al. 2012, A&A, 546, A8 [NASA ADS] [CrossRef] [EDP Sciences] [Google Scholar]
- Krühler, T., Ledoux, C., Fynbo, J. P. U., et al. 2013, A&A, 557, A18 [NASA ADS] [CrossRef] [EDP Sciences] [Google Scholar]
- Krumholz, M. R. 2012, ApJ, 759, 9 [NASA ADS] [CrossRef] [Google Scholar]
- Le Floc’h, E., Charmandaris, V., Forrest, W. J., et al. 2006, ApJ, 642, 636 [NASA ADS] [CrossRef] [Google Scholar]
- Lee, J. C., Gil de Paz, A., Tremonti, C., et al. 2009, ApJ, 706, 599 [NASA ADS] [CrossRef] [Google Scholar]
- Levesque, E. M., Berger, E., Kewley, L. J., & Bagley, M. M. 2010a, AJ, 139, 694 [NASA ADS] [CrossRef] [Google Scholar]
- Levesque, E. M., Kewley, L. J., Graham, J. F., & Fruchter, A. S. 2010b, ApJ, 712, L26 [NASA ADS] [CrossRef] [Google Scholar]
- Madden, S. C. 2000, New Astron., 44, 249 [NASA ADS] [CrossRef] [Google Scholar]
- Madden, S. C., Poglitsch, A., Geis, N., Stacey, G. J., & Townes, C. H. 1997, ApJ, 483, 200 [NASA ADS] [CrossRef] [MathSciNet] [Google Scholar]
- Madden, S. C., Rémy-Ruyer, A., Galametz, M., et al. 2013, PASP, 125, 600 [NASA ADS] [CrossRef] [Google Scholar]
- Maiolino, R., Nagao, T., Grazian, A., et al. 2008, A&A, 488, 463 [NASA ADS] [CrossRef] [EDP Sciences] [Google Scholar]
- Malhotra, S., Kaufman, M. J., Hollenbach, D., et al. 2001, ApJ, 561, 766 [Google Scholar]
- Martin, D. C., Chang, D., Matuszewski, M., et al. 2014, ApJ, 786, 106 [NASA ADS] [CrossRef] [Google Scholar]
- McMullin, J. P., Waters, B., Schiebel, D., Young, W., & Golap, K. 2007, in Astronomical Data Analysis, eds. R. A. Shaw, F. Hill, & D. J. Bell, Software and Systems XVI, ASP Conf. Ser., 376, 127 [Google Scholar]
- Meurer, G. R., Wong, O. I., Kim, J. H., et al. 2009, ApJ, 695, 765 [NASA ADS] [CrossRef] [Google Scholar]
- Michałowski, M. J., Hjorth, J., Castro Cerón, J. M., & Watson, D. 2008, ApJ, 672, 817 [NASA ADS] [CrossRef] [Google Scholar]
- Michałowski, M. J., Hjorth, J., Malesani, D., et al. 2009, ApJ, 693, 347 [NASA ADS] [CrossRef] [Google Scholar]
- Michałowski, M. J., Hjorth, J., & Watson, D. 2010a, A&A, 514, A67 [NASA ADS] [CrossRef] [EDP Sciences] [Google Scholar]
- Michałowski, M. J., Watson, D., & Hjorth, J. 2010b, ApJ, 712, 942 [NASA ADS] [CrossRef] [Google Scholar]
- Michałowski, M. J., Dunlop, J. S., Cirasuolo, M., et al. 2012a, A&A, 541, A85 [NASA ADS] [CrossRef] [EDP Sciences] [Google Scholar]
- Michałowski, M. J., Kamble, A., Hjorth, J., et al. 2012b, ApJ, 755, 85 [NASA ADS] [CrossRef] [Google Scholar]
- Michałowski, M. J., Hayward, C. C., Dunlop, J. S., et al. 2014a, A&A, 571, A75 [NASA ADS] [CrossRef] [EDP Sciences] [Google Scholar]
- Michałowski, M. J., Hunt, L. K., Palazzi, E., et al. 2014b, A&A, 562, A70 [NASA ADS] [CrossRef] [EDP Sciences] [Google Scholar]
- Michałowski, M. J., Gentile, G., Hjorth, J., et al. 2015, A&A, 582, A78 [NASA ADS] [CrossRef] [EDP Sciences] [Google Scholar]
- Mitchell, P. D., Lacey, C. G., Baugh, C. M., & Cole, S. 2013, MNRAS, 435, 87 [NASA ADS] [CrossRef] [Google Scholar]
- Modjaz, M., Kewley, L., Kirshner, R. P., et al. 2008, AJ, 135, 1136 [NASA ADS] [CrossRef] [Google Scholar]
- Murphy, E. J., Condon, J. J., Schinnerer, E., et al. 2011, ApJ, 737, 67 [NASA ADS] [CrossRef] [Google Scholar]
- Neri, R., Downes, D., Cox, P., & Walter, F. 2014, A&A, 562, A35 [NASA ADS] [CrossRef] [EDP Sciences] [Google Scholar]
- Östlin, G., Zackrisson, E., Sollerman, J., Mattila, S., & Hayes, M. 2008, MNRAS, 387, 1227 [NASA ADS] [CrossRef] [Google Scholar]
- Ott, S. 2010, in Astronomical Data Analysis Software and Systems XIX, eds. Y. Mizumoto, K. I. Morita, M. Ohishi, ASP Conf. Ser., 434, 139 [Google Scholar]
- Pacifici, C., Charlot, S., Blaizot, J., & Brinchmann, J. 2012, MNRAS, 421, 2002 [NASA ADS] [CrossRef] [Google Scholar]
- Pagel, B. E. J., Edmunds, M. G., Blackwell, D. E., Chun, M. S., & Smith, G. 1979, MNRAS, 189, 95 [NASA ADS] [CrossRef] [Google Scholar]
- Perley, D. A., & Perley, R. A. 2013, ApJ, 778, 172 [NASA ADS] [CrossRef] [Google Scholar]
- Perley, D. A., Levan, A. J., Tanvir, N. R., et al. 2013, ApJ, 778, 128 [NASA ADS] [CrossRef] [Google Scholar]
- Perley, D. A., Perley, R. A., Hjorth, J., et al. 2015, ApJ, 801, 102 [NASA ADS] [CrossRef] [Google Scholar]
- Perley, D. A., Tanvir, N. R., Hjorth, J., et al. 2016, ApJ, 817, 8 [NASA ADS] [CrossRef] [Google Scholar]
- Petrovic, J., Langer, N., Yoon, S. C., & Heger, A. 2005, A&A, 435, 247 [NASA ADS] [CrossRef] [EDP Sciences] [Google Scholar]
- Pettini, M., & Pagel, B. E. J. 2004, MNRAS, 348, L59 [NASA ADS] [CrossRef] [Google Scholar]
- Pety, J. 2005, in SF2A-2005: Semaine de l’Astrophysique Francaise, eds. F. Casoli, T. Contini, J. M. Hameury, & L. Pagani, 721 [Google Scholar]
- Pilbratt, G. L., Riedinger, J. R., Passvogel, T., et al. 2010, A&A, 518, L1 [CrossRef] [EDP Sciences] [Google Scholar]
- Piranomonte, S., Japelj, J., Vergani, S. D., et al. 2015, MNRAS, 452, 3293 [CrossRef] [Google Scholar]
- Podsiadlowski, P., Mazzali, P. A., Nomoto, K., Lazzati, D., & Cappellaro, E. 2004, ApJ, 607, L17 [NASA ADS] [CrossRef] [Google Scholar]
- Podsiadlowski, P., Ivanova, N., Justham, S., & Rappaport, S. 2010, MNRAS, 406, 840 [NASA ADS] [Google Scholar]
- Poglitsch, A., Krabbe, A., Madden, S. C., et al. 1995, ApJ, 454, 293 [NASA ADS] [CrossRef] [Google Scholar]
- Poglitsch, A., Waelkens, C., Geis, N., et al. 2010, A&A, 518, L2 [NASA ADS] [CrossRef] [EDP Sciences] [Google Scholar]
- Pound, M. W., & Wolfire, M. G. 2008, in Astronomical Data Analysis Software and Systems XVII, eds. R. W. Argyle, P. S. Bunclark, J. R. Lewis, ASP Conf. Ser., 394, 654 [Google Scholar]
- Price, P. A., Kulkarni, S. R., Berger, E., et al. 2002, ApJ, 571, L121 [NASA ADS] [CrossRef] [Google Scholar]
- Prochaska, J. X., Bloom, J. S., Chen, H. W., et al. 2004, ApJ, 611, 200 [NASA ADS] [CrossRef] [Google Scholar]
- Prochaska, J. X., Sheffer, Y., Perley, D. A., et al. 2009, ApJ, 691, L27 [NASA ADS] [CrossRef] [Google Scholar]
- Rafelski, M., Gardner, J. P., Fumagalli, M., et al. 2016, ApJ, 825, 87 [NASA ADS] [CrossRef] [Google Scholar]
- Rauch, M., Becker, G. D., & Haehnelt, M. G. 2016, MNRAS, 455, 3991 [NASA ADS] [CrossRef] [Google Scholar]
- Ribaudo, J., Lehner, N., Howk, J. C., et al. 2011, ApJ, 743, 207 [NASA ADS] [CrossRef] [Google Scholar]
- Rigopoulou, D., Hopwood, R., Magdis, G. E., et al. 2014, ApJ, 781, L15 [NASA ADS] [CrossRef] [Google Scholar]
- Rubin, D., Hony, S., Madden, S. C., et al. 2009, A&A, 494, 647 [NASA ADS] [CrossRef] [EDP Sciences] [Google Scholar]
- Salpeter, E. E. 1955, ApJ, 121, 161 [Google Scholar]
- Sánchez Almeida, J., Muñoz-Tuñón, C., Elmegreen, D. M., Elmegreen, B. G., & Méndez-Abreu, J. 2013, ApJ, 767, 74 [NASA ADS] [CrossRef] [Google Scholar]
- Sánchez Almeida, J., Elmegreen, B. G., Muñoz-Tuñón, C., & Elmegreen, D. M. 2014a, A&ARv, 22, 71 [NASA ADS] [CrossRef] [Google Scholar]
- Sánchez Almeida, J., Morales-Luis, A. B., Muñoz-Tuñón, C., et al. 2014b, ApJ, 783, 45 [NASA ADS] [CrossRef] [Google Scholar]
- Sancisi, R., Fraternali, F., Oosterloo, T., & van der Hulst, T. 2008, A&ARv, 15, 189 [NASA ADS] [CrossRef] [EDP Sciences] [Google Scholar]
- Sargsyan, L., Lebouteiller, V., Weedman, D., et al. 2012, ApJ, 755, 171 [NASA ADS] [CrossRef] [Google Scholar]
- Savaglio, S., Glazebrook, K., & LeBorgne, D. 2009, ApJ, 691, 182 [NASA ADS] [CrossRef] [MathSciNet] [Google Scholar]
- Savaglio, S., Rau, A., Greiner, J., et al. 2012, MNRAS, 420, 627 [NASA ADS] [CrossRef] [Google Scholar]
- Schady, P., Savaglio, S., Müller, T., et al. 2014, A&A, 570, A52 [NASA ADS] [CrossRef] [EDP Sciences] [Google Scholar]
- Schady, P., Krühler, T., Greiner, J., et al. 2015, A&A, 579, A126 [NASA ADS] [CrossRef] [EDP Sciences] [Google Scholar]
- Schaye, J., Dalla Vecchia, C., Booth, C. M., et al. 2010, MNRAS, 402, 1536 [Google Scholar]
- Schulze, S., Malesani, D., Cucchiara, A., et al. 2014, A&A, 566, A102 [NASA ADS] [CrossRef] [EDP Sciences] [Google Scholar]
- Schulze, S., Chapman, R., Hjorth, J., et al. 2015, ApJ, 808, 73 [NASA ADS] [CrossRef] [Google Scholar]
- Silva, L., Granato, G. L., Bressan, A., & Danese, L. 1998, ApJ, 509, 103 [NASA ADS] [CrossRef] [Google Scholar]
- Simha, V., Weinberg, D. H., Conroy, C., et al. 2014, MNRAS, submitted [arXiv:1404.0402] [Google Scholar]
- Sollerman, J., Östlin, G., Fynbo, J. P. U., et al. 2005, New Astron., 11, 103 [NASA ADS] [CrossRef] [Google Scholar]
- Sollerman, J., Jaunsen, A. O., Fynbo, J. P. U., et al. 2006, A&A, 454, 503 [NASA ADS] [CrossRef] [EDP Sciences] [Google Scholar]
- Solomon, P. M., Downes, D., Radford, S. J. E., & Barrett, J. W. 1997, ApJ, 478, 144 [NASA ADS] [CrossRef] [Google Scholar]
- Stacey, G. J., Geis, N., Genzel, R., et al. 1991, ApJ, 373, 423 [NASA ADS] [CrossRef] [Google Scholar]
- Stacey, G. J., Hailey-Dunsheath, S., Ferkinhoff, C., et al. 2010, ApJ, 724, 957 [NASA ADS] [CrossRef] [Google Scholar]
- Stanek, K. Z., Matheson, T., Garnavich, P. M., et al. 2003, ApJ, 591, L17 [NASA ADS] [CrossRef] [Google Scholar]
- Stanway, E. R., Davies, L. J. M., & Levan, A. J. 2010, MNRAS, 409, L74 [NASA ADS] [CrossRef] [Google Scholar]
- Stanway, E. R., Levan, A. J., Tanvir, N., et al. 2015a, MNRAS, 446, 3911 [NASA ADS] [CrossRef] [Google Scholar]
- Stanway, E. R., Levan, A. J., Tanvir, N. R., Wiersema, K., & van der Laan, T. P. R. 2015b, ApJ, 798, L7 [NASA ADS] [CrossRef] [Google Scholar]
- Stott, J. P., Sobral, D., Bower, R., et al. 2013, MNRAS, 436, 1130 [NASA ADS] [CrossRef] [Google Scholar]
- Sullivan, M., Treyer, M. A., Ellis, R. S., et al. 2000, MNRAS, 312, 442 [NASA ADS] [CrossRef] [Google Scholar]
- Swinbank, A. M., Karim, A., Smail, I., et al. 2012, MNRAS, 427, 1066 [NASA ADS] [CrossRef] [Google Scholar]
- Thöne, C. C., Fynbo, J. P. U., Östlin, G., et al. 2008, ApJ, 676, 1151 [NASA ADS] [CrossRef] [Google Scholar]
- Tinney, C., Stathakis, R., Cannon, R., et al. 1998, IAU Circ., 6896 [Google Scholar]
- Trenti, M., Perna, R., & Jimenez, R. 2015, ApJ, 802, 103 [NASA ADS] [CrossRef] [Google Scholar]
- Tumlinson, J., Prochaska, J. X., Chen, H. W., Dessauges-Zavadsky, M., & Bloom, J. S. 2007, ApJ, 668, 667 [NASA ADS] [CrossRef] [Google Scholar]
- Turner, J. L., Beck, S. C., Benford, D. J., et al. 2015, Nature, 519, 331 [NASA ADS] [CrossRef] [Google Scholar]
- van den Heuvel, E. P. J., & Portegies Zwart, S. F. 2013, ApJ, 779, 114 [NASA ADS] [CrossRef] [EDP Sciences] [Google Scholar]
- Vassilev, V., Meledin, D., Lapkin, I., et al. 2008, A&A, 490, 1157 [NASA ADS] [CrossRef] [EDP Sciences] [Google Scholar]
- Vergani, S. D., Salvaterra, R., Japelj, J., et al. 2015, A&A, 581, A102 [NASA ADS] [CrossRef] [EDP Sciences] [Google Scholar]
- Vreeswijk, P. M., Ellison, S. L., Ledoux, C., et al. 2004, A&A, 419, 927 [NASA ADS] [CrossRef] [EDP Sciences] [Google Scholar]
- Wang, J., Serra, P., Józsa, G. I. G., et al. 2015, MNRAS, 453, 2399 [NASA ADS] [Google Scholar]
- Wang, L., Norberg, P., Gunawardhana, M. L. P., et al. 2016, MNRAS, 461, 1898 [NASA ADS] [CrossRef] [Google Scholar]
- Watson, D., French, J., Christensen, L., et al. 2011, ApJ, 741, 58 [NASA ADS] [CrossRef] [Google Scholar]
- Weisz, D. R., Johnson, B. D., Johnson, L. C., et al. 2012, ApJ, 744, 44 [NASA ADS] [CrossRef] [Google Scholar]
- Wijesinghe, D. B., da Cunha, E., Hopkins, A. M., et al. 2011, MNRAS, 415, 1002 [NASA ADS] [CrossRef] [Google Scholar]
- Wolfire, M. G., Hollenbach, D., & Tielens, A. G. G. M. 1989, ApJ, 344, 770 [NASA ADS] [CrossRef] [Google Scholar]
- Woosley, S. E., & Heger, A. 2006, ApJ, 637, 914 [NASA ADS] [CrossRef] [Google Scholar]
- Yoon, S. C., & Langer, N. 2005, A&A, 443, 643 [NASA ADS] [CrossRef] [EDP Sciences] [Google Scholar]
- Yoon, S. C., Langer, N., & Norman, C. 2006, A&A, 460, 199 [NASA ADS] [CrossRef] [EDP Sciences] [Google Scholar]
Appendix A: Additional table
Line and continuum fluxes and luminosities of each spaxel and the entire host.
All Tables
All Figures
|
Fig. 1 Image in the R-band of the GRB 980425 host (Sollerman et al. 2005) with the position and numbers of the PACS spaxels indicated. The panel is 60′′ × 60′′ (11kpc × 11kpc). The blue and red circles show the position of the GRB and WR region, respectively. Green circle shows the APEX beam for the CO(2–1) observations. |
| In the text | |
|
Fig. 2 Top: [C ii] (left) and [O i] (right) spectra of each spaxel. The integrated fluxes were measured within inner dotted lines, with the errors within the outer lines excluding the inner region. Middle: [C ii] (left) and [O i] (right) spatial distribution of integrated flux in each spaxel. Bottom: distribution of derived density and radiation field strength. In order to improve the readability of the plots we adopted the following convention. The line-filled boxes correspond to upper limits on the corresponding property if the flux measurement has <3σ significance, but if the measured value is below the lowest value on the colour bar, then the box is white. If the property cannot be measured (n and G0 for spaxels with no detections at [C ii] and [O i]), then the box is also white with no values indicated. The [C ii] emission exhibits a normal radial profile, whereas [O i] emission is concentrated close to the WR region. |
| In the text | |
|
Fig. 3 [C ii] (top left), [O i] (top right), CO(2–1) (bottom left), and CO(1–0) (bottom right) spectra of the entire host. The integrated fluxes were measured within inner dotted lines, with the errors within the outer lines excluding the inner region. |
| In the text | |
|
Fig. 4 [C ii]-to-continuum (top), [O i]-to-continuum (middle), and [O i]-to-[C ii] (bottom) luminosity ratios as a function of FIR luminosity (40–120 μm). Red circles denote PACS spaxels, blue square denotes the entire host, whereas plus signs, crosses and green diamonds represent normal local galaxies (Malhotra et al. 2001), dwarf galaxies (Cormier et al. 2015), and the Large Magellanic Cloud; the point at a lower luminosity is 30 Doradus and that at the higher luminosity is the entire galaxy (Poglitsch et al. 1995; Israel et al. 1996). The GRB 980425 host has elevated [C ii]/FIR and [O i]/FIR ratios for its FIR luminosity. |
| In the text | |
|
Fig. 5 Gas density vs. interstellar radiation field obtained from the PDR modelling. Red circles denote PACS spaxels, blue square denotes the entire host, whereas plus signs represent normal local galaxies (Malhotra et al. 2001). The WR region (spaxel 11) exhibits a high inferred radiation field and density. |
| In the text | |
|
Fig. 6 SFRs derived from IR luminosity (8–1000 μm; with the calibration of Kennicutt 1998) vs. those derived from [C ii] (blue), [O i] (red; with the calibration of De Looze et al. 2014), and Hα (green, higher values include dust correction as derived by Christensen et al. 2008) lines. Circles denote PACS spaxels, and squares denote the entire host. The IR estimates are from Michałowski et al. (2014b). The Hα estimate for the WR region is from Christensen et al. (2008), and for the entire host from Sollerman et al. (2005). Dotted lines show the locations at which the SFRline is higher than the SFRIR by the indicated factors. The SFRs derived from line ([C ii], [O i], Hα) indicators are higher than those from continuum (UV, IR, radio) indicators. |
| In the text | |
|
Fig. 7 [C ii] luminosity as a function CO(1–0) luminosity of individual spaxels (red arrows), the entire GRB 980425 host (blue square), local galaxies (plus signs, diamonds, and crosses; Stacey et al. 1991; Crawford et al. 1985) and the LMC (green diamond; Israel et al. 1996). The GRB 980425 host has an elevated [C ii]/CO ratio compared with local galaxies. |
| In the text | |
|
Fig. 8 Compilation of SFRs measured from emission lines (red; circles: [C ii], squares: [O i], diamonds: [O ii], asterisks: Hα) and continuum indicators (blue; asterisks: ultraviolet, circles: infrared, squares: radio). The x-axis position corresponds to different GRB hosts. The red and blue lines show the average line- and continuum-based SFR for a given GRB host, respectively. The line-based indicators give on average systematically higher estimates. |
| In the text | |
|
Fig. 9 ALMA CO(1–0) spectra of all spaxels. The integrated fluxes were measured within inner dotted lines. They are different for different spaxels because for each one we conservatively selected a 40 km s-1 region that gives the highest flux upper limit. |
| In the text | |
|
Fig. 10 ALMA CO(1–0) spectrum of the WR region within an 1.7′′ aperture. The flux was measured within inner dotted lines. |
| In the text | |
Current usage metrics show cumulative count of Article Views (full-text article views including HTML views, PDF and ePub downloads, according to the available data) and Abstracts Views on Vision4Press platform.
Data correspond to usage on the plateform after 2015. The current usage metrics is available 48-96 hours after online publication and is updated daily on week days.
Initial download of the metrics may take a while.