Free Access
Fig. 1
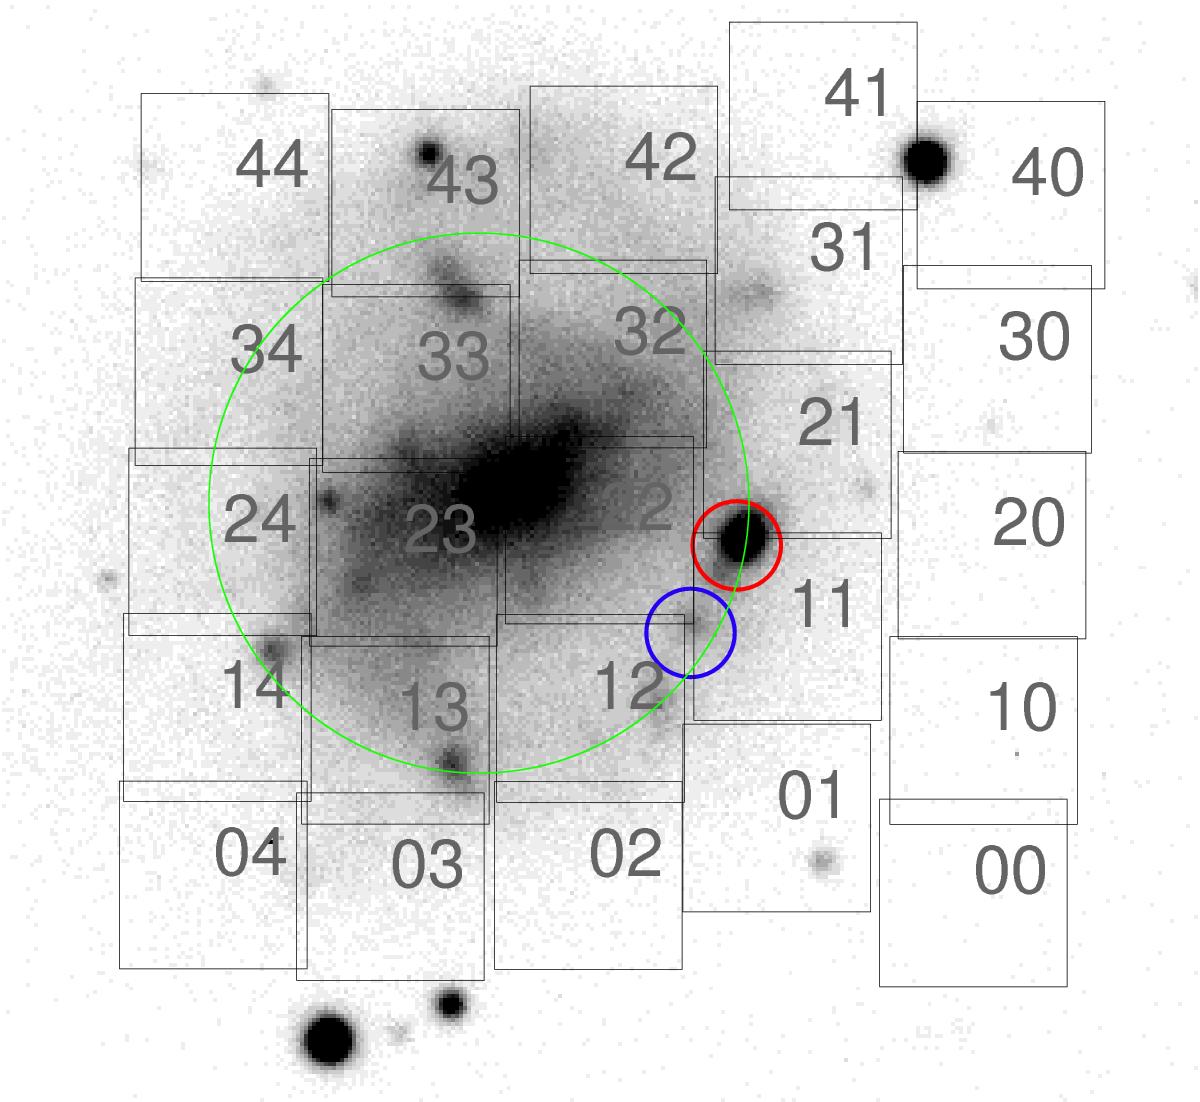
Image in the R-band of the GRB 980425 host (Sollerman et al. 2005) with the position and numbers of the PACS spaxels indicated. The panel is 60′′ × 60′′ (11kpc × 11kpc). The blue and red circles show the position of the GRB and WR region, respectively. Green circle shows the APEX beam for the CO(2–1) observations.
Current usage metrics show cumulative count of Article Views (full-text article views including HTML views, PDF and ePub downloads, according to the available data) and Abstracts Views on Vision4Press platform.
Data correspond to usage on the plateform after 2015. The current usage metrics is available 48-96 hours after online publication and is updated daily on week days.
Initial download of the metrics may take a while.