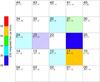
Fig. 2
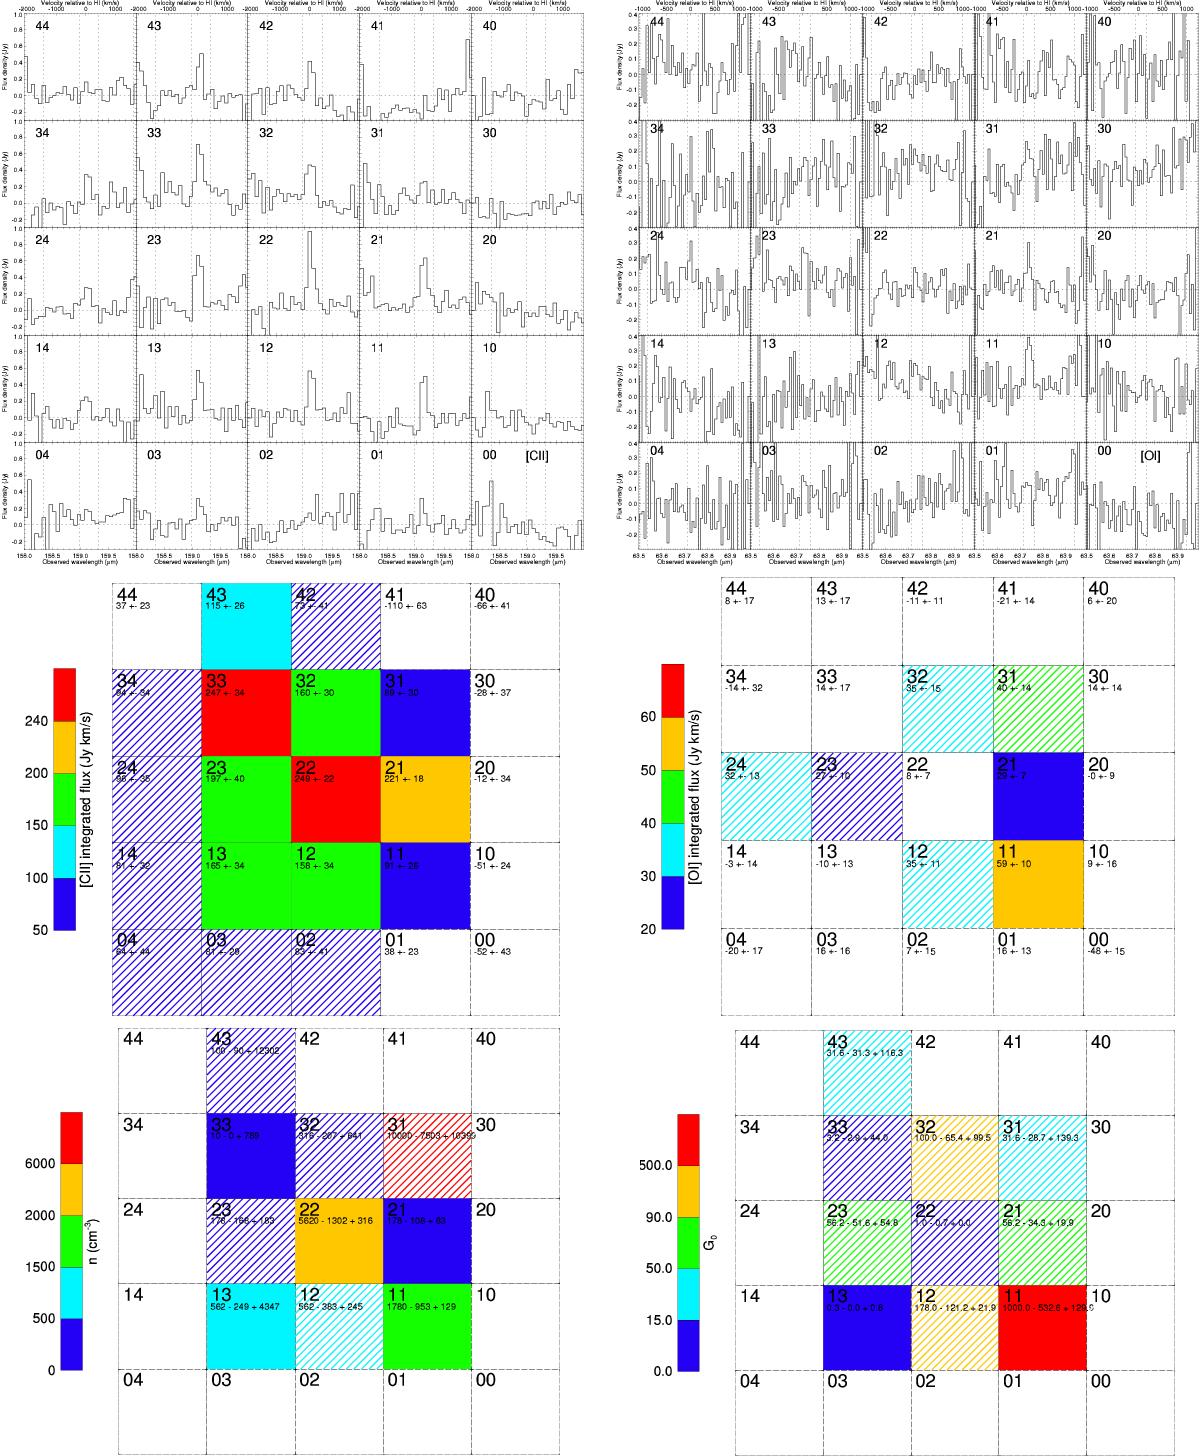
Top: [C ii] (left) and [O i] (right) spectra of each spaxel. The integrated fluxes were measured within inner dotted lines, with the errors within the outer lines excluding the inner region. Middle: [C ii] (left) and [O i] (right) spatial distribution of integrated flux in each spaxel. Bottom: distribution of derived density and radiation field strength. In order to improve the readability of the plots we adopted the following convention. The line-filled boxes correspond to upper limits on the corresponding property if the flux measurement has <3σ significance, but if the measured value is below the lowest value on the colour bar, then the box is white. If the property cannot be measured (n and G0 for spaxels with no detections at [C ii] and [O i]), then the box is also white with no values indicated. The [C ii] emission exhibits a normal radial profile, whereas [O i] emission is concentrated close to the WR region.
Current usage metrics show cumulative count of Article Views (full-text article views including HTML views, PDF and ePub downloads, according to the available data) and Abstracts Views on Vision4Press platform.
Data correspond to usage on the plateform after 2015. The current usage metrics is available 48-96 hours after online publication and is updated daily on week days.
Initial download of the metrics may take a while.