Fig. 6
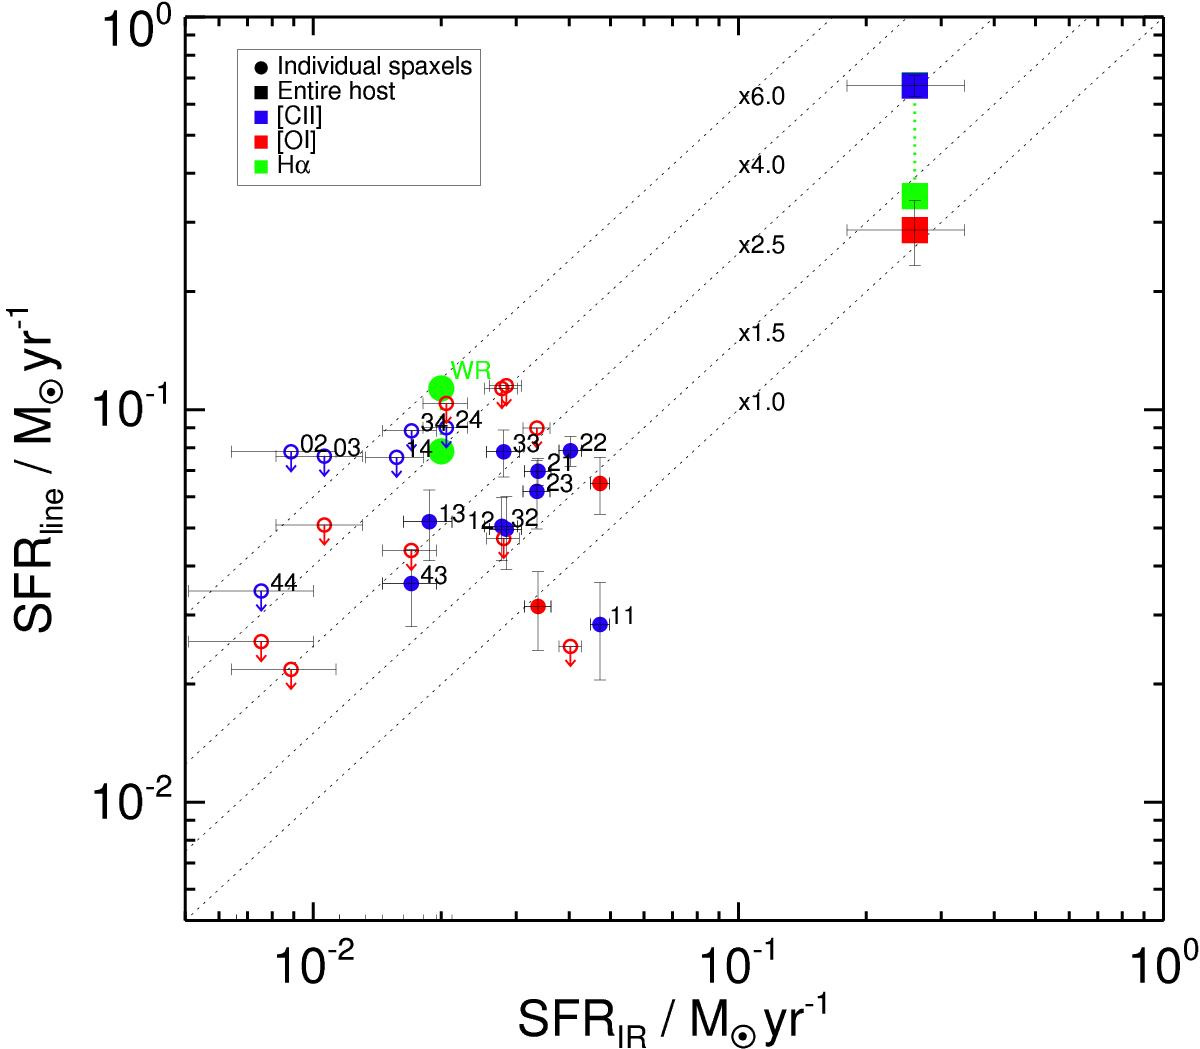
SFRs derived from IR luminosity (8–1000 μm; with the calibration of Kennicutt 1998) vs. those derived from [C ii] (blue), [O i] (red; with the calibration of De Looze et al. 2014), and Hα (green, higher values include dust correction as derived by Christensen et al. 2008) lines. Circles denote PACS spaxels, and squares denote the entire host. The IR estimates are from Michałowski et al. (2014b). The Hα estimate for the WR region is from Christensen et al. (2008), and for the entire host from Sollerman et al. (2005). Dotted lines show the locations at which the SFRline is higher than the SFRIR by the indicated factors. The SFRs derived from line ([C ii], [O i], Hα) indicators are higher than those from continuum (UV, IR, radio) indicators.
Current usage metrics show cumulative count of Article Views (full-text article views including HTML views, PDF and ePub downloads, according to the available data) and Abstracts Views on Vision4Press platform.
Data correspond to usage on the plateform after 2015. The current usage metrics is available 48-96 hours after online publication and is updated daily on week days.
Initial download of the metrics may take a while.