Free Access
Fig. 9
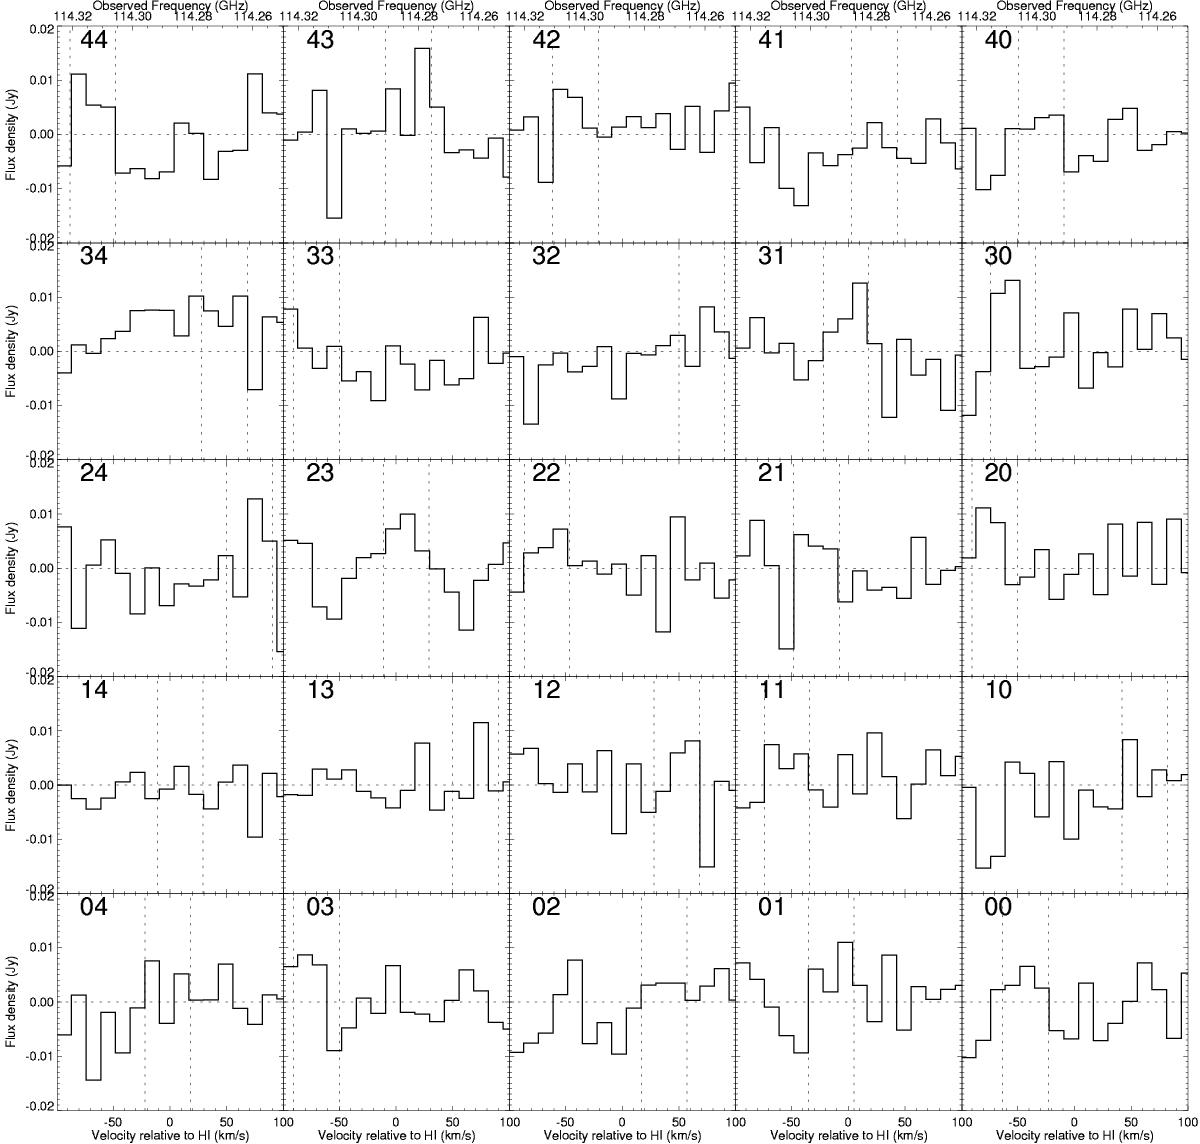
ALMA CO(1–0) spectra of all spaxels. The integrated fluxes were measured within inner dotted lines. They are different for different spaxels because for each one we conservatively selected a 40 km s-1 region that gives the highest flux upper limit.
Current usage metrics show cumulative count of Article Views (full-text article views including HTML views, PDF and ePub downloads, according to the available data) and Abstracts Views on Vision4Press platform.
Data correspond to usage on the plateform after 2015. The current usage metrics is available 48-96 hours after online publication and is updated daily on week days.
Initial download of the metrics may take a while.