| Issue |
A&A
Volume 594, October 2016
|
|
|---|---|---|
| Article Number | A32 | |
| Number of page(s) | 17 | |
| Section | Catalogs and data | |
| DOI | https://doi.org/10.1051/0004-6361/201628105 | |
| Published online | 06 October 2016 | |
The 3XMM/SDSS Stripe 82 Galaxy Cluster Survey
I. Cluster catalogue and discovery of two merging cluster candidates⋆
1 Sorbonne Universités, UPMC Univ. Paris 6 et CNRS, UMR 7095, Institut d’Astrophysique de Paris (IAP), 98bis Bd Arago, 75014 Paris, France
e-mail: This email address is being protected from spambots. You need JavaScript enabled to view it.
2 National Research Institute of Astronomy and Geophysics (NRIAG), 11421 Helwan, Cairo, Egypt
Received: 11 January 2016
Accepted: 17 June 2016
Abstract
We present a galaxy cluster survey based on XMM-Newton observations that are located in Stripe 82 of the Sloan Digital Sky Survey (SDSS). The survey covers an area of 11.25 deg2. The X-ray cluster candidates were selected as serendipitously extended detected sources from the third XMM-Newton serendipitous source catalogue (3XMM-DR5). A cross-correlation of the candidate list that comprises 94 objects with recently published X-ray and optically selected cluster catalogues provided optical confirmations and redshift estimates for about half of the candidate sample. We present a catalogue of X-ray cluster candidates previously known in X-ray and/or optical bands from the matched catalogues or NED. The catalogue consists of 54 systems with redshift measurements in the range of 0.05–1.19 with a median of 0.36. Of these, 45 clusters have spectroscopic confirmations as stated in the matched catalogues. We spectroscopically confirmed another 6 clusters from the available spectroscopic redshifts in the SDSS-DR12. The cluster catalogue includes 17 newly X-ray discovered clusters, while the remainder were detected in previous XMM-Newton and/or ROSAT cluster surveys. Based on the available redshifts and fluxes given in the 3XMM-DR5 catalogue, we estimated the X-ray luminosities and masses for the cluster sample. We also present the list of the remaining X-ray cluster candidates (40 objects) that have no redshift information yet in the literature. Of these candidates, 25 sources are considered as distant cluster candidates beyond a redshift of 0.6. We also searched for galaxy cluster mergers in our cluster sample and found two strong candidates for newly discovered cluster mergers at redshifts of 0.11 and 0.26. The X-ray and optical properties of these systems are presented.
Key words: X-rays: galaxies: clusters / galaxies: clusters: general / surveys / catalogs
Tables A.1, C.1, and C.2 are also available at the CDS via anonymous ftp to cdsarc.u-strasbg.fr (130.79.128.5) or via http://cdsarc.u-strasbg.fr/viz-bin/qcat?J/A+A/594/A32
© ESO, 2016
1. Introduction
As galaxy clusters are the most massive gravitationally bound objects in the Universe, their physical properties are interesting to analyse per se(e.g. Sarazin 1988; Bahcall 1988; Böhringer 2006; Rosati et al. 2002; Ota 2012; Ettori et al. 2013). But they are also of interest for cosmology, since counting clusters adds a constraint on cosmological parameters (e.g. Gioia et al. 1990; Voit 2005; Vikhlinin et al. 2009; Allen et al. 2011). This has led to developing systematic searches for clusters at mm, optical, and X-ray wavelengths because of the multi-component nature of their observed matter. As of very recently, galaxy clusters can be detected by their Sunyaev-Zeldovich (SZ) signal at mm wavelengths, which provided a sample of several hundred massive clusters (e.g. Hasselfield et al. 2013; Bleem et al. 2015; Planck Collaboration XXVII 2016).
Tens of thousands of galaxy clusters have been identified based on large photometric and/or spectroscopic surveys. In the Sloan Digital Sky Survey (SDSS) Stripe 82 region, a zone covering a surface of 270 deg2 across the celestial equator in the Southern Galactic Cap (−50° <α< 60°, | δ | ≤ 1.25°), several teams have found thousands of candidate clusters by applying various methods. For example, Geach et al. (2011) detected 4098 clusters up to redshift z ~ 0.6 by applying an algorithm that searches for statistically significant overdensities in a Voronoi tesselation of the projected sky. Durret et al. (2015) applied the AMACFI cluster finder (based on photometric redshifts) in the same region and detected 3663 candidate clusters. In addition, galaxy cluster catalogues are constructed from the whole available SDSS survey area (e.g. Koester et al. 2007; Wen et al. 2009; Hao et al. 2010; Szabo et al. 2011; Rykoff et al. 2014; Wen & Han 2015).
The advantages of X-ray cluster surveys are first, that they provide almost pure and complete cluster catalogues, and second, that the X-ray observables (temperature and luminosity) correlate tightly with cluster masses (e.g. Allen et al. 2011; Böhringer & Schartel 2013). Several hundreds of clusters were discovered in X-rays based on previous X-ray missions mainly from ROSAT data (e.g. Ebeling et al. 1998, 2010; Rosati et al. 1998; Reiprich & Böhringer 2002; Böhringer et al. 2004; Burenin et al. 2007).
The current X-ray missions (Chandra, XMM-Newton, Swift/X-ray) provide contiguous cluster surveys for small areas (e.g. Finoguenov et al. 2007, 2010; Šuhada et al. 2012; Clerc et al. 2014; Pierre et al. 2016), in addition to serendipitous cluster surveys in the archival observations that provide a relatively large area of a few hundred square degrees (e.g. Barkhouse et al. 2006; Kolokotronis et al. 2006; Lamer et al. 2008; Fassbender et al. 2011; Takey et al. 2011, 2013; Mehrtens et al. 2012; Clerc et al. 2012; Tundo et al. 2012; de Hoon et al. 2013; Takey et al. 2014). So far, these surveys have provided a substantial sample of several hundred clusters up to a redshift of 1.9 (photometric). An X-ray all-sky cluster survey will only be made possible by the launch of eRosita, which will provide several hundred thousand clusters (Pillepich et al. 2012).
In the present paper, we present the 3XMM/SDSS Stripe 82 galaxy cluster survey, a search for serendipitous galaxy clusters in the XMM-Newton archive that are located in the footprint of Stripe 82 (S82 hereafter). The survey is based on extended detections in the third XMM-Newton serendipitous source catalogue (3XMM-DR5, Rosen et al. 2016). Since XMM-Newton has the largest geometric effective area of any other X-ray satellite and a large field of view of 30 arcmin, it provided a rich resource for serendipitous cluster detection up to high redshifts. In addition, the SDSS deep photometric data of S82 allowed estimating the photometric redshifts of galaxies up to redshift unity (Reis et al. 2012).
The main goal of our survey is to construct a cluster sample that can be used for detailed multi-wavelength studies. The constructed sample will include systems with a wide range of mass and redshift. This type of group and cluster sample is needed to achieve our aim of investigating the X-ray scaling relation (luminosity-temperature relation) as well as optical properties (galaxy luminosity function and morphological analysis of cluster galaxies). Another product of the present project is to develop a new method for identifying the optical counterparts around the cluster centres determined from X-rays or from the SZ-effect and for constraining their redshifts. This method will be based on a machine-learning technique (Mahmoud et al. 2016).
We present here our strategy of selecting the X-ray cluster candidates in our survey. As a first result, we provide a sample of optically confirmed clusters, with their physical properties (redshift, luminosity, and mass) and a list of the remaining X-ray cluster candidates that can be used for further explorations or follow-up programs. We also use the spectroscopic redshifts of galaxies available from the SDSS-DR12 to spectroscopically confirm the constructed cluster sample.
As a second result, we report the discovery of two pairs of galaxy clusters that are strong candidates for merging clusters. Their properties derived from the available X-ray data are presented, together with galaxy density maps. This is done to show the distribution of cluster galaxies and to determine the significance levels of structures detected in the cluster regions. The observation of binary clusters caught just before, during, or just after a collision are of particular interest. We can use such systems as probes of the cluster-cluster interaction, study how these powerful (albeit with Gyr duration) events affect the intra-cluster gas physics in mergers (e.g. Markevitch & Vikhlinin 2007; Bulbul et al. 2016), determine physical properties of the missing baryons in the form of filaments (e.g. Planck Collaboration Int. VIII 2013), and analyse the interplay between galaxy members and clusters (e.g. Hallman & Markevitch 2004) and even the distribution of dark matter (Clowe et al. 2006). We intend to obtain deeper Chandra and/or XMM-Newton data for these two pairs of galaxy clusters to perform this type of analysis.
The structure of the paper is as follows. We first present the selection procedure of the X-ray cluster candidates in Sect. 2. The confirmed cluster sample and X-ray parameters are presented in Sects. 3 and 4, while the remaining cluster candidates and their classifications are given in Sect. 5. The discovery of two new candidates for merging galaxy clusters is presented in Sect. 6. We summarise the work in Sect. 7. Throughout this paper, we used the cosmological parameters ΩM = 0.3, ΩΛ = 0.7 and H0 = 70 km s-1 Mpc-1.
2. X-ray cluster candidates
The 3XMM/SDSS Stripe 82 cluster survey is mainly based on the XMM X-ray serendipitous source catalogue. The latest version of the catalogue, 3XMM-DR5, was released on 2015 April 28. The 3XMM-DR5 catalogue contains 565 962 X-ray detections comprising 396,910 X-ray sources, which were detected in 7781 EPIC (PN, MOS1, MOS2) observations made public on/or before 2013 December 31. These observations cover 877 deg2 of the sky (Rosen et al. 2016).
Our procedure to construct a cluster (candidate) sample has two steps, as described below. We first select suitable XMM observations for our survey, followed by selecting X-ray cluster candidates detected in those fields.
2.1. Selection of XMM-Newton observations
The list of all XMM observations along with the parameters that were used in the construction of the 3XMM-DR5 catalogue were made public by the XMM Survey Science Centre (SSC) team at the catalogue homepage1. To include an observation from this list in our survey, the observation must fulfil the following criteria:
- 1.
The observation must be completely covered in the S82 survey scans, meaning that the whole field of view is embedded in the area of S82 with boundaries of −50.0° ≤ RA ≤ 60.0° and −1.25° ≤ Dec. ≤ 1.25° (Annis et al. 2014).
- 2.
It is considered as a clean observation according to the observation class (OBS_CLASS) parameter given in the 3XMM-DR5 catalogue. This parameter indicates the fraction of the field of view that has been flagged (masked) in zones where the source detection and/or characterisation are suspect (Rosen et al. 2016). Here we selected detections with OBS_CLASS = 0 (nothing has been flagged), 1 (0% <flaggedarea< 0.1%), and 2 (0.1% ≤ flaggedarea< 1%).
- 3.
The observation must be performed in the full frame mode with the full field of view exposed (prime full window, PFW) by at least EPIC PN or one of the MOS cameras.
We limited our survey to those XMM fields that are located in S82 since its imaging is deeper by 2 mag than other SDSS areas, allowing the spectroscopic follow-up of galaxies in the SDSS-III project to reach a redshift of 0.8. In addition, other data are available in the infrared (WISE, UKIDS) and at radio wavelengths (FIRST). These available data will enable us to conduct multi-wavelength studies of a large portion of the constructed sample.
Applying these selection criteria yielded 76 observations, which were visually inspected through the web-page of the XMM observations and data processing status2. This led to the exclusion of only two observations that have high background, as is clearly seen in the images and stated in the quality report given on that web-page. As a result, 74 observations are considered in our survey, their list is given in the Appendix A, Table A.1. The total area of these 74 fields is 11.25 deg2, taking the overlap areas among the fields into account.
Since we did not apply a criterion on the EPIC exposure time, the list of selected observations spans a wide range of good exposure times (good time intervals) from 2 ks to 65 ks. These exposures were given in the list of XMM observations that was used to construct the 3XMM-DR5 catalogue. Figure 1 shows the histogram of EPIC (PN, MOS1, MOS2) total good exposure times of the fields in our survey. About half of the fields with exposure times shorter than 5 ks were observed in a mosaic mode in the framework of the XMM-Newton survey of Stripe 82. This leads to almost twice the exposure time in the overlap regions as a result of the strategy of the mosaic mode observations (LaMassa et al. 2013).
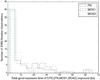 |
Fig. 1 Histogram of the EPIC (PN: green solid line, MOS1: blue dashed line, MOS2: red dash-dotted line) total good exposure time (after event filtering) of the survey fields (74 observations). |
2.2. Selection of X-ray extended sources
Galaxy clusters can be simply identified at X-ray wavelengths as X-ray luminous, continuous, spatially extended, extragalactic sources (Allen et al. 2011). Therefore, the list of extended sources in the XMM serendipitous source catalogue is considered as a valuable data base to construct X-ray selected cluster samples. In the 3XMM-DR5 catalogue, the detection is considered as an extended source when the extent radius is in the range of 6–80 arcsec. The extent radius is determined by the Science Analysis System (SAS) task emldetect that is derived by fitting a convolution of a β-model and a point spread function (PSF) to the source distribution of counts (Rosen et al. 2016).
We selected all the extended detections from the 3XMM-DR5 catalogue that are detected in the EPIC images of the 74 observations considered in our survey. This yielded a list of 120 extended detections. This list includes repeated detections that are due to the overlap between some observations. The 3XMM-DR5 catalogue provides a source ID (SRCID) for each detection, which is a unique ID for multiple detections. By using the SRCID as an indicator of a unique source, the list of X-ray extended sources comprises 114 objects. We have the same number of unique sources if we consider two detections as one source when their angular separation is smaller than the sum of their core radii (EPIC extent parameters) and larger than 20 arcsec. If there is more than one detection for the same source, we select the one with the highest photon counts. The multiple detections available for the same source will be later used in the spectral fitting to derive more accurate parameters.
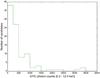 |
Fig. 2 Histogram of the EPIC photon counts in the broad energy band [0.2–12.0] keV as given in the 3XMM-DR5 catalogue for the X-ray cluster candidate sample. |
Known clusters of galaxies (CLG) with redshift measurements for the candidates in the literature.
Since we did not apply any criterion on the quality of the detections, we visually inspected each source in two steps to exclude spurious detections. The first step was to investigate the X-ray images through the FLIX upper limit server3. This inspection enabled us to remove sources that were located in the wings of bright sources, within a large extended source, or at a large off-axis angle. Another visual inspection was checking the corresponding colour images through the navigation tool of the SDSS server4, which allowed us to remove X-ray sources corresponding to the emission of nearby bright galaxies or from star clusters.
As a result, after these visual inspection processes the list of X-ray cluster candidates comprises 94 systems instead of 114 objects. Since our survey covers an area of 11.25 deg2, the spatial number density of the candidate list is 94/11.25 = 8.36 candidates deg-2. This is a comparable spatial density to that determined in the XMM-Newton Cluster Survey (XCS), 3675/410 = 8.96 candidates (with >50 background-subtracted counts) deg-2 (Lloyd-Davies et al. 2011).
The cluster candidate sample has a wide range of EPIC photon counts in the energy band [0.2–12.0] keV from 84 to 3440 counts, as shown in Fig. 2. The reliability of detected sources in the 3XMM-DR5 catalogue is evaluated by the maximum likelihood parameter (Det_ML), which varies from 6 (low reliability) to a few million (high reliability). For our candidate sample, the EPIC Det_ML parameter in [0.2–12.0] keV has a range of 8–1949 with a median of 35. We also note that the targets of the XMM fields are not excluded in the current survey. Therefore, the EPIC off-axis angles of the sample are smaller than 14 arcmin with a median of 7 arcmin. We point out here that our X-ray cluster candidate list will not define a complete cluster sample since we did not apply an X-ray flux limit. In addition, X-ray extended sources in the 3XMM-DR5 catalogue are detected from observations with various exposure times, as shown in the previous subsection.
3. Known clusters among the candidates
To analyse the X-ray and optical data of the candidate sample, we determined the cluster redshifts. This can be done either by using X-ray spectral fitting or optical imaging and/or spectroscopy. X-ray redshifts can be estimated for candidates with more than 1000 counts (12 percent, as shown in Fig. 2) (see for example Lamer et al. 2008; Yu et al. 2011; Lloyd-Davies et al. 2011). The alternative and main way is to estimate the cluster redshift based on optical/NIR photometric and spectroscopic data.
To do this, we cross-correlated the X-ray cluster candidate list with six available cluster catalogues selected in X-rays and/or optical bands to identify the previously known clusters and to obtain their redshifts, as described below. To complement the list of known clusters, we searched the NASA Extragalactic Database (NED) to obtain redshifts for systems that were not in the cross-matched catalogues. We then present the whole list of previously known clusters with redshift measurements as well as the available spectroscopic redshifts for cluster galaxies from the SDSS-DR12.
3.1. X-ray cluster surveys
Takey et al. (2011) presented a similar survey based on X-ray extended detections selected from an earlier version of the XMM-Newton serendipitous source catalogue (2XMMi-DR35, Watson et al. 2009) located in the SDSS-DR7 sky region. The 2XMMi-DR3 catalogue was based on XMM observations made before October 2009. They presented a cluster sample of 530 systems based on photometric redshifts of galaxies in SDSS-DR8 and another sample of 383 galaxy groups and clusters based on spectroscopic redshifts of galaxies in SDSS-DR10. In total, they have estimated the redshift of 597 X-ray selected clusters in the range of 0.03–0.79. Of these, 455 clusters have spectroscopic confirmation for at least one member galaxy with a spectrum in SDSS (Takey et al. 2013, 2014).
Mehrtens et al. (2012) presented the first data release of the XMM-Newton Cluster Survey (XCS), which was based on the entire XMM-Newton archive available till July 2010. The catalogue consists of 503 optically confirmed galaxy groups and clusters, among which 463 systems with redshift measurements in the range of 0.06–1.46. About half of these sources have spectroscopic confirmation either from the literature, follow-up campaigns, or SDSS.
Another serendipitous cluster catalogue was constructed in the framework of the XMM Cluster Archive Super Survey (X-CLASS) by Clerc et al. (2012). The catalogue comprises 422 cluster candidates with high signal-to-noise ratio (S/N) purely based on X-ray criteria from available XMM archival observations in or before May 2010. About half of these candidates are optically confirmed and assigned redshift estimates in the range from 0.02 to 1.73. The number of galaxy clusters with spectroscopic confirmation is 78, as given in their public catalogue.
We cross-matched our cluster candidate list and the X-ray selected cluster samples with redshift estimates from these three cluster surveys within a matching radius of 20 arcsec. In total, about one third of our candidates were selected and published in these surveys. The statistics of these X-ray cluster surveys and the matched cluster samples are given in Table 1.
We note that some clusters in the matched catalogues are located in the S82 region, but are not included in the common clusters resulting from the cross-matching process. There are 30, 40, and 6 X-ray galaxy clusters in S82 from the 2XMMi/SDSS, XCS, and X-CLASS catalogues, respectively. The clusters might be missing because the respective observations are not considered in the 3XMM-DR5 catalogue and/or in our current survey, because of different source detection algorithms, and/or because of our chosen cross-matching radius. Since the list of XMM observations used in these surveys is not public, the detailed comparison of recovering or missing clusters is not straightforward. A comparison between 422 extended sources detected in the X-CLASS catalogue and sources in the 3XMM-DR5 catalogue was reported by Rosen et al. (2016). They found that 59 of 422 sources (in general, faint or irregular detections) were classified as point sources, while the remaining objects were detected as extended sources. This indicates that we might miss some clusters when their detections are classified as point sources in the 3XMM-DR5 catalogue.
3.2. Optical cluster surveys
The largest published catalogue of optically selected galaxy clusters so far, based on the SDSS data, was compiled by Wen et al. (2012). They identified 132 684 clusters using the photometric redshifts of galaxies in SDSS-DR8. The catalogue was updated to re-estimate the cluster richness and to include the new spectroscopic redshifts available in SDSS-DR12. They also constructed a cluster catalogue comprising 25 419 new rich high-redshift clusters by modifying the cluster detection algorithm and using SDSS-DR12 (Wen & Han 2015). We combined the two catalogues in one table comprising 158 103 systems in the redshift range of 0.05–0.8 (WH15 hereafter), which was used in the cross-matching process. About 77 percent of these systems have spectroscopic redshifts for at least one galaxy member from SDSS as listed in both catalogues.
Another cluster survey based on SDSS-DR8 data is the redMaPPer red-sequence cluster finder by Rykoff et al. (2014). The catalogue comprises 26 350 clusters across the redshift range of 0.08–0.55. Of these clusters, 16 259 BCGs (62 percent) have spectroscopic redshifts from SDSS data, as given in their catalogue.
Geach et al. (2011) presented a cluster catalogue of 4098 objects identified in the SDSS Stripe 82 region based on statistical galaxy overdensities. The redshift of these systems ranges from 0.04 to 0.8. About 32 percent of these clusters have spectroscopic redshifts for at least one member galaxy from public spectroscopic data in SDSS-DR7, 2SLAQ and WiggleZ. Unfortunately, these spectroscopic redshifts are not given in their catalogue.
The positions of the X-ray cluster candidates are matched to these three catalogues using a search radius of one arcmin. The optically selected clusters are centred on the positions of the brightest cluster galaxies (BCGs), which are located mostly within 150 kpc from the X-ray positions (Takey et al. 2013). Therefore, the matching radius of one arcmin is suitable for the expected cluster redshift range of our sample z> 0.05. This matching process provides an identification of optical counterparts and redshift estimates for 41 percent of the cluster candidates. When a spectroscopic redshift in these catalogues was available for the optical counterpart, we used it instead of the photometric one. Table 1 lists the statistics of the matched cluster catalogues and the resulting common systems from the cross-matching process.
3.3. Literature redshifts: NED
About half of the X-ray cluster candidates were previously identified from both X-ray and optical cluster surveys, as mentioned above. To obtain redshift values for more cluster candidates, we searched the NED for available redshifts. If an optical or X-ray detected cluster was found in NED with an offset of less than one arcmin from the X-ray emission peak, we assigned its redshift to the cluster candidate. In this way, we ensured that the redshift values obtained from the cross-matching process are correct since some of them were confirmed from other surveys or by checking cluster galaxies with spectroscopic redshifts listed in NED. In addition, four cluster candidates with redshift measurements were detected in different projects (Wen et al. 2009; Gerke et al. 2012; Menanteau et al. 2013), as stated in Table 1.
3.4. Cluster sample with redshift measurements
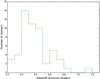 |
Fig. 3 Histogram of the redshift distribution of our sample of 54 clusters that were previously known in the literature. |
The cross-matching of the X-ray cluster candidates with the six mentioned optical and X-ray cluster catalogues and searching NED yielded 54 clusters with redshift measurements, as listed in the last row of Table 1. Of these 54 systems, 35 clusters are entered in more than one of the catalogues matched to ours. In these cases, we took the redshift from the catalogue that provides a spectroscopic redshift. About 83 percent of the cluster sample are spectroscopically confirmed according to the information given in the mentioned catalogues or listed in the NED.
The X-ray emission of one third of the cluster sample with redshift estimates is detected for the first time, while the remainder are known in one or more X-ray cluster surveys. It is worth pointing out that the current cluster survey includes some recent XMM observations that had not been performed or made public when conducting the previous XMM cluster surveys (XCS, 2XMMi/SDSS, X-CLASS). These surveys included XMM observations until July 2010 at the latest. Therefore, we explored more XMM-Newton fields (40 observations) located in the Stripe 82 made from July 2010 until December 2013. The known X-ray clusters from the cross-matching process are marked in the column “X-ray Catalogue” of Table C.1 by their catalogue name, while the new X-ray clusters have no entries in the column and the space is filled by “–9999′′.
Our cluster sample spans a broad redshift range from 0.05 to 1.19. We note here the re-detection of a cluster at redshift of 1.19, which was first discovered by Dietrich et al. (2007), spectroscopically confirmed by Šuhada et al. (2011), and listed in the XCS cluster catalogue. This is the only source in common with the distant cluster sample from the XMM-Newton Distant Cluster Project (XDCP) published by Fassbender et al. (2011). Our cluster sample also includes ten systems at high redshift beyond 0.6. Figure 3 shows the redshift distribution for the previously known cluster sample.
The cluster sample list with X-ray positions and redshift estimates is given in Table C.1. Figure 4 shows the images of an example cluster in X-rays and optical wavelengths. This is one of the X-ray brightest clusters in our sample that was also detected in the XCS and 2XMMi/SDSS projects and identified by the three optical cluster finders (WH15, redMaPPer, and Geach).
3.5. Spectroscopic redshifts for our cluster sample from SDSS-DR12
The cluster sample (54 galaxy groups/clusters) includes 45 and 9 systems that have spectroscopic and photometric redshifts from the cross-matched catalogues and/or from NED, respectively. We explored the SDSS-DR12 to have spectroscopic confirmation for our cluster sample, especially those systems with only photometric redshifts. First, we extracted the parameters (ObjID, position, magnitudes) of all galaxies surrounding the cluster centres (X-ray positions) within 10 arcmin from the Stripe 82 table in the Catalog Archive Server (CasJobs) database (Annis et al. 2014). Second, the galaxy sample was cross-matched with galaxies with spectroscopic redshifts in the SpecObj table of SDSS-DR12 (Alam et al. 2015). Third, the photometric redshift of each galaxy was taken from the galaxy photometric redshift catalogue by Reis et al. (2012).
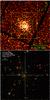 |
Fig. 4 Example cluster (DETID: 104037601010003, IAU Name: 3XMM J001737.3-005240) at a redshift of 0.2141 (spectroscopic redshift). Upper panel: X-ray image (EPIC PN from the pipeline products, 6′ × 6′) in [0.2–12.0] keV of XMM-Newton observation (0403760101) targeted at a starburst galaxy. The green circle (radius = 1′) and yellow box (3′ × 3′) are centred on the X-ray emission peak. Lower panel: SDSS colour image corresponding to the yellow box centred on the X-ray position as indicated by the cross-hair. Sources with spectroscopic redshifts from SDSS-DR12 are marked by red squares. |
To identify cluster galaxies with spectroscopic redshifts, we first need to define a physical search radius and a redshift range for the cluster redshift. We chose a search radius of R200 since it is comparable to the virial radius. In the next section, we estimated R500 for each system. We converted the estimated R500 to R200 by applying a factor of 1.5, which is derived as the mean and median value of R200/R500 for 401 clusters in the XCS cluster sample (Mehrtens et al. 2012). R500 and R200 are defined as the cluster radii within which the density is 500 and 200 times the critical density of the Universe at the cluster redshift, respectively. The range of cluster galaxy redshifts is ±0.02(1 + zCLG) and ±0.04(1 + zCLG) for clusters with spectroscopic and photometric redshifts in our sample, respectively.
As a result, 46 out of 54 clusters have spectroscopic confirmations based on at least one member galaxy with a spectrum in SDSS-DR12. The remaining systems are at high redshifts (z ≥ 0.65) beyond the magnitude limit of SDSS (6 clusters) or at low redshift (z ≤ 0.46) with no available spectra (2 objects). Figure 5 shows the distribution of cluster galaxies with spectroscopic redshifts within R200 from the X-ray emission peaks. In this way, we spectroscopically confirmed six clusters that have only photometric redshifts in the literature. There are still three clusters in our sample that need to be spectroscopically confirmed. Table C.1 lists in the last two columns the number of cluster galaxies with spectroscopic redshifts, when available, and the mean value of these redshifts.
The previous step was to confirm the spectroscopic redshifts given in the cross-matched catalogues and to spectroscopically confirm some clusters that previously had only photometric redshifts. We also performed tests to validate the optical detections and the redshifts of our cluster sample. First, when a cluster was identified in two or more catalogues with comparable redshifts, we confirmed its detection and redshift. Fourteen, ten, seven, and four clusters are entered in two, three, four, or five catalogues (the matched clusters), respectively. In total, 35 systems are detected in at least two cluster surveys. For all clusters, we also searched NED for redshifts available from other projects, see Sect. 3.3. Second, we plotted for each cluster the histogram of the photometric and spectroscopic redshifts of all the galaxies within 2 arcmin from the X-ray emission peak, as shown in Fig. 6 for the example cluster 3XMM J001737.3-005240. When a peak was consistent with the cluster redshift, we confirmed the cluster redshift, as for the example cluster. Third, we checked the spectroscopic redshift of the brightest galaxies near the X-ray positions through the SDSS skyserver tool, and also the spectroscopic redshifts available within R200 from the X-ray centres.
As a result of these tests, we confirm the redshifts given in our sample. Only in one case two clusters overlap at redshifts of 0.46 (photometric, Szabo et al. 2011; Takey et al. 2013) and 0.067 (spectroscopic, Merchán & Zandivarez 2005; McConnachie et al. 2009). We selected the cluster with the smallest physical offset between the BCG candidate and the X-ray emission peak. Two systems remain without spectroscopic confirmation.
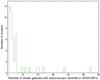 |
Fig. 5 Histogram of cluster galaxy members with spectroscopic redshifts available in the SDSS-DR12 that are consistent with the cluster redshift (see text). The bin size is one. |
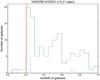 |
Fig. 6 Histogram of photometric (green solid line) and spectroscopic (blue dashed line) redshifts of galaxies located within 2 arcmin from the X-ray position of the example cluster (3XMM J001737.3-005240). The vertical red line indicates the spectroscopic redshift (0.2141) of the cluster that is consistent with the peaks in the redshift histograms. |
4. X-ray parameters of the known cluster sample with redshift measurements
Reliable X-ray temperatures can be obtained from spectral fitting when clusters have more than 300 net X-ray photon counts, as demonstrated by Lloyd-Davies et al. (2011). The uncertainties of the other estimated parameters (flux and luminosity) are also dependent on the brightness of the cluster. Two thirds of our cluster sample with redshifts have enough counts to derive X-ray temperatures with reasonable uncertainties. We postpone the X-ray spectral analysis for the cluster sample to an upcoming paper until we estimate redshifts for most of the remaining X-ray cluster candidates.
In the present paper, we estimate the X-ray properties of the cluster sample based on data available in the 3XMM-DR5 catalogue and scaling relations in the literature. The catalogue provides aperture-corrected β-model fluxes in different energy bands for individual cameras that were calculated with the SAS task emldetect. The EPIC flux in each band was computed as the weighted mean of the band-specific detections in all cameras. The weight was based on the flux error (Rosen et al. 2016). We determined the combined EPIC (PN, MOS1, MOS2) fluxes in the energy band [0.5–2.0] keV, Fcat, 0.5−2, as the sum of the EPIC fluxes in the [0.5-1.0] keV and [1.0–2.0] keV bands. The error of Fcat, 0.5−2 was determined as the propagated error from the flux errors in the two bands. For the cluster sample, we computed the X-ray luminosity and its error in the [0.5–2.0] keV band, Lcat, 0.5−2, based on Fcat, 0.5−2, its error, and the determined redshift.
Takey et al. (2014) presented a relation (Fig. 11 and Eq. (1)) that can be used to convert the X-ray luminosity in the [0.5–2.0] keV band, based on the flux given in the 2XMMi-DR3 catalogue, into X-ray bolometric luminosity (L500) within a physical radius of R500. Since the fluxes in the 2XMMi-DR3 and 3XMM-DR5 catalogues are not identical for a given source, we updated this relation based on the new flux estimates given in the 3XMM-DR5 catalogue. As stated in Sect. 3, 25 clusters are in common between the cluster sample selected from the 2XMMi-DR3 and 3XMM-DR5 catalogues. These 25 common systems have estimates for L500 based on either X-ray spectroscopic parameters from spectral fitting (15/25) or catalogue fluxes (10/25). We note here that we revised the redshift estimates for two clusters in the common sample.
For the systems in common except for the two clusters with revised redshifts, we correlated Lcat, 0.5−2 from the current work with L500 from (Takey et al. 2013, 2014), as shown in Fig. 7. The slope and intercept of the relation, derived using the BCES orthogonal regression method (bces Python module, Akritas & Bershady 1996), are 1.06 ± 0.09, 0.30 ± 0.11, respectively. The fitted parameters have large errors. This is due to the small number of common systems and to the existence of two systems with a large dispersion from the best-fit line. When we also exclude these two outliers, the slope and intercept have smaller errors: 0.95 ± 0.03 and 0.42 ± 0.05, respectively. The best fit of the relation after excluding four systems from the common systems is shown in Fig. 7, which is considered in the following steps. The slope of the current relation 0.95 ± 0.03 agrees with the value of 0.91 ± 0.02 derived by Takey et al. (2014).
We used the relation shown in Fig. 7 to derive L500 for all the cluster sample from the estimated Lcat, 0.5−2. The errors of Lcat, 0.5−2, slope, and intercept as well as the intrinsic scatter of the conversion relation were considered when we estimated the error in L500. The scaling relation presented here provides a simple way to convert Lcat, 0.5−2 into L500 taking the bolometric correction and the extrapolation of aperture corrected flux to R500 into account.
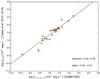 |
Fig. 7 Correlation between the X-ray luminosity Lcat, 0.5−2 based on the flux given in the 3XMM-DR5 catalogue and the X-ray bolometric luminosity L500 derived by Takey et al. (2013, 2014) for the 25 common clusters. The solid line represents the best fit of the relation (BCES orthogonal regression, Python module) based on 21 systems (green dots) after excluding four systems (blue open circles), see the text for more detail. The best-fit parameters are written in the lower right corner. |
To ensure that the conversion relation is acceptable, we compare the estimated luminosities with the values available in the literature. As mentioned in Sect. 3, there are 19 common systems between the current cluster sample and the XCS sample. Of these, only 14 clusters have L500 estimates in the XCS project. Figure 8 shows the comparison between the L500 measurements from XCS and current work, which are in fair agreement for this small sample. We should mention that three of the common systems used in the comparison have revised redshifts (from photometric to spectroscopic ones) in the current project. In addition, different procedures were used to compute L500 in the two projects. Moreover, the estimated L500 is mainly based on the flux given in the 3XMM-DR5 catalogue. If the flux estimate is inaccurate, this will derive an inaccurate estimate of L500 as well. The cluster sample has X-ray bolometric luminosities L500 in the range (1−356) × 1042 erg s-1 with a median of 35.2 × 1042 erg s-1.
The estimated L500 was used to determine the cluster mass, M500, using the L−M relation derived from a representative local cluster sample (REXCESS) by Pratt et al. (2009), assuming the relation is valid for distant clusters as well. We then determined R500 based on the derived value of M500. The majority of the cluster sample is in the low- and intermediate-mass regime since the range of masses is (2−25) × 1013M⊙ and the median is 8.4 × 10¹³M⊙. In the cluster sample are only three systems in the ROSAT cluster sample (Piffaretti et al. 2011). The mass measurements of these three systems agree well with the values derived from ROSAT data.
Table C.1 lists the cluster sample that comprises 54 systems with their redshift measurements as well as their X-ray properties. The columns of the catalogue are listed in Table B.1.
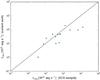 |
Fig. 8 Comparison of the current values of X-ray bolometric luminosity L500 and those derived in the XCS project for 14 common systems. The solid line represents the diagonal of the square. |
5. Sample of cluster candidates
We classified the remaining X-ray cluster candidates (40 systems) without available redshift estimates in the literature based on the appearance in X-ray images. We used the FLIX upper limit server6 to visually inspect the detections of these candidates. We assigned a class (class 1, good candidate) to detections with clear extended X-ray emission and a class (class 2, weak candidate) to sources with faint and unclear emission. Classes 1 and 2 have 24 and 16 candidate objects, respectively.
Another classification was made based on the appearance of cluster galaxies in the SDSS colour image. A very rough estimate of the candidate distance was assigned to each source as follows: low redshift (z< 0.6) and high redshift (z> 0.6). The candidates expected at low and high redshifts are 15 and 25 sources, respectively. Using the SDSS deep data in the Stripe 82, we expect to detect clusters at z ≤ 0.9.
Table C.2 lists the sample of the remaining cluster candidates (40 systems) with their X-ray positions, fluxes in the energy band [0.5–2.0] keV, and classifications (good or weak candidate and nearby or distant system). The column names of the table are listed in Table B.2.
6. Discovery of two merging galaxy cluster candidates
During the visual inspection of the X-ray and SDSS colour images of the cluster sample in our survey, we noted the small angular separation between two pairs of extended X-ray sources with X-ray emission between them. In addition, their optical counterparts have similar redshifts, as reported in various projects. This drew our attention to the cluster merger candidates in our cluster sample, therefore we searched for cluster pairs with a physical separation smaller than R200 and a redshift difference of Δz< 0.05. As a result, we found only those two pairs that were spotted by eye during the visual inspection process. The first pair (3XMM J010606.7+004925 and 3XMM J010610.0+005108) is at a redshift z ~ 0.26, while the second pair (3XMM J030617.3-000836 and 3XMM J030633.1-000350) is at z ~ 0.11, the latter probably being two subclusters of Abell 0412 (A 412 hereafter). We describe here the X-ray properties of the two systems and build galaxy density maps to draw the distribution of cluster galaxies and to estimate the significance of the galaxy overdensities detected in the cluster regions.
6.1. Twin galaxy clusters 3XMM J010606.7+004925 and 3XMM J010610.0+005108 at z ~ 0.26
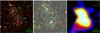 |
Fig. 9 Left: XMM-Newton EPIC (PN, MOS1, MOS2) combined image in the total energy band [0.2–12.0] keV for the twin galaxy clusters, 3XMM J010606.7+004925 (SW) and 3XMM J010610.0+005108 (NE). This observation, ObsID = 0150870201, is obtained as a reprocessed product from the XMM-Newton Science Archive. Middle: deep SDSS image in the r-band from the Stripe 82 data corresponding to the X-ray field. The overlaid X-ray surface brightness contours (yellow) are in the total energy band [0.2–12.0] keV. Right: density map of the galaxies with photometric redshifts within zCLG ± 0.03(1 + zCLG) of the NE cluster redshift (see text). The contours start at 3σ and increase by 1σ. In the three images, the circles have radii equal to the cluster core radii (SW: rc = 42.9 arcsec, NE: rc = 36.8 arcsec) and are centred on the X-ray emission peaks. The sizes of all the images are 6 × 6 arcmin2 (1.4 × 1.4 Mpc2) centred on a middle point between the two clusters. |
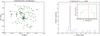 |
Fig. 10 Left: sky distribution of the cluster galaxies selected based on their photometric redshifts (green dots, 99 galaxies) or spectroscopic redshifts (red dots overplotted on the green dots, 14 galaxies) within 1.5 Mpc (6.3 arcmin) centred on a position between the two systems, 3XMM J010606.7+004925 (SW) and 3XMM J010610.0+005108 (NE). The X-ray cluster positions of the two components are marked by the cyan circle centres, while the BCG is marked by the blue circle centre within the SW cluster. Right: histogram of all galaxies with spectroscopic redshifts (29 galaxies, main figure) and of cluster galaxy members (14 galaxies, inset) within the aperture considered. In both histograms, the vertical red lines indicate the redshift of the NE cluster. |
X-ray parameters of the twin clusters based on available Chandra and XMM-Newton data.
The two galaxy clusters, J010606.7+004925 (south-west, SW system) and J010610.0+005108 (north-east, NE cluster), were detected as two independent systems with slightly different redshift estimates in two X-ray cluster surveys by Barkhouse et al. (2006) and Takey et al. (2013). Other galaxy cluster detection algorithms identified the two clusters as a single system since they are close to each other and have almost the same redshift (Goto et al. 2002; Bahcall et al. 2003; Lopes et al. 2004; Koester et al. 2007; Wen et al. 2009; Hao et al. 2010; Mehrtens et al. 2012).
Barkhouse et al. (2006) conducted a survey of serendipitous X-ray selected clusters in the framework of the Chandra Multiwavelength Project (ChaMP) and detected the pair of clusters as two extended serendipitous sources at an off-axis angle of about 3 arcmin in an observation with a short exposure time of 3.8 ks. The redshift of the first system (SW), 0.2767, was obtained from a possible association with an optical cluster from NED, while the redshift for the second system (NE), 0.2630, was obtained from a galaxy close to the X-ray emission peak. Table 2 lists the estimated parameters of the two clusters based on these Chandra data. Barkhouse et al. did not state that they might form a merging system.
In the 2XMMi/SDSS galaxy cluster survey, these two clusters were identified in X-rays (Takey et al. 2013). Both systems were detected at off-axis angles of ~3.2 arcmin in the same XMM-Newton field. Their optical counterparts were identified and their redshifts, z ~ 0.26, were estimated based on the few galaxies with available spectroscopic redshifts in the SDSS-DR8, see the redshift values listed in Table 2.
This pair of clusters was re-identified in our present cluster survey. Figure 9 (left) shows the combined XMM-Newton EPIC (PN, MOS1, MOS2) image of the cluster pair in the energy band [0.2–12.0] keV, showing two separated extended sources. Table 2 lists the main parameters derived for the two clusters from the 3XMM-DR5 catalogue and our work (see the previous section for the cluster luminosity and mass calculations). The estimated X-ray luminosities and masses show that the two clusters have similar properties (redshifts, core radii, fluxes, luminosities, and masses), suggesting that they can be considered as twin galaxy clusters.
The angular separation between the two X-ray detections is 1.9 arcmin (452 kpc, at the cluster redshift), which is smaller than R500 = 2.9 arcmin (685 kpc). The two clusters are marked in Fig. 9 by circles centred on the X-ray positions with radii equal to their core radii as given in the 3XMM-DR5 catalogue. The X-ray emission peaks coincide with two concentrations of bright galaxies, as seen in the SDSS image in Fig. 9 (middle). The X-ray contours clearly show two separated extended sources with distortions in their X-ray surface brightness distributions. It is worth mentioning here that the brightest cluster galaxies do not coincide with the peaks of the innermost contours of both systems. Similar features have been observed in other merging clusters (e.g. Maughan et al. 2003).
We note that the X-ray fluxes in the [0.5–2] keV band derived from Chandra and XMM-Newton observations are different, as listed in Table 2. The X-ray observations available from Chandra (3.8 ks) and XMM-Newton (2.4 ks, good time interval) are too shallow to determine the physical properties of the cluster pair with good accuracy. To obtain a detailed analysis of the ICM and of the region between these two clusters and to detect small-scale features such as bow shocks or cold fronts, if present, deep X-ray observations are required. We have applied to observe this cluster pair with Chandra.
To show the distribution of cluster galaxies on the sky, we selected all the galaxies within 1.5 Mpc (6.3 arcmin) from a middle point between the cluster pair with photometric redshifts in the interval zCLG ± 0.03(1 + zCLG), where zCLG is the NE cluster redshift 0.2566. Cluster galaxies with spectroscopic redshifts in the range of zCLG ± 0.01 were also selected. Figure 10 (left) shows the sky distribution of cluster galaxies in the pair region selected by their photometric (99 galaxies) and spectroscopic (14 objects) redshifts. We can clearly see two concentrations of galaxies around the X-ray centres, similar to those appearing in the SDSS r-band image. Figure 10 (right) presents the histogram of spectroscopic redshifts (29) in the chosen region. It shows a peak at the cluster redshift, and the histogram zoomed around the cluster redshift (14 galaxies) shows an almost Gaussian distribution.
The cluster galaxies selected based on their photometric redshifts were used to compute a density map, with a fixed Gaussian kernel of 1.95 arcmin, a pixel size of 4.68 arcsec, and 10 bootstraps (Martinet et al. 2016). To derive the significance level of our detections, we estimated the mean background and dispersion. For this, we drew the histogram of the pixel intensities. We applied a 2.5σ clipping to eliminate the pixels of the image that have high values and correspond to objects in the image. We then redrew the histogram of the pixel intensities after clipping and fit this distribution with a Gaussian. The mean value and the width of the Gaussian will give the mean background level and the dispersion, respectively, which we call σ. We then computed the values of the contours corresponding to 3σ detections as the background plus 3σ.
The galaxy density map (Fig. 9, right) shows two structures detected at 12σ and coinciding with the X-ray emission peaks. This confirms the two structures seen in X-ray and optical images (Fig. 9, left and middle). In addition to the two clusters, we detected at 3σ a galaxy group south-west of the SW cluster (outside the field of Fig. 9). The redshift of this group (~0.25) is almost the same as for the twin clusters, and it is located along the same direction as the two cluster centres. The coordinates and the spectroscopic redshift of the brightest galaxy in the group are (16.483576, 0.714648) and z = 0.2515. The brightest galaxy position matches a cluster position (GMBCG J016.48356+00.71464 at a photometric redshift of 0.251) identified by Hao et al. (2010). The separation between the SW cluster and the brightest group galaxy is 7.1 arcmin (1.7 Mpc). This suggests that the cluster pair and the galaxy group are located along a large-scale structure filament. We searched for X-ray sources around the galaxy group position but detected neither point nor extended sources in the current XMM-Newton observation.
6.2. Abell 0412 (z ~ 0.11)
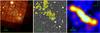 |
Fig. 11 Left: XMM-Newton EPIC(PN, MOS1, MOS2) image in [0.2–12] keV of ObsID=0142610101 for Abell 0412 (C1) and the other two clusters (C2 and C3). The blue circle indicates the BCG position, which is located to the south-west of C1 position. Middle: deep S82 image in the r band corresponding to the X-ray image. The overplotted contours (yellow) are X-ray surface brightness contours in [0.2–12] keV. Right: density map of the galaxies with photometric redshifts within zCLG ± 0.03(1 + zCLG) of the cluster redshift (see text). The contours start at 4σ and increase by 2σ. In the three images, the cyan circles have one arcmin radii and are centred on the X-ray emission peaks of the three (C1, C2, C3) X-ray sources. The sizes of all images are 25 × 25 arcmin2 (~3 × 3 Mpc2). |
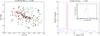 |
Fig. 12 Left: sky distribution of cluster galaxies within 2.5 Mpc (20.9 arcmin) from A 412 selected based on their photometric (green dots, 191 galaxies) and spectroscopic (red dots overplotted on green dots, 91 galaxies) redshifts. The cyan circles are centred on the X-ray emission peaks of the three clusters, while the blue circle is centred on the BCG position. Right: spectroscopic redshift histogram of galaxies within 2.5 Mpc from A 412. The inset shows a zoom around the mean cluster redshift. |
X-ray parameters for Abell 0412 (C1) and the other subclusters (C2 and C3) from the present work and the published ones.
A 412 is a rich galaxy cluster identified by Abell (1958), Abell et al. (1989). It was later detected by various teams in SDSS data by applying several algorithms (Goto et al. 2002; Bahcall et al. 2003; Miller et al. 2005; Koester et al. 2007; Wen et al. 2009, 2012; Hao et al. 2010; Smith et al. 2012). Combining X-ray data from the ROSAT All-Sky Survey (RASS) and SDSS galaxies, A 412 was also identified by Schuecker et al. (2004). The redshift of the system reported in these projects is ~0.11. It is worth mentioning that the cluster centres in these catalogues can differ by as much as 5 arcmin (~600 kpc). Popesso et al. (2007) searched for the X-ray counterparts in the RASS of 137 optically selected Abell clusters in the framework of the RASS-SDSS galaxy cluster survey. They found that A 412 is one of the 27 X-ray undetected clusters, which are probably in the process of forming by undergoing a mass accretion phase.
Based on XMM-Newton observations, A 412 is detected in three X-ray cluster surveys (XCS, 2XMMi/SDSS, X-CLASS) with an offset from the optical cluster centre of about 2 arcmin. In addition to the main X-ray counterpart of A 412, two other X-ray detected clusters lie at a similar redshift in the same XMM-Newton field identified by Takey et al. (2011), Mehrtens et al. (2012), Takey et al. (2013). The main X-ray cluster is bright, while the two other systems are faint (see Table 3). In these papers, they are not reported as possible merging clusters.
In our current work, only two systems (A 412 (C1, 3XMM J030617.3-000836) and C2, 3XMM J030633.1-000350) are re-detected as extended X-ray sources, while the third cluster (C3, 2XMM J030645.0-000136) is listed as a point-like source in the 3XMM catalogue. The XMM-Newton observation of the cluster field had an exposure time of ~74 ks, but ~40 percent of the exposure was lost through flares. There is no available Chandra observation for this field to check the extent of C3. In our visual inspection, we noted the similarity of their redshifts and the closeness of their positions. Figure 11 (left and middle) shows the X-ray and optical images of the three galaxy clusters. The separation between C1 (A 412) and the other two clusters is 6.2 arcmin (740 kpc) for C2 and 9.9 arcmin (1177 kpc) for C3. The three systems are aligned in the same direction, here again suggesting that we are detecting a large-scale structure filament. Table 3 lists the main parameters for these clusters from our work and the mentioned surveys. The X-ray luminosities from different surveys do not agree, possibly because of the strong contamination by background flares and/or different analysis algorithms.
We selected all cluster galaxies located within 2.5 Mpc (20.9 arcmin) from the X-ray emission peak of the main component of A 412 (C1). The selection was based on a redshift interval of zCLG ± 0.03(1 + zCLG) (photometric) and zCLG ± 0.01 (spectroscopic), where zCLG (0.1093) is the spectroscopic redshift of A 412. In the chosen aperture, 191 and 91 galaxies with photometric and spectroscopic redshifts, respectively, lie in the cluster range.
The spatial distribution of the selected cluster galaxies is presented in Fig. 12 (left). It shows galaxy overdensities similar to those appearing in the SDSS image around X-ray positions. This means that the three cluster systems are roughly in the plane of the sky. The brightest galaxy of the selected galaxies can be considered as the BCG and is offset by 4.7 arcmin (561 kpc) from the main X-ray emission peak of A 412. Figure 12 (right) shows the spectroscopic redshift histogram of all the galaxies within the chosen aperture (main figure) and of cluster galaxies (inset). It shows a significant peak at the cluster redshift and an almost Gaussian distribution of the spectroscopic redshifts of cluster galaxies.
We built the galaxy density map for the photometrically selected cluster galaxies in a similar way as for the other cluster pair. The Gaussian kernel was fixed to 3.9 arcmin and the significance levels of the detections were generated as described above. Figure 11 (right) shows the density map for the cluster galaxies, with C1 and C2 detected at a high significance level (22σ and 20σ, respectively). Two fainter structures are detected at a 12σ significance level, one north-east of C3 and one south-west of C1 around the BCG position. The C3 structure itself is detected at a lower significance level and may belong to the structure detected to its north-east. We therefore seem to be observing a chain of four clusters here, the two brightest being C1 and C2, and the other two being less massive.
7. Summary and outlook
We have conducted a galaxy cluster survey based on extended detections in the third XMM-Newton serendipitous source catalogue (3XMM-DR5) located in the footprint of SDSS Stripe 82. The survey comprises 94 X-ray cluster candidates detected in 74 XMM-Newton observations that cover a survey area of 11.25 deg2. We presented the cluster sample extracted from the cluster candidates that were previously known as galaxy clusters in the literature with redshift measurements. The redshifts were obtained by cross-matching our X-ray cluster candidate list with cluster catalogues extracted from X-ray (XCS, 2XMMi/SDSS, X-CLASS) and optical (WH15, redMaPPer, Geach) surveys or by searching NED. This yielded a cluster sample of 54 galaxy groups or clusters in the redshift range 0.05–1.2 with a median of 0.36. Of these 54 clusters, 45 have spectroscopic confirmations from the matched catalogues or NED. We also used the spectroscopic redshifts from SDSS-DR12 to re-confirm the redshifts of the cluster sample. These data enabled us to re-confirm redshifts of 46 clusters and to give spectroscopic confirmations for six clusters with only photometric redshifts. About one third of the cluster sample are newly discovered clusters in X-rays.
For each system in the cluster sample, we determined the X-ray luminosity in the [0.5–2.0] keV band based on the flux given in the 3XMM-DR5 catalogue. The luminosity was converted into the bolometric luminosity within R500 based on a scaling relation derived in the current work. The estimated bolometric luminosity was then used to measure the cluster mass based on the scaling relation of Pratt et al. (2009). We also presented the remaining X-ray cluster candidates (40 systems) with flags indicating a rough estimate of their expected redshifts according to SDSS images and their probability of being real sources according to X-ray images. This list includes 25 objects expected to be at high redshift z> 0.6. We also reported the detection of two cluster pairs and discussed their properties based on the available X-ray and SDSS data. These systems probably have more than two components and deserve to be studied in more detail with deeper X-ray exposures with Chandra and XMM-Newton.
For the remaining cluster candidates without redshift measurement, we plan to estimate the cluster photometric redshifts based on deep SDSS (Stripe 82 co-add) data (Annis et al. 2014), or other deep optical/NIR archival data, or to follow-up the candidates with no deep archival data. When we have the redshifts for the majority of the X-ray cluster candidates, we will investigate the X-ray luminosity-temperature relation for our cluster sample that includes systems with a broad range of luminosity and redshift. In addition, the galaxy luminosity functions as well as the morphological analysis of cluster galaxies will be investigated. We will also use our X-ray selected sample to improve the centre positions of the clusters detected by the AMACFI cluster finder (Durret et al. 2015).
Acknowledgments
This work is supported by the Egyptian Science and Technology Development Fund (STDF) and the French Institute in Egypt (IFE) in cooperation with the Institut d’Astrophysique de Paris (IAP), France. F.D. acknowledges long-term support from CNES. We thank Hugo Capelato and Florian Sarron for their contribution to the software to create galaxy density maps and compute significance contour levels. We also thank the referee for the useful comments that helped to improve the paper. This research has made use of data obtained from the 3XMM XMM-Newton serendipitous source catalogue compiled by the 10 institutes of the XMM-Newton Survey Science Centre selected by ESA. This work is based on observations obtained with XMM-Newton, an ESA science mission with instruments and contributions directly funded by ESA Member States and the USA (NASA). This research has made use of the NASA/IPAC Extragalactic Database (NED) which is operated by the Jet Propulsion Laboratory, California Institute of Technology, under contract with the National Aeronautics and Space Administration (NASA). Funding for SDSS-III has been provided by the Alfred P. Sloan Foundation, the Participating Institutions, the National Science Foundation, and the US Department of Energy. The SDSS-III web site is http://www.sdss3.org/. SDSS-III is managed by the Astrophysical Research Consortium for the Participating Institutions of the SDSS-III Collaboration including the University of Arizona, the Brazilian Participation Group, Brookhaven National Laboratory, University of Cambridge, University of Florida, the French Participation Group, the German Participation Group, the Instituto de Astrofisica de Canarias, the Michigan State/Notre Dame/JINA Participation Group, Johns Hopkins University, Lawrence Berkeley National Laboratory, Max Planck Institute for Astrophysics, New Mexico State University, New York University, Ohio State University, Pennsylvania State University, University of Portsmouth, Princeton University, the Spanish Participation Group, University of Tokyo, University of Utah, Vanderbilt University, University of Virginia, University of Washington, and Yale University.
References
- Abell, G. O. 1958, ApJS, 3, 211 [NASA ADS] [CrossRef] [Google Scholar]
- Abell, G. O., Corwin, Jr., H. G., & Olowin, R. P. 1989, ApJS, 70, 1 [NASA ADS] [CrossRef] [EDP Sciences] [Google Scholar]
- Akritas, M. G., & Bershady, M. A. 1996, ApJ, 470, 706 [NASA ADS] [CrossRef] [Google Scholar]
- Alam, S., Albareti, F. D., Allen de Prieto, C., et al. 2015, ApJS, 219, 12 [NASA ADS] [CrossRef] [Google Scholar]
- Allen, S. W., Evrard, A. E., & Mantz, A. B. 2011, ARA&A, 49, 409 [NASA ADS] [CrossRef] [Google Scholar]
- Annis, J., Soares-Santos, M., Strauss, M. A., et al. 2014, ApJ, 794, 120 [NASA ADS] [CrossRef] [Google Scholar]
- Bahcall, N. A. 1988, ARA&A, 26, 631 [NASA ADS] [CrossRef] [Google Scholar]
- Bahcall, N. A., McKay, T. A., Annis, J., et al. 2003, ApJS, 148, 243 [NASA ADS] [CrossRef] [Google Scholar]
- Barkhouse, W. A., Green, P. J., Vikhlinin, A., et al. 2006, ApJ, 645, 955 [NASA ADS] [CrossRef] [Google Scholar]
- Bleem, L. E., Stalder, B., de Haan, T., et al. 2015, ApJS, 216, 27 [NASA ADS] [CrossRef] [Google Scholar]
- Böhringer, H. 2006, X-ray Studies of Clusters of Galaxies, The Universe in X-rays [Google Scholar]
- Böhringer, H., & Schartel, N. 2013, Astron. Nachr., 334, 482 [NASA ADS] [CrossRef] [Google Scholar]
- Böhringer, H., Schuecker, P., Guzzo, L., et al. 2004, A&A, 425, 367 [NASA ADS] [CrossRef] [EDP Sciences] [Google Scholar]
- Bulbul, E., Randall, S. W., Bayliss, M., et al. 2016, ApJ, 818, 131 [Google Scholar]
- Burenin, R. A., Vikhlinin, A., Hornstrup, A., et al. 2007, ApJS, 172, 561 [NASA ADS] [CrossRef] [Google Scholar]
- Clerc, N., Sadibekova, T., Pierre, M., et al. 2012, MNRAS, 423, 3561 [NASA ADS] [CrossRef] [Google Scholar]
- Clerc, N., Adami, C., Lieu, M., et al. 2014, MNRAS, 444, 2723 [NASA ADS] [CrossRef] [Google Scholar]
- Clowe, D., Bradač, M., Gonzalez, A. H., et al. 2006, ApJ, 648, L109 [NASA ADS] [CrossRef] [Google Scholar]
- de Hoon, A., Lamer, G., Schwope, A., et al. 2013, A&A, 551, A8 [NASA ADS] [CrossRef] [EDP Sciences] [Google Scholar]
- Dietrich, J. P., Erben, T., Lamer, G., et al. 2007, A&A, 470, 821 [NASA ADS] [CrossRef] [EDP Sciences] [Google Scholar]
- Durret, F., Adami, C., Bertin, E., et al. 2015, A&A, 578, A79 [NASA ADS] [CrossRef] [EDP Sciences] [Google Scholar]
- Ebeling, H., Edge, A. C., Böhringer, H., et al. 1998, MNRAS, 301, 881 [NASA ADS] [CrossRef] [Google Scholar]
- Ebeling, H., Edge, A. C., Mantz, A., et al. 2010, MNRAS, 407, 83 [NASA ADS] [CrossRef] [Google Scholar]
- Ettori, S., Donnarumma, A., Pointecouteau, E., et al. 2013, Space Sci. Rev., 177, 119 [NASA ADS] [CrossRef] [Google Scholar]
- Fassbender, R., Böhringer, H., Nastasi, A., et al. 2011, New J. Phys., 13, 125014 [NASA ADS] [CrossRef] [Google Scholar]
- Finoguenov, A., Guzzo, L., Hasinger, G., et al. 2007, ApJS, 172, 182 [Google Scholar]
- Finoguenov, A., Watson, M. G., Tanaka, M., et al. 2010, MNRAS, 403, 2063 [NASA ADS] [CrossRef] [Google Scholar]
- Geach, J. E., Murphy, D. N. A., & Bower, R. G. 2011, MNRAS, 413, 3059 [NASA ADS] [CrossRef] [Google Scholar]
- Gerke, B. F., Newman, J. A., Davis, M., et al. 2012, ApJ, 751, 50 [NASA ADS] [CrossRef] [Google Scholar]
- Gioia, I. M., Henry, J. P., Maccacaro, T., et al. 1990, ApJ, 356, L35 [NASA ADS] [CrossRef] [Google Scholar]
- Goto, T., Sekiguchi, M., Nichol, R. C., et al. 2002, AJ, 123, 1807 [NASA ADS] [CrossRef] [Google Scholar]
- Hallman, E. J., & Markevitch, M. 2004, ApJ, 610, L81 [NASA ADS] [CrossRef] [Google Scholar]
- Hao, J., McKay, T. A., Koester, B. P., et al. 2010, ApJS, 191, 254 [NASA ADS] [CrossRef] [Google Scholar]
- Hasselfield, M., Hilton, M., Marriage, T. A., et al. 2013, J. Cosmol. Astropart., 7, 8 [Google Scholar]
- Koester, B. P., McKay, T. A., Annis, J., et al. 2007, ApJ, 660, 239 [NASA ADS] [CrossRef] [Google Scholar]
- Kolokotronis, V., Georgakakis, A., Basilakos, S., et al. 2006, MNRAS, 366, 163 [NASA ADS] [Google Scholar]
- LaMassa, S. M., Urry, C. M., Cappelluti, N., et al. 2013, MNRAS, 436, 3581 [NASA ADS] [CrossRef] [Google Scholar]
- Lamer, G., Hoeft, M., Kohnert, J., Schwope, A., & Storm, J. 2008, A&A, 487, L33 [NASA ADS] [CrossRef] [EDP Sciences] [Google Scholar]
- Lloyd-Davies, E. J., Romer, A. K., Mehrtens, N., et al. 2011, MNRAS, 418, 14 [NASA ADS] [CrossRef] [Google Scholar]
- Lopes, P. A. A., de Carvalho, R. R., Gal, R. R., et al. 2004, AJ, 128, 1017 [NASA ADS] [CrossRef] [Google Scholar]
- Mahmoud, E., Takey, A., & Shoukry, A. 2016, Astronomy and Computing, 16, 174 [NASA ADS] [CrossRef] [Google Scholar]
- Markevitch, M., & Vikhlinin, A. 2007, Phys. Rep., 443, 1 [NASA ADS] [CrossRef] [EDP Sciences] [Google Scholar]
- Martinet, N., Clowe, D., Durret, F., et al. 2016, A&A, 590, A69 [NASA ADS] [CrossRef] [EDP Sciences] [Google Scholar]
- Maughan, B. J., Jones, L. R., Ebeling, H., et al. 2003, ApJ, 587, 589 [NASA ADS] [CrossRef] [Google Scholar]
- McConnachie, A. W., Patton, D. R., Ellison, S. L., & Simard, L. 2009, MNRAS, 395, 255 [NASA ADS] [CrossRef] [Google Scholar]
- Mehrtens, N., Romer, A. K., Hilton, M., et al. 2012, MNRAS, 423, 1024 [NASA ADS] [CrossRef] [Google Scholar]
- Menanteau, F., Sifón, C., Barrientos, L. F., et al. 2013, ApJ, 765, 67 [NASA ADS] [CrossRef] [Google Scholar]
- Merchán, M. E., & Zandivarez, A. 2005, ApJ, 630, 759 [NASA ADS] [CrossRef] [Google Scholar]
- Miller, C. J., Nichol, R. C., Reichart, D., et al. 2005, AJ, 130, 968 [Google Scholar]
- Ota, N. 2012, Res. Astron. Astrophys., 12, 973 [NASA ADS] [CrossRef] [Google Scholar]
- Pierre, M., Pacaud, F., Adami, C., et al. 2016, A&A, 592, A1 [NASA ADS] [CrossRef] [EDP Sciences] [Google Scholar]
- Piffaretti, R., Arnaud, M., Pratt, G. W., Pointecouteau, E., & Melin, J.-B. 2011, A&A, 534, A109 [NASA ADS] [CrossRef] [EDP Sciences] [Google Scholar]
- Pillepich, A., Porciani, C., & Reiprich, T. H. 2012, MNRAS, 422, 44 [NASA ADS] [CrossRef] [Google Scholar]
- Planck Collaboration Int. VIII. 2013, A&A, 550, A134 [NASA ADS] [CrossRef] [EDP Sciences] [Google Scholar]
- Planck Collaboration XXVII. 2016, A&A, 594, A27 [NASA ADS] [CrossRef] [EDP Sciences] [Google Scholar]
- Popesso, P., Biviano, A., Böhringer, H., & Romaniello, M. 2007, A&A, 464, 451 [NASA ADS] [CrossRef] [EDP Sciences] [Google Scholar]
- Pratt, G. W., Croston, J. H., Arnaud, M., & Böhringer, H. 2009, A&A, 498, 361 [NASA ADS] [CrossRef] [EDP Sciences] [Google Scholar]
- Reiprich, T. H., & Böhringer, H. 2002, ApJ, 567, 716 [NASA ADS] [CrossRef] [Google Scholar]
- Reis, R. R. R., Soares-Santos, M., Annis, J., et al. 2012, ApJ, 747, 59 [NASA ADS] [CrossRef] [Google Scholar]
- Rosati, P., della Ceca, R., Norman, C., & Giacconi, R. 1998, ApJ, 492, L21 [NASA ADS] [CrossRef] [Google Scholar]
- Rosati, P., Borgani, S., & Norman, C. 2002, ARA&A, 40, 539 [NASA ADS] [CrossRef] [Google Scholar]
- Rosen, S. R., Webb, N. A., Watson, M. G., et al. 2016, A&A, 590, A1 [NASA ADS] [CrossRef] [EDP Sciences] [Google Scholar]
- Rykoff, E. S., Rozo, E., Busha, M. T., et al. 2014, ApJ, 785, 104 [NASA ADS] [CrossRef] [Google Scholar]
- Sarazin, C. L. 1988, X-ray emission from clusters of galaxies (Cambridge, UK: Cambridge Univ. Press) [Google Scholar]
- Schuecker, P., Böhringer, H., & Voges, W. 2004, A&A, 420, 61 [NASA ADS] [CrossRef] [EDP Sciences] [Google Scholar]
- Smith, A. G., Hopkins, A. M., Hunstead, R. W., & Pimbblet, K. A. 2012, MNRAS, 422, 25 [NASA ADS] [CrossRef] [Google Scholar]
- Šuhada, R., Fassbender, R., Nastasi, A., et al. 2011, A&A, 530, A110 [NASA ADS] [CrossRef] [EDP Sciences] [Google Scholar]
- Šuhada, R., Song, J., Böhringer, H., et al. 2012, A&A, 537, A39 [NASA ADS] [CrossRef] [EDP Sciences] [Google Scholar]
- Szabo, T., Pierpaoli, E., Dong, F., Pipino, A., & Gunn, J. 2011, ApJ, 736, 21 [NASA ADS] [CrossRef] [Google Scholar]
- Takey, A., Schwope, A., & Lamer, G. 2011, A&A, 534, A120 [NASA ADS] [CrossRef] [EDP Sciences] [Google Scholar]
- Takey, A., Schwope, A., & Lamer, G. 2013, A&A, 558, A75 [NASA ADS] [CrossRef] [EDP Sciences] [Google Scholar]
- Takey, A., Schwope, A., & Lamer, G. 2014, A&A, 564, A54 [NASA ADS] [CrossRef] [EDP Sciences] [Google Scholar]
- Tundo, E., Moretti, A., Tozzi, P., et al. 2012, A&A, 547, A57 [NASA ADS] [CrossRef] [EDP Sciences] [Google Scholar]
- Vikhlinin, A., Kravtsov, A. V., Burenin, R. A., et al. 2009, ApJ, 692, 1060 [NASA ADS] [CrossRef] [Google Scholar]
- Voit, G. M. 2005, Rev. Mod. Phys., 77, 207 [NASA ADS] [CrossRef] [Google Scholar]
- Watson, M. G., Schröder, A. C., Fyfe, D., et al. 2009, A&A, 493, 339 [NASA ADS] [CrossRef] [EDP Sciences] [Google Scholar]
- Wen, Z. L., & Han, J. L. 2015, ApJ, 807, 178 [NASA ADS] [CrossRef] [Google Scholar]
- Wen, Z. L., Han, J. L., & Liu, F. S. 2009, ApJS, 183, 197 [NASA ADS] [CrossRef] [Google Scholar]
- Wen, Z. L., Han, J. L., & Liu, F. S. 2012, ApJS, 199, 34 [NASA ADS] [CrossRef] [Google Scholar]
- Yu, H., Tozzi, P., Borgani, S., Rosati, P., & Zhu, Z.-H. 2011, A&A, 529, A65 [NASA ADS] [CrossRef] [EDP Sciences] [Google Scholar]
Appendix A: XMM-Newton fields in the survey
XMM-Newton observations included in the 3XMM/SDSS Stripe 82 galaxy cluster survey.
Appendix B: Column description of cluster and cluster candidate catalogues
Column names of the cluster catalogue constructed from our survey.
Columns of the catalogue of the remaining cluster candidates in our survey without redshift estimates.
Appendix C: Additional tables
Cluster sample (54 objects) with redshift measurements in the literature.
Cluster candidate sample (40 detections) with their X-ray positions, observation IDs, and fluxes as given in the 3XMM-DR5 catalogue.
All Tables
Known clusters of galaxies (CLG) with redshift measurements for the candidates in the literature.
X-ray parameters of the twin clusters based on available Chandra and XMM-Newton data.
X-ray parameters for Abell 0412 (C1) and the other subclusters (C2 and C3) from the present work and the published ones.
XMM-Newton observations included in the 3XMM/SDSS Stripe 82 galaxy cluster survey.
Columns of the catalogue of the remaining cluster candidates in our survey without redshift estimates.
Cluster candidate sample (40 detections) with their X-ray positions, observation IDs, and fluxes as given in the 3XMM-DR5 catalogue.
All Figures
|
Fig. 1 Histogram of the EPIC (PN: green solid line, MOS1: blue dashed line, MOS2: red dash-dotted line) total good exposure time (after event filtering) of the survey fields (74 observations). |
| In the text | |
|
Fig. 2 Histogram of the EPIC photon counts in the broad energy band [0.2–12.0] keV as given in the 3XMM-DR5 catalogue for the X-ray cluster candidate sample. |
| In the text | |
|
Fig. 3 Histogram of the redshift distribution of our sample of 54 clusters that were previously known in the literature. |
| In the text | |
|
Fig. 4 Example cluster (DETID: 104037601010003, IAU Name: 3XMM J001737.3-005240) at a redshift of 0.2141 (spectroscopic redshift). Upper panel: X-ray image (EPIC PN from the pipeline products, 6′ × 6′) in [0.2–12.0] keV of XMM-Newton observation (0403760101) targeted at a starburst galaxy. The green circle (radius = 1′) and yellow box (3′ × 3′) are centred on the X-ray emission peak. Lower panel: SDSS colour image corresponding to the yellow box centred on the X-ray position as indicated by the cross-hair. Sources with spectroscopic redshifts from SDSS-DR12 are marked by red squares. |
| In the text | |
|
Fig. 5 Histogram of cluster galaxy members with spectroscopic redshifts available in the SDSS-DR12 that are consistent with the cluster redshift (see text). The bin size is one. |
| In the text | |
|
Fig. 6 Histogram of photometric (green solid line) and spectroscopic (blue dashed line) redshifts of galaxies located within 2 arcmin from the X-ray position of the example cluster (3XMM J001737.3-005240). The vertical red line indicates the spectroscopic redshift (0.2141) of the cluster that is consistent with the peaks in the redshift histograms. |
| In the text | |
|
Fig. 7 Correlation between the X-ray luminosity Lcat, 0.5−2 based on the flux given in the 3XMM-DR5 catalogue and the X-ray bolometric luminosity L500 derived by Takey et al. (2013, 2014) for the 25 common clusters. The solid line represents the best fit of the relation (BCES orthogonal regression, Python module) based on 21 systems (green dots) after excluding four systems (blue open circles), see the text for more detail. The best-fit parameters are written in the lower right corner. |
| In the text | |
|
Fig. 8 Comparison of the current values of X-ray bolometric luminosity L500 and those derived in the XCS project for 14 common systems. The solid line represents the diagonal of the square. |
| In the text | |
|
Fig. 9 Left: XMM-Newton EPIC (PN, MOS1, MOS2) combined image in the total energy band [0.2–12.0] keV for the twin galaxy clusters, 3XMM J010606.7+004925 (SW) and 3XMM J010610.0+005108 (NE). This observation, ObsID = 0150870201, is obtained as a reprocessed product from the XMM-Newton Science Archive. Middle: deep SDSS image in the r-band from the Stripe 82 data corresponding to the X-ray field. The overlaid X-ray surface brightness contours (yellow) are in the total energy band [0.2–12.0] keV. Right: density map of the galaxies with photometric redshifts within zCLG ± 0.03(1 + zCLG) of the NE cluster redshift (see text). The contours start at 3σ and increase by 1σ. In the three images, the circles have radii equal to the cluster core radii (SW: rc = 42.9 arcsec, NE: rc = 36.8 arcsec) and are centred on the X-ray emission peaks. The sizes of all the images are 6 × 6 arcmin2 (1.4 × 1.4 Mpc2) centred on a middle point between the two clusters. |
| In the text | |
|
Fig. 10 Left: sky distribution of the cluster galaxies selected based on their photometric redshifts (green dots, 99 galaxies) or spectroscopic redshifts (red dots overplotted on the green dots, 14 galaxies) within 1.5 Mpc (6.3 arcmin) centred on a position between the two systems, 3XMM J010606.7+004925 (SW) and 3XMM J010610.0+005108 (NE). The X-ray cluster positions of the two components are marked by the cyan circle centres, while the BCG is marked by the blue circle centre within the SW cluster. Right: histogram of all galaxies with spectroscopic redshifts (29 galaxies, main figure) and of cluster galaxy members (14 galaxies, inset) within the aperture considered. In both histograms, the vertical red lines indicate the redshift of the NE cluster. |
| In the text | |
|
Fig. 11 Left: XMM-Newton EPIC(PN, MOS1, MOS2) image in [0.2–12] keV of ObsID=0142610101 for Abell 0412 (C1) and the other two clusters (C2 and C3). The blue circle indicates the BCG position, which is located to the south-west of C1 position. Middle: deep S82 image in the r band corresponding to the X-ray image. The overplotted contours (yellow) are X-ray surface brightness contours in [0.2–12] keV. Right: density map of the galaxies with photometric redshifts within zCLG ± 0.03(1 + zCLG) of the cluster redshift (see text). The contours start at 4σ and increase by 2σ. In the three images, the cyan circles have one arcmin radii and are centred on the X-ray emission peaks of the three (C1, C2, C3) X-ray sources. The sizes of all images are 25 × 25 arcmin2 (~3 × 3 Mpc2). |
| In the text | |
|
Fig. 12 Left: sky distribution of cluster galaxies within 2.5 Mpc (20.9 arcmin) from A 412 selected based on their photometric (green dots, 191 galaxies) and spectroscopic (red dots overplotted on green dots, 91 galaxies) redshifts. The cyan circles are centred on the X-ray emission peaks of the three clusters, while the blue circle is centred on the BCG position. Right: spectroscopic redshift histogram of galaxies within 2.5 Mpc from A 412. The inset shows a zoom around the mean cluster redshift. |
| In the text | |
Current usage metrics show cumulative count of Article Views (full-text article views including HTML views, PDF and ePub downloads, according to the available data) and Abstracts Views on Vision4Press platform.
Data correspond to usage on the plateform after 2015. The current usage metrics is available 48-96 hours after online publication and is updated daily on week days.
Initial download of the metrics may take a while.