Fig. 10
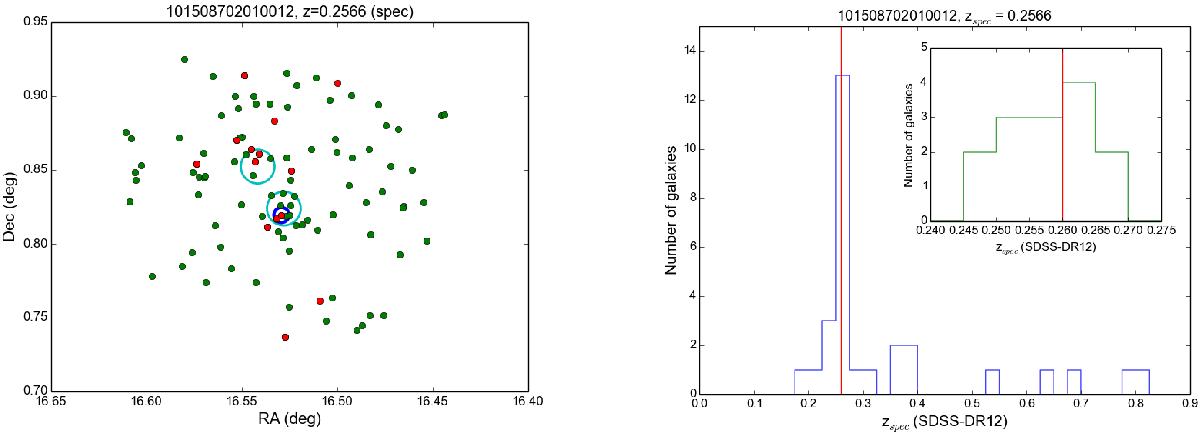
Left: sky distribution of the cluster galaxies selected based on their photometric redshifts (green dots, 99 galaxies) or spectroscopic redshifts (red dots overplotted on the green dots, 14 galaxies) within 1.5 Mpc (6.3 arcmin) centred on a position between the two systems, 3XMM J010606.7+004925 (SW) and 3XMM J010610.0+005108 (NE). The X-ray cluster positions of the two components are marked by the cyan circle centres, while the BCG is marked by the blue circle centre within the SW cluster. Right: histogram of all galaxies with spectroscopic redshifts (29 galaxies, main figure) and of cluster galaxy members (14 galaxies, inset) within the aperture considered. In both histograms, the vertical red lines indicate the redshift of the NE cluster.
Current usage metrics show cumulative count of Article Views (full-text article views including HTML views, PDF and ePub downloads, according to the available data) and Abstracts Views on Vision4Press platform.
Data correspond to usage on the plateform after 2015. The current usage metrics is available 48-96 hours after online publication and is updated daily on week days.
Initial download of the metrics may take a while.