Fig. 7
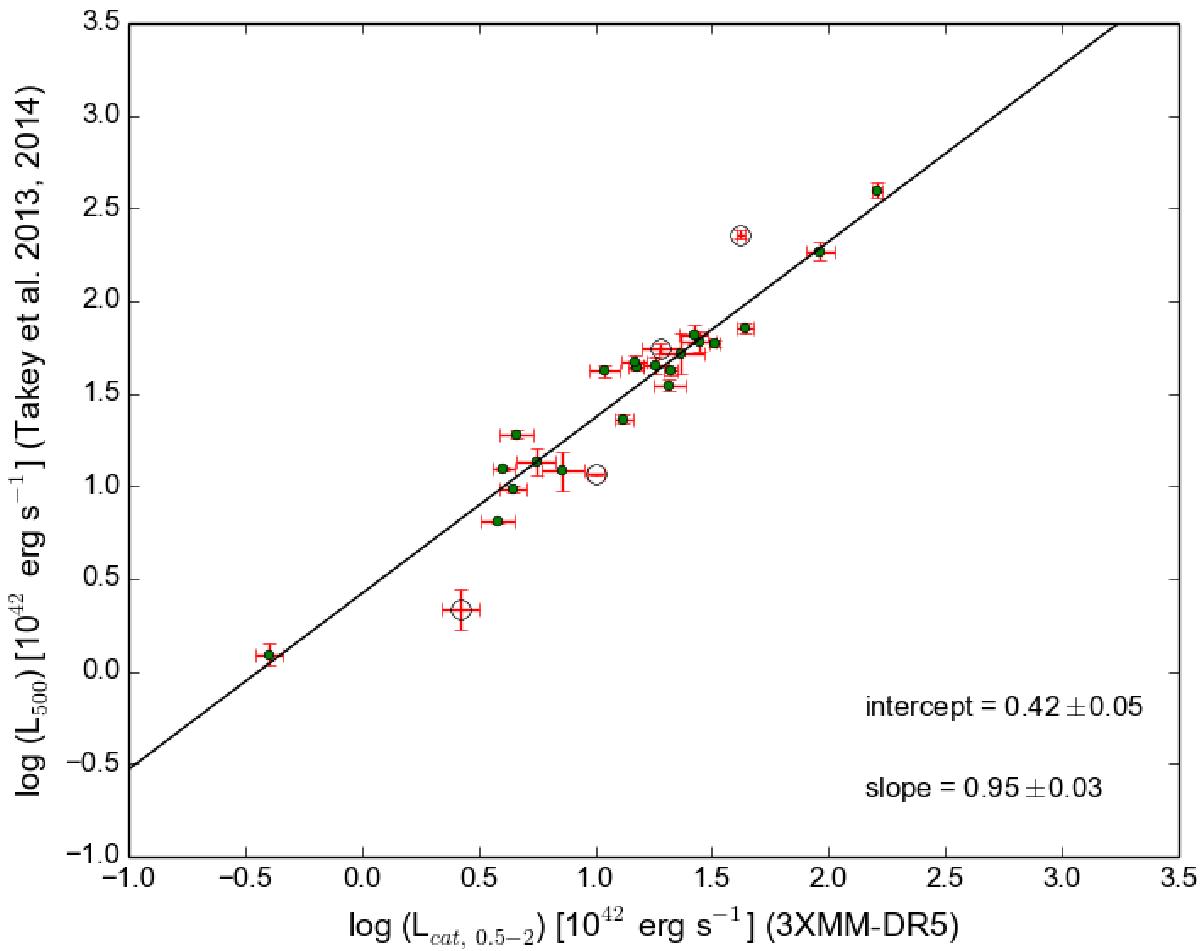
Correlation between the X-ray luminosity Lcat, 0.5−2 based on the flux given in the 3XMM-DR5 catalogue and the X-ray bolometric luminosity L500 derived by Takey et al. (2013, 2014) for the 25 common clusters. The solid line represents the best fit of the relation (BCES orthogonal regression, Python module) based on 21 systems (green dots) after excluding four systems (blue open circles), see the text for more detail. The best-fit parameters are written in the lower right corner.
Current usage metrics show cumulative count of Article Views (full-text article views including HTML views, PDF and ePub downloads, according to the available data) and Abstracts Views on Vision4Press platform.
Data correspond to usage on the plateform after 2015. The current usage metrics is available 48-96 hours after online publication and is updated daily on week days.
Initial download of the metrics may take a while.