Fig. 6
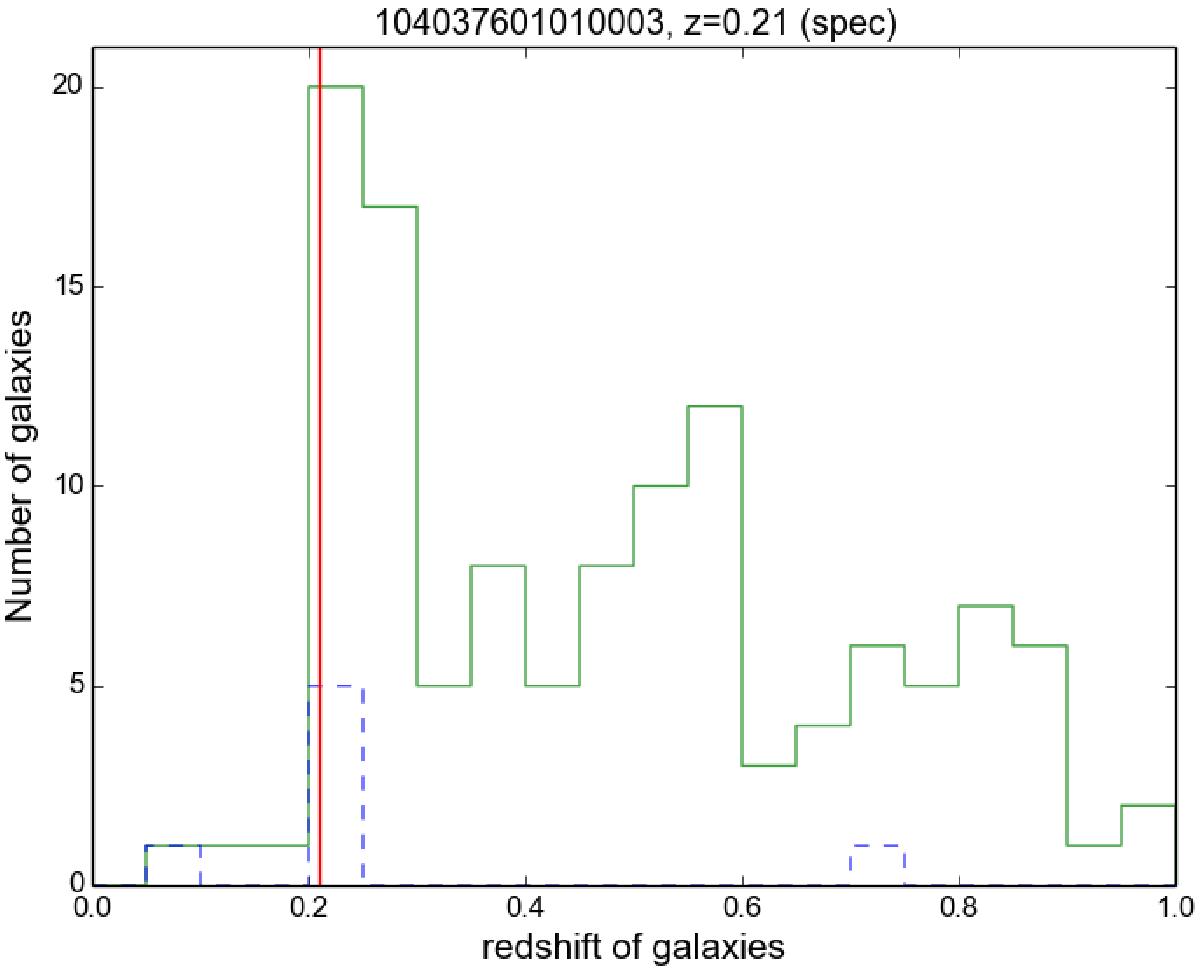
Histogram of photometric (green solid line) and spectroscopic (blue dashed line) redshifts of galaxies located within 2 arcmin from the X-ray position of the example cluster (3XMM J001737.3-005240). The vertical red line indicates the spectroscopic redshift (0.2141) of the cluster that is consistent with the peaks in the redshift histograms.
Current usage metrics show cumulative count of Article Views (full-text article views including HTML views, PDF and ePub downloads, according to the available data) and Abstracts Views on Vision4Press platform.
Data correspond to usage on the plateform after 2015. The current usage metrics is available 48-96 hours after online publication and is updated daily on week days.
Initial download of the metrics may take a while.