Fig. 12
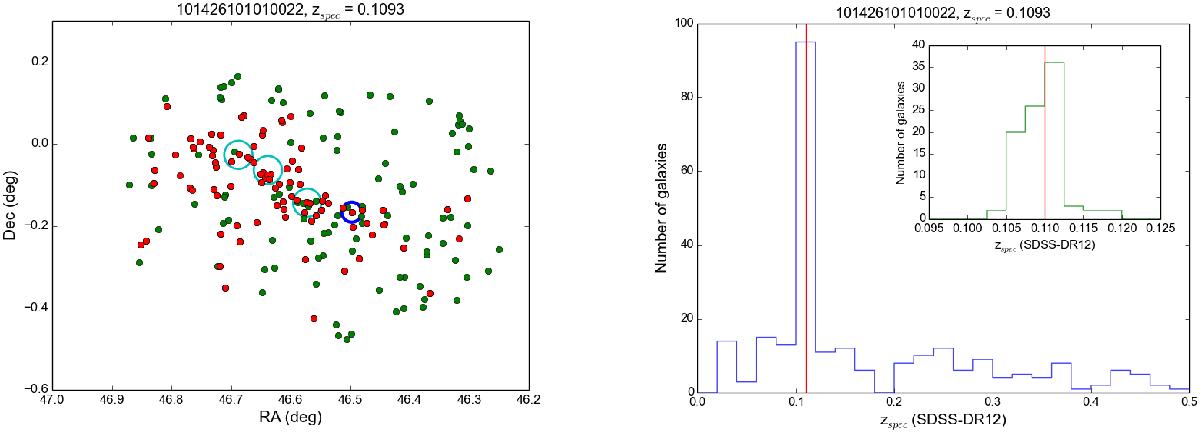
Left: sky distribution of cluster galaxies within 2.5 Mpc (20.9 arcmin) from A 412 selected based on their photometric (green dots, 191 galaxies) and spectroscopic (red dots overplotted on green dots, 91 galaxies) redshifts. The cyan circles are centred on the X-ray emission peaks of the three clusters, while the blue circle is centred on the BCG position. Right: spectroscopic redshift histogram of galaxies within 2.5 Mpc from A 412. The inset shows a zoom around the mean cluster redshift.
Current usage metrics show cumulative count of Article Views (full-text article views including HTML views, PDF and ePub downloads, according to the available data) and Abstracts Views on Vision4Press platform.
Data correspond to usage on the plateform after 2015. The current usage metrics is available 48-96 hours after online publication and is updated daily on week days.
Initial download of the metrics may take a while.