| Issue |
A&A
Volume 591, July 2016
|
|
|---|---|---|
| Article Number | A9 | |
| Number of page(s) | 12 | |
| Section | Interstellar and circumstellar matter | |
| DOI | https://doi.org/10.1051/0004-6361/201628272 | |
| Published online | 02 June 2016 | |
Effect of multilayer ice chemistry on gas-phase deuteration in starless cores
1 Max-Planck-Institute for Extraterrestrial Physics (MPE), Giessenbachstr. 1, 85748 Garching, Germany
e-mail: osipila@mpe.mpg.de
2 Leiden Observatory, Leiden University, PO Box 9513, 2300 RA Leiden, The Netherlands
Received: 8 February 2016
Accepted: 15 April 2016
Context. Astrochemical models commonly used to study the deuterium chemistry in starless cores consider a two-phase approach in which the ice on the dust grains is assumed to be entirely reactive. Recent experimental studies suggest that cold interstellar ices are mostly inert, and a multilayer model distinguishing the chemical processes at the surface and in the ice bulk would be more appropriate.
Aims. We investigate whether the multilayer model can be as successful as the bulk model in reproducing the observed abundances of various deuterated gas-phase species toward starless cores.
Methods. We calculated abundances for various deuterated species as functions of time using a pseudo-time-dependent chemical model adopting fixed physical conditions. We also estimated abundance gradients in starless cores by adopting a modified Bonnor-Ebert sphere as a core model. In the multilayer ice scenario, we consider desorption from one or several monolayers on the surface.
Results. We find that the multilayer model predicts abundances of DCO+ and N2D+ that are about an order of magnitude lower than observed; the difference is caused by the trapping of CO and N2 within the grain mantle. As a result of the mantle trapping, deuteration efficiency in the gas phase increases and we find stronger deuterium fractionation in ammonia than has been observed. Another distinguishing feature of the multilayer model is that D3+ becomes the main deuterated ion at high density. The bulk ice model is generally easily reconciled with observations.
Conclusions. Our results underline that more theoretical and experimental work is needed to understand the composition and morphology of interstellar ices, and the desorption processes that can act on them. With the current constraints, the bulk ice model appears to reproduce the observations more accurately than the multilayer ice model. According to our results, the abundance ratio of H2D+ to N2D+ is higher than 100 in the multilayer model, while only a few ×10 in the bulk model, and so observations of this ratio could provide information on the ice morphology in starless cores. Observations of the abundance of D3+ compared to H2D+ and D2H+, although challenging, would provide additional constraints for the models.
Key words: ISM: abundances / ISM: clouds / ISM: molecules / astrochemistry
© ESO, 2016
1. Introduction
Deuterated species are useful tracers of the cold (T ~ 10 K) and dense (nH ~ 104−106 cm-3) interiors of starless cores, where otherwise abundant neutral species, such as CO, are depleted onto grain surfaces. After depletion occurs, deuterium chemistry initiates through the exothermic reactions
 The deuterated
  isotopologs can then transfer a deuteron to other species (e.g., CO or N2), forming various deuterated ions, and can also contribute to the formation of deuterated ammonia (Rodgers & Charnley 2001). As a result of the deuteration process, the deuterium fraction in the various species, i.e., the abundance ratio of the deuterated and hydrogenated isotopologs, can increase to orders of magnitude above the elemental D/H ratio of ~10-5 (Linsky 2003). Modeled deuterium fractions can easily reach ≥10% (Roberts et al. 2003), and such high fractionation has also been observed for example for ammonia (Roueff et al. 2005), formaldehyde (Bergman et al. 2011), and methanol (Parise et al. 2004).
The dissociative recombination of deuterated ions releases atomic deuterium into the gas, which can then be adsorbed onto grain surfaces, and thus contributes to deuteration on the surface by addition or abstraction reactions. The efficiency of surface reactions is influenced heavily by the properties of the ice (e.g., Taquet et al. 2012). Many past models of surface chemistry have adopted a so-called bulk ice approach where the entirety of the ice on a grain is available for chemical reactions and thermal or non-thermal desorption (e.g., Semenov et al. 2010; Aikawa et al. 2012; Sipilä et al. 2013). However, interstellar ices are expected to be amorphous layered structures (Hama & Watanabe 2013), and the bulk approach seems unrealistic as a model for grain chemistry given the experimental evidence against efficient reactivity beneath a few monolayers (MLs) of ice (Watanabe et al. 2003, 2004). As an alternative to the bulk model, three-phase models separating the ice into a reactive surface layer and an unreactive mantle have been studied (Hasegawa & Herbst 1993b; Charnley & Rodgers 2009; Garrod & Pauly 2011; Taquet et al. 2012). Here the three-phase model is referred to as the multilayer model. The multilayer approach has advantages over the bulk approach, in which every atom/molecule can in principle react with any other atom/molecule in the ice. The multilayer model allows for a more intuitive description of the overall reactivity by limiting the reactions to a part of the ice, although everything can still react with everything within that part of the ice. The multilayer approach therefore affects the chemical composition of ices by trapping reactive species into the bulk, inducing higher abundances of radicals in the ice in the multilayer model than are seen in the bulk model (Taquet et al. 2012). Another example of the advantages of the multilayer approach is the treatment of desorption; in the bulk model species can be desorbed from anywhere in the ice matrix, whereas in the conventional multilayer model desorption only occurs from the top layer(s), which is physically more reasonable.
The previous multilayer models have mostly concentrated on studying the evolution of ice species. In this paper we concentrate instead on the feedback of multilayer ice chemistry to the chemical evolution of deuterated species in the gas phase; our particular aim is to investigate whether the multilayer ice model can reproduce the observed abundances of various deuterated species as successfully as the bulk model has been found to do. This is accomplished by updating our previous gas-grain models (Sipilä et al. 2015a,b), which include extensive descriptions of deuterium and spin-state chemistry, to also include the multilayer ice approach presented by Hasegawa & Herbst (1993b). The abundances of the various species are studied in conditions with varying density and temperature, and comparisons between the bulk and multilayer approaches in predicted gas-phase abundances are made.
The paper is structured as follows. In Sect. 2, we present the chemical model used in this paper. In Sect. 3, we present results from single-point models assuming fixed values for the physical parameters, and results from a core model yielding abundance gradients. We discuss our results and present some alternative models in Sect. 4, and present our conclusions in Sect. 5. Appendix A presents some additional results.
2. Chemical model
2.1. Multilayer and bulk ice chemistry
We use a modified version of the gas-grain chemical code described in detail in Sipilä et al. (2015a). Specifically, we added to the code the three-phase description of gas-grain chemistry developed by Hasegawa & Herbst (1993b; see also Taquet et al. 2014), in which the ice on the grains is separated into a chemically active surface layer and a chemically inert mantle. Chemical species can be transferred from the surface to the mantle in the case of net adsorption onto the grain surfaces, and vice versa in the case of net desorption. As noted in the Introduction, this approach allows for a qualitatively more realistic approach to grain-surface chemistry than bulk ice models do (see Sipilä 2012; Sipilä et al. 2013, 2015a for details of our previous bulk ice model). Here we compare a bulk ice model to a multilayer model to assess the possible impact of a different ice description on the gas-phase abundances of deuterated species.
The present model includes three desorption processes. Thermal desorption and cosmic ray (CR) induced desorption (Hasegawa & Herbst 1993a) are treated identically to Sipilä et al. (2015a). In addition, we introduced CO and H2O photodesorption into the model using the formulae presented in Coutens et al. (2014; see also Hollenbach et al. 2009). The assumed photodesorption yields are 2.7 × 10⁻³ for CO (Öberg et al. 2009b) and 1.0 × 10⁻³ for H2O (Öberg et al. 2009a). For simplicity, we assume that HDO and D2O photodesorb with the same yield as H2O, and that this also applies to the associated ortho and para states. We assume that H2O photodesorbs in molecular form, although studies have shown that its dissociation products can desorb individually upon absorption of a UV photon by a surface H2O molecule (Andersson & van Dishoeck 2008; Arasa et al. 2010, 2015). We assume F0 = 108 photons cm-2 s-1 for the flux of interstellar photons and GCR = 10-4 for the efficiency of photodesorption by secondary UV photons created by H2 excitation in environments with high visual extinction (Prasad & Tarafdar 1983; Shen et al. 2004). In the bulk ice model no restrictions are placed on thermal and cosmic ray induced desorption, as in our previous studies. However, photodesorption is limited to two MLs (as has recently been assumed by Hincelin et al. 2015).
In their multilayer model, Hasegawa & Herbst (1993b) assumed that desorption processes only affect the surface layer. However, studies have shown that photodesorption can occur from multiple layers, and that the photodesorption yield drops at deeper layers in the ice (Öberg et al. 2009a; Arasa et al. 2015). Furthermore, in the case of CO, van Hemert et al. (2015) have found that photodesorption inwards of the third monolayer is almost negligible. Since cosmic rays are highly energetic and can easily penetrate deep into the ice, it seems reasonable that cosmic-ray induced desorption could also occur from beneath the surface layer1. We therefore assume that, in the multilayer model, the included desorption processes apply to the surface layer and to one layer in the mantle. The photodesorption yield is assumed to be the same for surface and mantle photodesorption.
In practice, mantle desorption is implemented into the model by applying an efficiency factor to the desorption terms of the mantle species. The efficiency is unity until the first ML of the mantle is complete, and drops as 1/ML afterwards; when n MLs of ice (n ≥ 1) have accumulated in the mantle, the CR desorption terms of the mantle species are multiplied by 1 /n, which ensures that desorption comes from one ML. Essentially, the mantle is treated as a bulk and the desorption rate of each mantle species is dependent on the average abundance of that species in the mantle. The desorption efficiency is unity at all times for species in the surface layer.
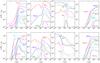 |
Fig. 1 Fractional abundances (with respect to nH) of selected gas-phase and ice species (labeled in the plots) as functions of time in a homogeneous model with Tgas = Tdust = 10 K. For those species that have spin states, the plotted abundances represent sums over the spin states. Solid lines correspond to the bulk ice model, while dashed lines correspond to the multilayer ice model. In the latter case, the ice abundances (right-hand panels) represent sums over the surface and mantle. Upper row: nH = 105 cm-3. Lower row: nH = 106 cm-3. |
2.2. Chemical reaction sets and model parameters
We adopt the gas-phase and grain-surface chemical reaction sets from Sipilä et al. (2015b). Both sets include deuterated species with up to six atoms. In Sipilä et al. (2015b), the spin-state branching ratios in reactions involving multiple protons and/or deuterons were derived using a group-theoretical approach. As in Sipilä et al. (2015b), the present model considers explicitly the spin states of all species included in the  reacting system and in the water and ammonia formation networks, although in what follows we only present results where the spin states of each species have been summed over. In total, the model contains ~51 000 gas-phase reactions, ~2600 grain-surface reactions, and ~1400 chemical species (the various spin states are counted as distinct species).
In this paper, we present the abundances of various (deuterated) species as functions of time as calculated with our pseudo-time-dependent rate-equation chemical code. We show the results of single-point models (corresponding to fixed values of the physical parameters), and of core models including density and temperature gradients. Table 1 shows the adopted physical parameters and initial chemical abundances, which are from Sipilä et al. (2015a). These values were used to produce the results presented below, except where otherwise noted.
Adopted values for the various physical parameters (left column) and adopted initial abundances (right column).
The grain model adopted here (single-sized spherical grains; parameters given in Table 1) is comparable to that used in the GRAINOBLE multilayer model (Taquet et al. 2012, 2013, 2014). However, some differences between the models exist. Here we adopt constant binding energies for all species while in the GRAINOBLE model the binding energies vary dynamically with the coverage of the ice (Taquet et al. 2014). The GRAINOBLE model assumes desorption only from the surface layer, while we allow desorption from one layer in the mantle as well. We compare the present chemical model to the GRAINOBLE model in Sect. 4.4.
All of the other details of the chemical model, including the forms of the rate coefficients for the various chemical processes considered, can be found in Sipilä et al. (2015a).
3. Results
3.1. Single-point models
3.1.1. Variable density
Figure 1 shows the abundances of some common (deuterated) gas-phase species along with the most abundant deuterated ice constituents as functions of time for the bulk ice and multilayer models and different physical conditions. It is evident that the results can be very different depending on the choice of the ice model.
At nH = 105 cm-3, the abundances predicted by the two models agree well up to t ~ 105 yr, but at later times the multilayer model predicts a factor of ~2 more H2D+, a factor of ~10 more D2H+, and a factor of ~40 more  (at late times), while simultaneously the abundances of N2D+ and DCO+ can be a factor of ~3–4 and 10 lower, respectively, than in the bulk model. This can be understood as follows. H2D+, D2H+, and are most efficiently destroyed by CO for as long as it subsists in the gas phase. Mantle trapping leads to very efficient CO freezeout and consequently the abundances of deuterated are able to attain higher values in the multilayer model than in the bulk model. Similarly, the abundances of N2D+ and DCO+ suffer from the mantle trapping of their precursor molecules.
The isotopologs are formed mainly by reactions belonging to the reacting system (e.g., Hugo et al. 2009) and are thus dependent on the abundance of gas-phase HD. In the bulk model, the deuteration degree begins to decrease on long timescales caused by the depletion of HD from the gas phase by grain-surface chemistry (see also Sipilä et al. 2013), whereas in the multilayer model H, H2, and their deuterated isotopologs have a very limited number of reacting partners, which leads to boosted surface HD production through H + D− → HD, retaining the degree of deuterium fractionation in the gas phase.
Ammonia presents an interesting behavior, as the differences between the bulk and multilayer models are smaller the more D atoms are involved. Ammonia production starts with the dissociation of N2 by He+, and is thus dependent on the depletion of nitrogen onto grain surfaces. The depletion is stronger in the multilayer model because of mantle trapping. However, ammonia deuteration is controlled mainly by the isotopologs (see Rodgers & Charnley 2001; Sipilä et al. 2015b), and thus the increased abundances of the isotopologs in the multilayer model compensate for the depletion and act to increase the deuteration degree of ammonia with respect to the bulk model.
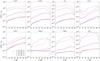 |
Fig. 2 Abundances of various deuterated species as functions of temperature (Tgas = Tdust) at different times (indicated in the figure). The adopted medium density is nH = 105 cm-3. The blue lines represent the bulk ice model, while the red lines represent the multilayer ice model. |
In both models, the three main deuterium carriers on the grain surface are HDO, NH2D, and CH3D. As explained above, HD production is favored on grains in the multilayer model because of the lack of atomic deuterium transfer to the mantle, which leads to a lower deuterium fractionation in the ice in the multilayer model than in the bulk model. Unlike in Sipilä et al. (2013), we note that deuterium is distributed more evenly even in the bulk model, as opposed to getting locked mostly in surface HDO. This is partly due to a missing dissociation reaction (HDO− → OH + D on the surface) in the Sipilä et al. (2013) model, which was added for Sipilä et al. (2015a; see their Sect. 3.1), but mainly because of the introduction of deuteration to up to six atoms which allows for complete treatments of ammonia and methane deuteration (which depend critically on  and
and  , respectively).
At nH = 106 cm-3, the results of the bulk and multilayer models are very different. Considering first the multilayer model only, it is seen that the deuteration peak shifts from a few × 105 yr to very early times, a few × 104 yr. This occurs because the efficiency of mantle transport depends on the total formation rates of the various species on the grain surface (Hasegawa & Herbst 1993b); at high density, adsorption rates are high, which decreases the time required to accumulate one ML of ice on the surface. Accordingly, CO and N2 deplete from the gas very quickly, leading to extremely low abundances of DCO+ and N2D+ already before 105 yr of chemical evolution. Deuterium fractionation is very strong at this density, and becomes the most abundant isotopolog, an effect previously seen in some gas-phase chemical models (Walmsley et al. 2004; Flower et al. 2004; Pagani et al. 2009; Sipilä et al. 2010). Notably, the deuterium fraction in ammonia is much larger than has been observed toward starless/prestellar cores. This issue is discussed in more detail in Sect. 4.3. The high deuterium fractionation in the gas is also reflected in the ice, where non-negligible abundances of doubly-deuterated ammonia and methane are found at long timescales. Notably, HDO ice is not very abundant in the multilayer model because of the adopted binding energy of 1390 K for atomic oxygen (Bergeron et al. 2008; Cazaux et al. 2011; Sipilä 2012)2, which makes it more difficult to remove atomic O from the mantle through mantle desorption once it is transferred there3. Indeed, for an O binding energy of 800 K a lot more HDO ice is formed; we discuss models with a lower oxygen binding energy in Appendix A.
Turning then to the bulk model, it can be seen that the abundances of the isotopologs begin to decrease at around 106 yr owing to HD depletion and never becomes the main deuterated ion, although its peak abundance is comparable to those of H2D+ and D2H+. In contrast to the multilayer model, N2D+ and DCO+ abundances peak at later times because of the slower formation of the deuterated isotopologs, and appreciable abundances of N2D+ and DCO+ are retained in the gas even after the deuterium peak. The main deuterium carrier on the surface is HDO (in line with the results of Sipilä et al. 2013), and the deuterium fraction in gas-phase ammonia is lower than in the multilayer model.
The high gas-phase O2 abundance seen around t ~ 105 yr at nH = 105 cm-3 in the multilayer model is, somewhat counterintuitively, caused by mantle trapping. In the present model, the binding energy of atomic oxygen is larger than those of N and C (800 K). Mantle trapping effectively decreases the depletion timescale compared to that of the bulk model, and the effect is greater for N and C than for O because of their lower binding energies (O is trapped relatively efficiently on the surface even in the bulk model). The faster depletion of N helps OH to form O2 through O + OH− → O2 + H in the gas phase instead of reacting with N to form NO + H, which is the main destruction pathway of OH at t ~ 105 yr in the bulk model. Desorption of O2 from the mantle also contributes to the gas-phase O2 abundance in the multilayer model. However, it is not the sole reason for the high gas-phase O2 abundance as evidenced by the high abundance also found in a model excluding mantle desorption (Sect. 4.1; Fig. 7). The general impact of mantle desorption is discussed further in Sect. 4.1 where we show the results of calculations that exclude this process. Finally, we note that the peak O2 abundance predicted by the multilayer model is about a factor of 10–100 higher than has been deduced from observations (SWAS, Odin, Herschel) toward low-temperature objects in the ISM (Goldsmith et al. 2000; Pagani et al. 2003; Larsson et al. 2007; Liseau et al. 2012; Yıldız et al. 2013). In light of the observations the bulk model seems to give more reasonable results, which is also the case for the various deuterated species shown in Fig. 1. We return to this issue in Sect. 4.3.
3.1.2. Variable temperature
Figure 2 shows the abundances of selected species as functions of temperature at nH = 105 cm-3 using different ice models. The same trends that were apparent at 10 K in Fig. 1 are present at different temperatures as well. On the one hand, multilayer chemistry enhances the abundances of deuterated at late times, while on the other hand the abundances of species that contain heavier elements are lower than in the bulk model. However, the two models predict very similar abundances up to t = 105 yr. The general deuteration efficiency increases with temperature, peaking at around 15–18 K depending on the species. A similar trend was found in Sipilä et al. (2015b), although in that paper a sparser temperature grid was used. Deuterated ammonia depletes very efficiently at 20 K on the one hand because of the destruction of the isotopologs caused by the temperature, and on the other hand because of the depletion of ammonia (see Sipilä et al. 2015a).
Figure 3 shows the results of calculations otherwise similar to Fig. 2, but adopting nH = 106 cm-3. Here, the effect of the temperature is more prominent. The multilayer model predicts abundances that are much higher than in the bulk model for the isotopologs below 12 K, but the results of the two models are similar at higher temperatures. Notably, the abundance of is always higher in the multilayer model. At short timescales, DCO+, N2D+, and deuterated ammonia are generally more abundant in the multilayer model than in the bulk model at T< 12 K (see also Fig. 1), while the inverse is true at higher temperatures. At late times, however, the multilayer model presents much lower abundances for these species in the entire temperature range.
3.2. Core models
To investigate the effect of multilayer chemistry on chemical abundance profiles in starless core conditions, we calculated radial profiles for the abundances of various species using a modified Bonnor-Ebert sphere (Evans et al. 2001; Keto & Field 2005; Sipilä et al. 2011, 2015c) as the core model. For this study, we chose a model core with a high non-dimensional radius (ξ = 16) in order to get a density gradient of about two orders of magnitude across the core, and we note that this configuration is highly supercritical and thus unstable against gravitational contraction (Sipilä et al. 2015c). We assumed M = 1 M⊙ for the core mass and AV = 2 mag for the external visual extinction.
Following the approach discussed in our previous papers (see, e.g., Sipilä et al. 2015b), we divided the core model into spherical shells and calculated the chemical evolution separately in each shell. The initial chemical abundances given in Table 1 are the same in each shell. The gas temperature is expected to change as a function of time because the depletion of the coolant species (mainly CO) decreases the cooling rates at low densities (up to a few ×104 cm-3) where the gas and dust are not efficiently coupled (Goldsmith 2001; Juvela & Ysard 2011), and so cores at various stages of development should display different gas temperature profiles. We modeled this effect by extracting the abundances of various cooling species from the initial core model (which assumes Tdust = Tgas) at two timesteps, t = 1 × 10⁵ yr and t = 5 × 10⁶ yr, and using the profiles to calculate the gas temperature (see, e.g., Sipilä 2012 for a detailed explanation of this process). Figure 4 presents the resulting density and temperature structures. In what follows, we label the density and temperature structures corresponding to t = 1 × 10⁵ yr and t = 5 × 10⁶ yr as DT1 and DT2, respectively.
As discussed in Sipilä et al. (2015c), these results do not necessarily represent the development of a core from one evolutionary state to the next, but show two possible structures for an M = 1 M⊙, ξ = 16 core in environments with different chemical ages. Also, comparison with Fig. 3 in Sipilä et al. (2015c) shows that the gas temperature profiles calculated in this paper are lower for the chemically younger core. The main reason for this is that in the present paper we do not include quantum tunneling through activation barriers in grain-surface reactions, which helps to maintain a higher CO abundance in the ice – and in the gas phase through desorption – and hence more efficient gas cooling than in the Sipilä et al. (2015c) paper, where the chemical model of Sipilä et al. (2013) was adopted.
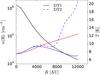 |
Fig. 4 Density (black), dust temperature (red), and gas temperature (blue) profiles of the core models DT1 (solid lines) and DT2 (dashed lines). |
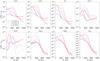 |
Fig. 5 Abundances of various deuterated species as functions of radial distance from the core center at different times (indicated in the top left panel). The adopted core model is DT1. The blue lines represent the bulk ice model, while the red lines represent the multilayer ice model. |
Figure 5 presents the abundance profiles for a variety of deuterated species at different times in bulk and multilayer models, using the DT1 core (assumed to remain static during the chemical evolution). As expected, the abundances of all of the plotted species are lower near the core edge, where the density is low, than in the high-density environment at the core center. The abundance curves present the same trends already seen in Figs. 1 to 3: in the multilayer model, deuteration is enhanced at high density and for deuterated ammonia, the difference between the bulk and multilayer models decreases with the number of D atoms in ammonia. Very low levels of N2D+ and DCO+ are found in the multilayer model at long timescales, but up to t ~ 105 yr the abundance profiles predicted by the two models are similar to each other. According to the multilayer model, already becomes the most abundant deuterated ion in the core center very early in the chemical evolution.
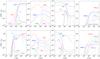 |
Fig. 7 Similar to Fig. 1, but dashed lines correspond to the multilayer ice model, while dotted lines correspond to the multilayer ice model without mantle desorption. |
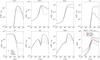 |
Fig. 8 Abundances of selected species as functions of time at nH = 105 cm-3 and Tdust = Tgas = 10 K in models assuming one or several chemically active ice surface layers (see bottom left panel and the main text for details). Also plotted are the abundance ratios of the various ammonia isotopologs as functions of time (bottom right panel). |
Figure 6 shows the results of calculations otherwise similar to those presented in Fig. 5, but using the DT2 core model. Naturally, no difference is seen between the DT1 and DT2 cases in the innermost parts of the core owing to the equality of the density and temperature profiles (Fig. 4). Near the core edge, the abundances of N2D+ and DCO+ (and ammonia) are higher than in the DT1 model because of a lower electron abundance and because dissociative recombination reactions with electrons are less efficient at higher temperature; however, very low abundances are still found for these species throughout the core. We note that observationally distinguishing between the DT1 and DT2 structures using species like deuterated and ammonia, which are prominent only in the inner areas, would probably be impossible.
4. Discussion
4.1. Multilayer ice model without mantle desorption
As noted in Sect. 2.1, the original Hasegawa & Herbst (1993b) multilayer ice model does not include desorption from the mantle, while our model does. Even though we limit the mantle desorption to only one ML, it is reasonable to assume that its effect can be non-negligible at least for species that have moderate mantle abundances but relatively low binding energies (e.g., N2).
Figure 7 presents the results of calculations otherwise identical to those shown in Fig. 1, but neglecting mantle desorption, i.e., assuming that the three desorption processes considered here only apply to the surface layer. Evidently, the exclusion of mantle desorption can have a large impact on the abundances at late times. At nH = 105 cm-3, ammonia and N2H+, and their deuterated forms, suffer particularly from the exclusion of mantle desorption because of efficient trapping of atomic nitrogen into the mantle, preventing the formation of N2 in the gas. A similar effect is not seen for CO because most of the carbon is locked in CO already at short timescales. It is also evident that HD depletion is less efficient with the exclusion of the mantle desorption, which translates to decreased abundances of the various deuterated species in the ice, and an enhancement of deuterated , for example. This effect is even more prominent at nH = 106 cm-3. Indeed, at high density and without mantle desorption, the deuterium chemistry resembles the complete depletion scenario studied by Walmsley et al. (2004) and Flower et al. (2004).
4.2. Multilayer ice model with multiple reactive layers
It has been shown that H atoms can penetrate into, and react in, several MLs beneath the ice surface (Ioppolo et al. 2010), which suggests that reactivity beneath the surface layer should not be neglected. Also, Vasyunin & Herbst (2013) were able to fit the abundances of some complex organics using a Monte Carlo model with four active surface layers. Motivated by these studies, we considered extensions of the Hasegawa & Herbst (1993b) model where multiple surface layers are chemically active, meaning that all the material in these layers is available for reactions, adsorption, and desorption. This is achieved by dividing the surface coverage factor α (Eq. (4) in Hasegawa & Herbst 1993b) by the desired number n of active MLs, which is equivalent to assuming that the surface layer has n × Ns binding sites (i.e., n−1 virtual layers), where Ns is the number of binding sites in one ML. The total amount of surface+mantle MLs in the modified multilayer model should of course be nearly identical to a bulk model run in identical physical conditions regardless of the choice of n4, and we have verified through testing that this is the case.
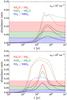 |
Fig. 9 Abundance ratios of the ammonia isotopologs as functions of time at two different densities. Solid lines correspond to the bulk ice model, while dashed lines correspond to the multilayer ice model. For reference, the shaded areas show the observed ammonia isotopolog ratios, including errors, toward LDN 134N given in Table 8 of Roueff et al. (2005). For ND3/ NHD2, the shaded area represents an upper limit of 0.032. |
Figure 8 shows the abundances of selected species as functions of time at constant density and temperature in the bulk model (solid lines), the standard multilayer model described earlier in this paper (dashed lines), and two additional models with either five or ten active surface layers (dash-dotted and dotted lines, respectively). Increasing the number of active layers brings the N2D+ and DCO+ abundances closer to the bulk model because their precursors are less depleted. However, the CO abundance is low at long timescales even when ten MLs are chemically active, and consequently the deuteration degree is still high in this model. The ammonia deuteration degree also reaches high values (see Sect. 4.3 for further discussion of this issue). Another test at nH = 106 cm-3 revealed that in these conditions, depletion of CO and N2 is so strong even with ten active layers that the N2D+ and DCO+ cannot reach the bulk model values, and the general conclusions for the deuterium fractions in and ammonia remain similar to those seen in the lower-density test. The observational implications of the results presented here and in the preceding section are discussed below.
Finally, we note that we cannot recover the exact chemical composition of the bulk model with the modified multilayer model even if we set n equal to the amount of MLs in the bulk model. If there are several tens of active MLs and thus a large amount of accreting material in the surface layer, mantle transfer becomes efficient before the virtual surface coverage reaches a value of unity. If n ~ 100, the ice morphology reaches a solution on long timescales where ~2/3 of the material is in the surface layer and ~1/3 is in the mantle. Therefore, the method of increasing the number of active MLs discussed here is only reasonable for low values of n.
4.3. Observational implications of multilayer ice chemistry
Observations toward starless/prestellar cores have yielded abundances on the order of 10-11−10-10 for N2D+ (Crapsi et al. 2005; Vastel et al. 2006; Miettinen & Offner 2013) and DCO+ (Tafalla et al. 2006; Schnee et al. 2007). Abundances of these orders of magnitude can be relatively easily reproduced by the bulk ice model. However, according to our results, the multilayer ice model cannot reproduce the observed abundances for N2D+, and for DCO+ high enough abundances are only predicted for early times.
Another constraint on the applicability of the models is given by the deuterium fraction in ammonia, for which the observed fractionation ratios are on the order of ~0.1 for NH2D/NH3 and NHD2/ NH2D, and ~0.01 for ND3/ NHD2 (Roueff et al. 2005; Gerin et al. 2006). In Fig. 9, these abundance ratios are shown in the bulk and multilayer models as functions of time at two different densities. Also shown for reference are the observed values toward LDN 134N from Roueff et al. (2005). Evidently, the multilayer model produces abundance ratios that are higher than the observed values. We also find that the multilayer model produces a significant enhancement of the NHD/NH2 and ND2/ NHD ratios (not shown), with multilayer/bulk model peak values of 0.30/0.19 and 0.23/0.12 at nH = 106 cm-3 for NHD/NH2 and ND2/ NHD, respectively. Even if we account for the fact that observations represent averages over the line of sight, it seems clear that reconciling the multilayer model with observations would be problematic. Temperature effects should not play a large role here, given the similar behavior of the ammonia isotopologs as functions of temperature (Figs. 2 and 3). We note, however, that definitive conclusions should not be made without proper core modeling, as evidenced by the higher degree of ammonia fractionation observed toward Barnard 1 for example (Roueff et al. 2005; Table 8).
The multilayer model predicts enhanced deuteration of . However, the difference in H2D+ and D2H+ abundances between the bulk and multilayer models is typically only a factor of a few, as opposed to an order of magnitude as found for N2D+ and DCO+. This suggests that the bulk vs. multilayer scenario could be tested by observing, for example, the abundance ratio of H2D+ to N2D+ toward starless cores. According to our results, the ratio is expected to be higher than 100 in the multilayer model, and a few × 10 in the bulk model. For reference, the H2D+/N2D+ column density ratio derived from observations is ~10 (Caselli et al. 2002, 2003, 2008; Crapsi et al. 2005). N2D+ seems a better candidate than DCO+ for comparing the bulk and multilayer approaches, because the abundance of the latter depends strongly on time (Figs. 5 and 6). Another observational signal of the presence of multilayer chemistry would be a confirmed detection of the dominance of over H2D+ and D2H+ toward the central parts of starless cores. Unfortunately, observations of are not easy because of the lack of permanent dipole moment which means that only vibrational transitions can be observed (in absorption), as is discussed in Sect. 4 of Flower et al. (2004; see also their Table 3).
In summary, the results presented here imply that the multilayer model is in conflict with observations of deuterated molecules toward starless/prestellar cores, while the bulk model can be more easily reconciled with observations. As the exclusion of mantle desorption was found to lead to even more extreme results in terms of gas-phase deuteration and depletion of heavy neutrals than the two-layer mechanism discussed elsewhere in this paper, it seems that more efficient desorption than what is included in the multilayer model discussed here is needed to explain observations of deuterated gas-phase species. On the other hand, allowing for more active MLs on the surface, which naturally leads to more efficient desorption, did not yield a significant improvement in terms of explaining the discrepancy between observations and the multilayer models.
Here we did not include the chemical desorption process in which exothermic reactions on the surface may lead to desorption of the reaction product. It is typically assumed in chemical models that the desorption efficiency, i.e., the percentage of molecules desorbed per reaction event, is around 1% (Garrod et al. 2007), although recent work by Minissale et al. (2016) shows that the desorption efficiency may be as high as several tens of percent for some reactions. Adopting this process in the present model is not likely to influence our main conclusions, at least as long as the desorption is limited to the surface layer only.
Finally, the present model is missing reactions between mantle species, but it is unclear how efficient mantle reactions – which are limited by the diffusion of the various species – are compared to surface reactions, and we are still left with the problem of releasing the mantle species into the gas phase. The effect of alternative non-thermal desorption mechanisms, such as chemical explosions due to cosmic rays (Ivlev et al. 2015), on the gas-phase chemistry should be investigated.
4.4. Comparison to Taquet et al. (2014)
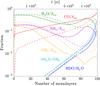 |
Fig. 10 Various fractions (see text) on the grain surface calculated with the present chemical model (solid lines) and the Taquet et al. (2014) chemical model (dashed lines) as functions of the amount of MLs on the surface. The adopted physical parameters are nH = 105 cm-3, Tdust = Tgas = 10 K, AV = 10 mag. The time required to form each amount of the MLs is indicated on the top axis. |
Recently, Taquet et al. (2014) investigated deuterium chemistry in prestellar and protostellar cores using a multilayer chemical model combined with a description of core collapse. Since we use the same model for multilayer chemistry as they do (Hasegawa & Herbst 1993b), it is instructive to compare our results with theirs.
We show in Fig. 10 the fractional abundances (with respect to the total number density of material on the surface of a grain, represented by Stot in the figure) of four ice species, and two deuterium fractionation ratios as functions of the amount of MLs on the surface. The plotted curves represent abundances in the reactive surface layer, so that the various fractions represent the composition of the top layer of the ice at the time of its formation. Solid lines correspond to the present model, while dashed lines represent calculations carried out with the GRAINOBLE model from Taquet et al. (2014; see also Taquet et al. 2012, 2013) using identical physical parameters and initial chemical abundances, and excluding tunneling. The agreement is good, although differences exist between the models, as is discussed in Sect. 2.2. At late times in particular the composition of the surface is almost the same in the two models. Notably, the deuterium fraction in water and ammonia is very similar in the two models throughout the calculation.
Taquet et al. (2014) considered quantum tunneling through activation barriers in surface reactions. Comparing our Fig. 10 with Figs. 4 and 5 in Taquet et al. (2014) shows that we generally obtain similar ice abundances even though tunneling is not included in the present calculations. The present model does not produce appreciable abundances for species whose formation proceeds through reactions with activation barriers, such as methanol. Still, given the similarity of the modeling results, we qualitatively do not expect the inclusion of tunneling to affect the gas-phase deuteration much since most of the surface deuterium should be locked in deuterated water and ammonia even with tunneling included (Taquet et al. 2014). We have verified with test calculations, using both the bulk and multilayer ice models, that the abundances of deuterated gas-phase species remain almost the same even if tunneling is included in the present model.
Finally, we note that the sharp feature seen in the fraction of methane at around 85 MLs (corresponding to a timescale of ~105 yr in this model) is due to a sudden drop in atomic C on the surface, and we verified through testing that the sharpness is smoothed if the time resolution (i.e., the number of timesteps considered) in the model is increased.
5. Conclusions
We investigated the abundances of deuterated gas-phase species with a chemical model that includes multilayer ice chemistry adapted from Hasegawa & Herbst (1993b). We included desorption from the ice surface layer and from one monolayer in the mantle. Variations in the density and temperature of the environment were considered, and radial abundance profiles were derived for a core model (a modified Bonnor-Ebert sphere). We compared our results to a more conventional bulk ice approach in which the entirety of the ice (surface+mantle) is available for chemical reactions and desorption, with the aim of studying whether the multilayer model can reproduce the observed abundances of various gas-phase deuterated species as well as the bulk model does.
Our results show that the multilayer model produces very low abundances of N2D+ and DCO+ on timescales corresponding to starless core lifetimes. The DCO+ abundance can be reconciled with observations in some conditions, but typically only for a very narrow time interval before or after ~105 yr depending on the density. The N2D+ abundance is always lower than the observed values. On the other hand, the modeled deuterium fraction in ammonia is much higher than the observed value. In the absence of mantle desorption, the discrepancy between the models and the observed abundances can be even greater, suggesting that desorption from multiple layers in the ice is needed to maintain appreciable abundances of N2D+ and DCO+ in the gas phase, although tests with an alternative model allowing for multiple chemically active monolayers on the surface did not yield a significant improvement compared to the standard model where only the top layer is active.
Observations can be more easily reconciled with the bulk ice model. This result is qualitatively puzzling since we expect the ices on grain surfaces to be amorphous layered structures and it should in principle be challenging to remove material from beneath the few layers closest to the surface, as shown by photodesorption experiments. It is clear that more theoretical and experimental work is needed to learn more about the composition and morphology of interstellar ices, and about the gas-grain chemical interaction, in particular desorption processes. According to our results, the H2D+ to N2D+ abundance ratio is higher than 100 in the multilayer model in conditions corresponding to the centers of starless cores, while in the bulk model the ratio is only a few ×10, which is close to the observed values. Another clear distinguishing feature of the multilayer model is the abundance of , which becomes the main deuterated ion at high density regardless of the temperatures considered here (6 to 20 K). A measurement of the abundance of compared to H2D+ and D2H+ in such environments, perhaps possible through absorption spectroscopy (Flower et al. 2004), would also help in constraining the models.
A detailed treatment of direct cosmic-ray impacts on icy mantles is beyond the scope of this paper, but is being investigated by Vasyunin et al. following Ivlev et al. (2015).
He et al. (2015) have recently presented even higher values for the O binding energy (1660 ± 60 K on porous water ice).
Acknowledgments
We thank the anonymous referee for helpful comments and suggestions that improved the paper. O.S., P.C., and V.T. acknowledge the financial support of the European Research Council (ERC; project PALs 320620 for O.S. and P.C. and project CHEMPLAN 291141 for V.T.).
References
- Aikawa, Y., Wakelam, V., Hersant, F., Garrod, R. T., & Herbst, E. 2012, ApJ, 760, 40 [NASA ADS] [CrossRef] [Google Scholar]
- Andersson, S., & van Dishoeck, E. F. 2008, A&A, 491, 907 [NASA ADS] [CrossRef] [EDP Sciences] [Google Scholar]
- Arasa, C., Andersson, S., Cuppen, H. M., van Dishoeck, E. F., & Kroes, G.-J. 2010, J. Chem. Phys., 132, [Google Scholar]
- Arasa, C., Koning, J., Kroes, G.-J., Walsh, C., & van Dishoeck, E. F. 2015, A&A, 575, A121 [NASA ADS] [CrossRef] [EDP Sciences] [Google Scholar]
- Bergeron, H., Rougeau, N., Sidis, V., et al. 2008, J. Phys. Chem. A, 112, 11921 [CrossRef] [PubMed] [Google Scholar]
- Bergman, P., Parise, B., Liseau, R., & Larsson, B. 2011, A&A, 527, A39 [NASA ADS] [CrossRef] [EDP Sciences] [Google Scholar]
- Caselli, P., Walmsley, C. M., Zucconi, A., et al. 2002, ApJ, 565, 344 [NASA ADS] [CrossRef] [Google Scholar]
- Caselli, P., van der Tak, F. F. S., Ceccarelli, C., & Bacmann, A. 2003, A&A, 403, L37 [NASA ADS] [CrossRef] [EDP Sciences] [Google Scholar]
- Caselli, P., Vastel, C., Ceccarelli, C., et al. 2008, A&A, 492, 703 [NASA ADS] [CrossRef] [EDP Sciences] [Google Scholar]
- Cazaux, S., Caselli, P., & Spaans, M. 2011, ApJ, 741, L34 [NASA ADS] [CrossRef] [Google Scholar]
- Charnley, S. B., & Rodgers, S. B. 2009, in Bioastronomy 2007: Molecules, Microbes and Extraterrestrial Life, eds. K. J. Meech, J. V. Keane, M. J. Mumma, J. L. Siefert, & D. J. Werthimer, ASP Conf. Ser., 420, 29 [Google Scholar]
- Coutens, A., Vastel, C., Hincelin, U., et al. 2014, MNRAS, 445, 1299 [NASA ADS] [CrossRef] [Google Scholar]
- Crapsi, A., Caselli, P., Walmsley, C. M., et al. 2005, ApJ, 619, 379 [Google Scholar]
- Evans, II, N. J., Rawlings, J. M. C., Shirley, Y. L., & Mundy, L. G. 2001, ApJ, 557, 193 [NASA ADS] [CrossRef] [Google Scholar]
- Flower, D. R., Pineau des Forêts, G., & Walmsley, C. M. 2004, A&A, 427, 887 [NASA ADS] [CrossRef] [EDP Sciences] [Google Scholar]
- Garrod, R. T., & Pauly, T. 2011, ApJ, 735, 15 [NASA ADS] [CrossRef] [Google Scholar]
- Garrod, R. T., Wakelam, V., & Herbst, E. 2007, A&A, 467, 1103 [NASA ADS] [CrossRef] [EDP Sciences] [Google Scholar]
- Gerin, M., Lis, D. C., Philipp, S., et al. 2006, A&A, 454, L63 [NASA ADS] [CrossRef] [EDP Sciences] [Google Scholar]
- Goldsmith, P. F. 2001, ApJ, 557, 736 [NASA ADS] [CrossRef] [MathSciNet] [Google Scholar]
- Goldsmith, P. F., Melnick, G. J., Bergin, E. A., et al. 2000, ApJ, 539, L123 [NASA ADS] [CrossRef] [Google Scholar]
- Hama, T., & Watanabe, N. 2013, Chem. Rev., 113, 8783 [CrossRef] [Google Scholar]
- Hasegawa, T. I., & Herbst, E. 1993a, MNRAS, 261, 83 [NASA ADS] [CrossRef] [Google Scholar]
- Hasegawa, T. I., & Herbst, E. 1993b, MNRAS, 263, 589 [NASA ADS] [CrossRef] [Google Scholar]
- He, J., Shi, J., Hopkins, T., Vidali, G., & Kaufman, M. J. 2015, ApJ, 801, 120 [NASA ADS] [CrossRef] [Google Scholar]
- Hincelin, U., Chang, Q., & Herbst, E. 2015, A&A, 574, A24 [NASA ADS] [CrossRef] [EDP Sciences] [Google Scholar]
- Hollenbach, D., Kaufman, M. J., Bergin, E. A., & Melnick, G. J. 2009, ApJ, 690, 1497 [CrossRef] [Google Scholar]
- Hugo, E., Asvany, O., & Schlemmer, S. 2009, J. Chem. Phys., 130, 164302 [NASA ADS] [CrossRef] [PubMed] [Google Scholar]
- Ioppolo, S., Cuppen, H. M., Romanzin, C., van Dishoeck, E. F., & Linnartz, H. 2010, Phys. Chem. Chem. Phys., 12, 12065 [NASA ADS] [CrossRef] [Google Scholar]
- Ivlev, A. V., Röcker, T. B., Vasyunin, A., & Caselli, P. 2015, ApJ, 805, 59 [NASA ADS] [CrossRef] [Google Scholar]
- Juvela, M., & Ysard, N. 2011, ApJ, 739, 63 [NASA ADS] [CrossRef] [Google Scholar]
- Keto, E., & Field, G. 2005, ApJ, 635, 1151 [NASA ADS] [CrossRef] [Google Scholar]
- Larsson, B., Liseau, R., Pagani, L., et al. 2007, A&A, 466, 999 [Google Scholar]
- Linsky, J. L. 2003, Space Sci. Rev., 106, 49 [NASA ADS] [CrossRef] [Google Scholar]
- Liseau, R., Goldsmith, P. F., Larsson, B., et al. 2012, A&A, 541, A73 [NASA ADS] [CrossRef] [EDP Sciences] [Google Scholar]
- Miettinen, O., & Offner, S. S. R. 2013, A&A, 555, A41 [NASA ADS] [CrossRef] [EDP Sciences] [Google Scholar]
- Minissale, M., Dulieu, F., Cazaux, S., & Hocuk, S. 2016, A&A, 585, A24 [NASA ADS] [CrossRef] [EDP Sciences] [Google Scholar]
- Öberg, K. I., Linnartz, H., Visser, R., & van Dishoeck, E. F. 2009a, ApJ, 693, 1209 [NASA ADS] [CrossRef] [Google Scholar]
- Öberg, K. I., van Dishoeck, E. F., & Linnartz, H. 2009b, A&A, 496, 281 [NASA ADS] [CrossRef] [EDP Sciences] [Google Scholar]
- Pagani, L., Olofsson, A. O. H., Bergman, P., et al. 2003, A&A, 402, L77 [NASA ADS] [CrossRef] [EDP Sciences] [Google Scholar]
- Pagani, L., Vastel, C., Hugo, E., et al. 2009, A&A, 494, 623 [NASA ADS] [CrossRef] [EDP Sciences] [Google Scholar]
- Parise, B., Castets, A., Herbst, E., et al. 2004, A&A, 416, 159 [NASA ADS] [CrossRef] [EDP Sciences] [Google Scholar]
- Prasad, S. S., & Tarafdar, S. P. 1983, ApJ, 267, 603 [NASA ADS] [CrossRef] [Google Scholar]
- Roberts, H., Herbst, E., & Millar, T. J. 2003, ApJ, 591, L41 [NASA ADS] [CrossRef] [Google Scholar]
- Rodgers, S. D., & Charnley, S. B. 2001, ApJ, 553, 613 [NASA ADS] [CrossRef] [EDP Sciences] [Google Scholar]
- Roueff, E., Lis, D. C., van der Tak, F. F. S., Gerin, M., & Goldsmith, P. F. 2005, A&A, 438, 585 [NASA ADS] [CrossRef] [EDP Sciences] [Google Scholar]
- Schnee, S., Caselli, P., Goodman, A., et al. 2007, ApJ, 671, 1839 [NASA ADS] [CrossRef] [Google Scholar]
- Semenov, D., Hersant, F., Wakelam, V., et al. 2010, A&A, 522, A42 [NASA ADS] [CrossRef] [EDP Sciences] [Google Scholar]
- Shen, C. J., Greenberg, J. M., Schutte, W. A., & van Dishoeck, E. F. 2004, A&A, 415, 203 [NASA ADS] [CrossRef] [EDP Sciences] [Google Scholar]
- Sipilä, O. 2012, A&A, 543, A38 [NASA ADS] [CrossRef] [EDP Sciences] [Google Scholar]
- Sipilä, O., Hugo, E., Harju, J., et al. 2010, A&A, 509, A98 [NASA ADS] [CrossRef] [EDP Sciences] [Google Scholar]
- Sipilä, O., Harju, J., & Juvela, M. 2011, A&A, 535, A49 [NASA ADS] [CrossRef] [EDP Sciences] [Google Scholar]
- Sipilä, O., Caselli, P., & Harju, J. 2013, A&A, 554, A92 [NASA ADS] [CrossRef] [EDP Sciences] [Google Scholar]
- Sipilä, O., Caselli, P., & Harju, J. 2015a, A&A, 578, A55 [NASA ADS] [CrossRef] [EDP Sciences] [Google Scholar]
- Sipilä, O., Harju, J., Caselli, P., & Schlemmer, S. 2015b, A&A, 581, A122 [NASA ADS] [CrossRef] [EDP Sciences] [Google Scholar]
- Sipilä, O., Harju, J., & Juvela, M. 2015c, A&A, 582, A48 [NASA ADS] [CrossRef] [EDP Sciences] [Google Scholar]
- Tafalla, M., Santiago-García, J., Myers, P. C., et al. 2006, A&A, 455, 577 [NASA ADS] [CrossRef] [EDP Sciences] [Google Scholar]
- Taquet, V., Ceccarelli, C., & Kahane, C. 2012, A&A, 538, A42 [NASA ADS] [CrossRef] [EDP Sciences] [Google Scholar]
- Taquet, V., Peters, P. S., Kahane, C., et al. 2013, A&A, 550, A127 [NASA ADS] [CrossRef] [EDP Sciences] [Google Scholar]
- Taquet, V., Charnley, S. B., & Sipilä, O. 2014, ApJ, 791, 1 [NASA ADS] [CrossRef] [Google Scholar]
- van Hemert, M. C., Takahashi, J., & van Dishoeck, E. F. 2015, J. Phys. Chem. A, 119, 6354 [CrossRef] [Google Scholar]
- Vastel, C., Caselli, P., Ceccarelli, C., et al. 2006, ApJ, 645, 1198 [NASA ADS] [CrossRef] [Google Scholar]
- Vasyunin, A. I., & Herbst, E. 2013, ApJ, 762, 86 [NASA ADS] [CrossRef] [Google Scholar]
- Walmsley, C. M., Flower, D. R., & Pineau des Forêts, G. 2004, A&A, 418, 1035 [NASA ADS] [CrossRef] [EDP Sciences] [Google Scholar]
- Watanabe, N., Shiraki, T., & Kouchi, A. 2003, ApJ, 588, L121 [NASA ADS] [CrossRef] [Google Scholar]
- Watanabe, N., Nagaoka, A., Shiraki, T., & Kouchi, A. 2004, ApJ, 616, 638 [NASA ADS] [CrossRef] [Google Scholar]
- Yıldız, U. A., Acharyya, K., Goldsmith, P. F., et al. 2013, A&A, 558, A58 [NASA ADS] [CrossRef] [EDP Sciences] [Google Scholar]
Appendix A: Models with lower oxygen binding energy
In the results presented in this paper, we adopted an oxygen binding energy of 1390 K. However, the value that is adopted most often is Eb(O) = 800 K. For reference, we plot in Fig. A.1 the results of calculations otherwise identical to those shown in Fig. 1, but assuming Eb(O) = 800 K.
At nH = 105 cm-3, the abundances of the deuterated species in the gas phase are similar to those presented in Fig. 1 in both the bulk and the multilayer model. The composition of the ice is more sensitive to the assumed oxygen binding energy, although not by much in the bulk model where the oxygen is free to react with the entirety of the ice. In the multilayer model, decreasing
the oxygen binding energy to Eb(O) = 800 K produces much more surface HDO, which becomes the main deuterium carrier in the ice. Notably, O2 is very abundant after ~105 yr in both the bulk and multilayer models, caused by the efficient formation of O2 through O + OH− → O2 + H5. As noted in Sect. 3.1.1, such a high gas-phase O2 abundance is in stark contrast to observations.
At nH = 106 cm-3 in the multilayer model, deuterium is trapped efficiently into HDO ice, and the overall degree of deuteration in the ice is higher than in the Eb(O) = 1390 K case. As a consequence, HD depletes very efficiently from the gas phase, leading to lower abundances of deuterated gas-phase species than in the models with Eb(O) = 1390 K. However, despite the low abundances, the deuteration degree in ammonia is still very high.
All Tables
Adopted values for the various physical parameters (left column) and adopted initial abundances (right column).
All Figures
|
Fig. 1 Fractional abundances (with respect to nH) of selected gas-phase and ice species (labeled in the plots) as functions of time in a homogeneous model with Tgas = Tdust = 10 K. For those species that have spin states, the plotted abundances represent sums over the spin states. Solid lines correspond to the bulk ice model, while dashed lines correspond to the multilayer ice model. In the latter case, the ice abundances (right-hand panels) represent sums over the surface and mantle. Upper row: nH = 105 cm-3. Lower row: nH = 106 cm-3. |
| In the text | |
|
Fig. 2 Abundances of various deuterated species as functions of temperature (Tgas = Tdust) at different times (indicated in the figure). The adopted medium density is nH = 105 cm-3. The blue lines represent the bulk ice model, while the red lines represent the multilayer ice model. |
| In the text | |
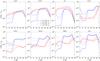 |
Fig. 3 As for Fig. 2, but for nH = 106 cm-3. |
| In the text | |
|
Fig. 4 Density (black), dust temperature (red), and gas temperature (blue) profiles of the core models DT1 (solid lines) and DT2 (dashed lines). |
| In the text | |
|
Fig. 5 Abundances of various deuterated species as functions of radial distance from the core center at different times (indicated in the top left panel). The adopted core model is DT1. The blue lines represent the bulk ice model, while the red lines represent the multilayer ice model. |
| In the text | |
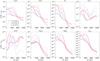 |
Fig. 6 As for Fig. 5, but adopting the core model DT2. |
| In the text | |
|
Fig. 7 Similar to Fig. 1, but dashed lines correspond to the multilayer ice model, while dotted lines correspond to the multilayer ice model without mantle desorption. |
| In the text | |
|
Fig. 8 Abundances of selected species as functions of time at nH = 105 cm-3 and Tdust = Tgas = 10 K in models assuming one or several chemically active ice surface layers (see bottom left panel and the main text for details). Also plotted are the abundance ratios of the various ammonia isotopologs as functions of time (bottom right panel). |
| In the text | |
|
Fig. 9 Abundance ratios of the ammonia isotopologs as functions of time at two different densities. Solid lines correspond to the bulk ice model, while dashed lines correspond to the multilayer ice model. For reference, the shaded areas show the observed ammonia isotopolog ratios, including errors, toward LDN 134N given in Table 8 of Roueff et al. (2005). For ND3/ NHD2, the shaded area represents an upper limit of 0.032. |
| In the text | |
|
Fig. 10 Various fractions (see text) on the grain surface calculated with the present chemical model (solid lines) and the Taquet et al. (2014) chemical model (dashed lines) as functions of the amount of MLs on the surface. The adopted physical parameters are nH = 105 cm-3, Tdust = Tgas = 10 K, AV = 10 mag. The time required to form each amount of the MLs is indicated on the top axis. |
| In the text | |
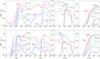 |
Fig. A.1 As for Fig. 1, but calculated assuming oxygen binding energy Eb(O) = 800 K. |
| In the text | |
Current usage metrics show cumulative count of Article Views (full-text article views including HTML views, PDF and ePub downloads, according to the available data) and Abstracts Views on Vision4Press platform.
Data correspond to usage on the plateform after 2015. The current usage metrics is available 48-96 hours after online publication and is updated daily on week days.
Initial download of the metrics may take a while.