Fig. 8
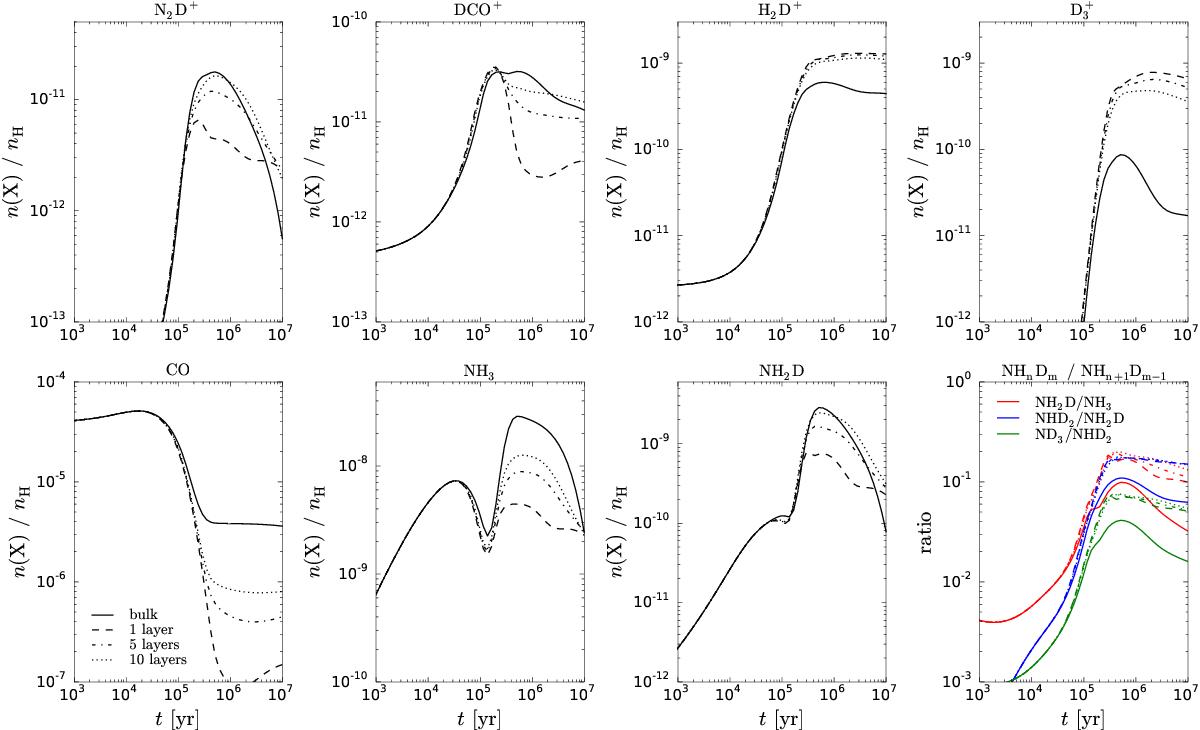
Abundances of selected species as functions of time at nH = 105 cm-3 and Tdust = Tgas = 10 K in models assuming one or several chemically active ice surface layers (see bottom left panel and the main text for details). Also plotted are the abundance ratios of the various ammonia isotopologs as functions of time (bottom right panel).
Current usage metrics show cumulative count of Article Views (full-text article views including HTML views, PDF and ePub downloads, according to the available data) and Abstracts Views on Vision4Press platform.
Data correspond to usage on the plateform after 2015. The current usage metrics is available 48-96 hours after online publication and is updated daily on week days.
Initial download of the metrics may take a while.