Free Access
Fig. 2
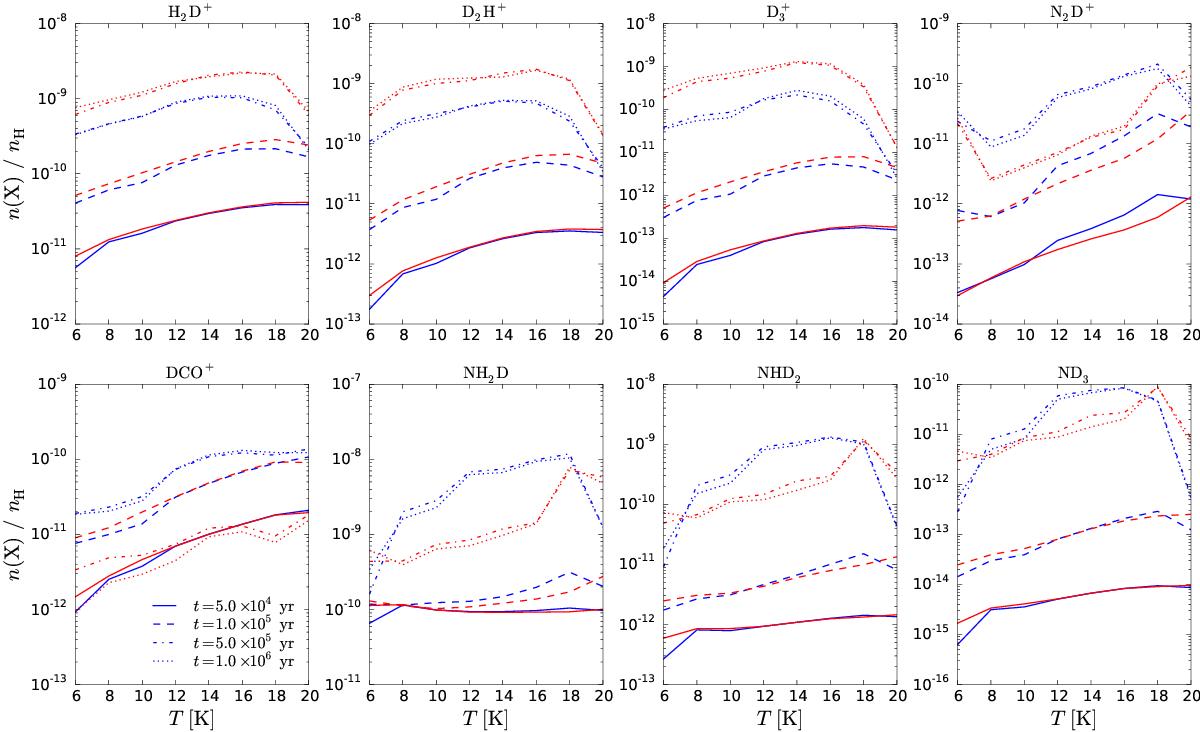
Abundances of various deuterated species as functions of temperature (Tgas = Tdust) at different times (indicated in the figure). The adopted medium density is nH = 105 cm-3. The blue lines represent the bulk ice model, while the red lines represent the multilayer ice model.
Current usage metrics show cumulative count of Article Views (full-text article views including HTML views, PDF and ePub downloads, according to the available data) and Abstracts Views on Vision4Press platform.
Data correspond to usage on the plateform after 2015. The current usage metrics is available 48-96 hours after online publication and is updated daily on week days.
Initial download of the metrics may take a while.