Fig. 1
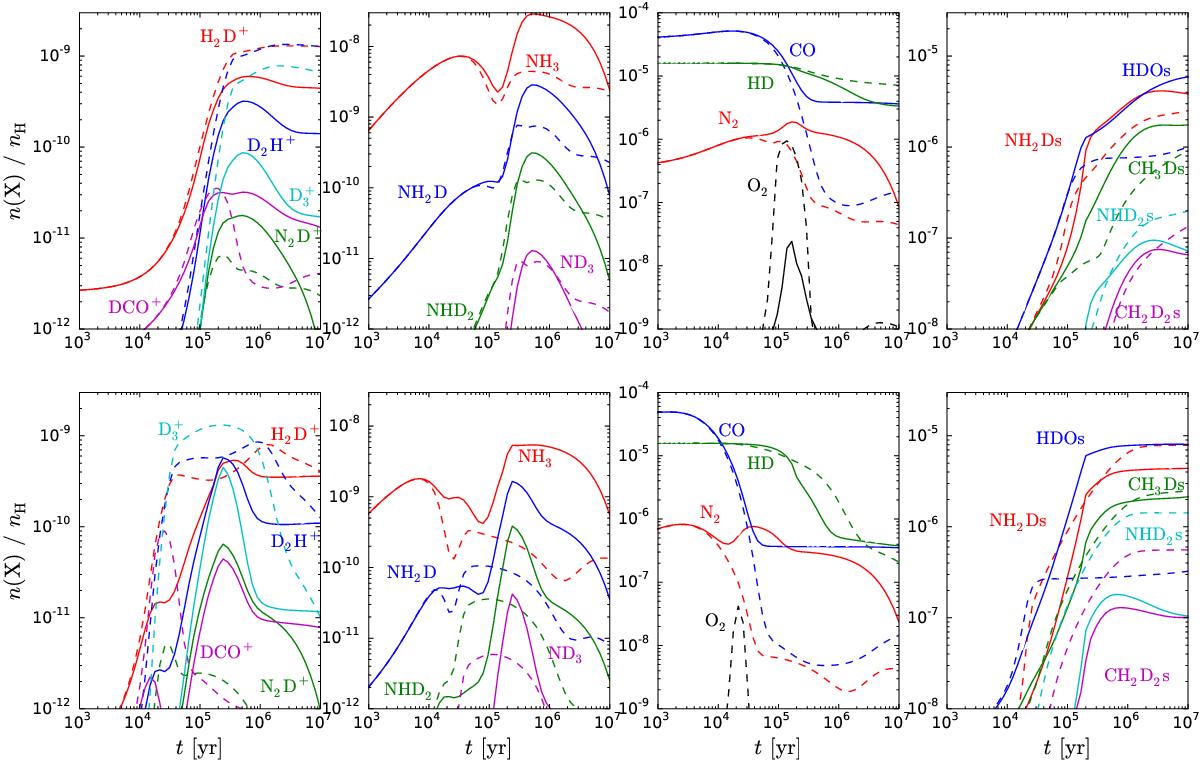
Fractional abundances (with respect to nH) of selected gas-phase and ice species (labeled in the plots) as functions of time in a homogeneous model with Tgas = Tdust = 10 K. For those species that have spin states, the plotted abundances represent sums over the spin states. Solid lines correspond to the bulk ice model, while dashed lines correspond to the multilayer ice model. In the latter case, the ice abundances (right-hand panels) represent sums over the surface and mantle. Upper row: nH = 105 cm-3. Lower row: nH = 106 cm-3.
Current usage metrics show cumulative count of Article Views (full-text article views including HTML views, PDF and ePub downloads, according to the available data) and Abstracts Views on Vision4Press platform.
Data correspond to usage on the plateform after 2015. The current usage metrics is available 48-96 hours after online publication and is updated daily on week days.
Initial download of the metrics may take a while.