| Issue |
A&A
Volume 590, June 2016
|
|
|---|---|---|
| Article Number | A14 | |
| Number of page(s) | 11 | |
| Section | Cosmology (including clusters of galaxies) | |
| DOI | https://doi.org/10.1051/0004-6361/201527913 | |
| Published online | 28 April 2016 | |
MUSE observations of the lensing cluster Abell 1689
1
Université de Toulouse, UPS-OMP, IRAP, 31400
Toulouse,
France
e-mail: This email address is being protected from spambots. You need JavaScript enabled to view it.
; This email address is being protected from spambots. You need JavaScript enabled to view it.
2
CNRS, IRAP, 14,
avenue Édouard Belin, 31400
Toulouse,
France
3
Univ. Lyon, Univ. Lyon1, ENS de Lyon, CNRS, Centre de Recherche
Astrophysique de Lyon UMR 5574, 69230
Saint-Genis-Laval,
France
4
ETH Zurich, Institute of Astronomy, Wolfgang-Pauli-Str. 27, 8093
Zurich,
Switzerland
5
Leibniz-Institut für Astrophysik Potsdam (AIP),
An der Sternwarte 16,
14482
Potsdam,
Germany
6
European Southern Observatory, Karl Schwarzschild Straße 2, 85748
Garching,
Germany
7
Aix-Marseille Université, CNRS, LAM (Laboratoire d’Astrophysique
de Marseille) UMR 7326, 13388
Marseille,
France
8
Geneva Observatory, University of Geneva,
51 chemin des Maillettes,
1290
Versoix,
Switzerland
Received: 7 December 2015
Accepted: 7 March 2016
Abstract
Context. This paper presents the results obtained with the Multi Unit Spectroscopic Explorer (MUSE) for the core of the lensing cluster Abell 1689, as part of MUSE’s commissioning at the ESO Very Large Telescope.
Aims. Integral-field observations with MUSE provide a unique view of the central 1 × 1 arcmin2 region at intermediate spectral resolution in the visible domain, allowing us to conduct a complete census of both cluster galaxies and lensed background sources.
Methods. We performed a spectroscopic analysis of all sources found in the MUSE data cube. Two hundred and eighty-two objects were systematically extracted from the cube based on a guided-and-manual approach. We also tested three different tools for the automated detection and extraction of line emitters. Cluster galaxies and lensed sources were identified based on their spectral features. We investigated the multiple-image configuration for all known sources in the field.
Results. Previous to our survey, 28 different lensed galaxies displaying 46 multiple images were known in the MUSE field of view, most of them were detected through photometric redshifts and lensing considerations. Of these, we spectroscopically confirm 12 images based on their emission lines, corresponding to 7 different lensed galaxies between z = 0.95 and 5.0. In addition, 14 new galaxies have been spectroscopically identified in this area thanks to MUSE data, with redshifts ranging between 0.8 and 6.2. All background sources detected within the MUSE field of view correspond to multiple-imaged systems lensed by A1689. Seventeen sources in total are found at z ≥ 3 based on their Lyman-α emission, with Lyman-α luminosities ranging between 40.5 ≲ log (Lyα) ≲ 42.5 after correction for magnification. This sample is particularly sensitive to the slope of the luminosity function toward the faintest end. The density of sources obtained in this survey is consistent with a steep value of α ≤ −1.5, although this result still needs further investigation.
Conclusions. These results illustrate the efficiency of MUSE in characterizing lensing clusters on one hand and in studying faint and distant populations of galaxies on the other hand. In particular, our current survey of lensing clusters is expected to provide a unique census of sources responsible for the reionization in a representative volume at z ~ 4−7.
Key words: gravitational lensing: strong / galaxies: high-redshift / galaxies: clusters: individual: Abell 1689
© ESO, 2016
1. Introduction
Clusters of galaxies are recognized to be the most efficient gravitational lenses in the Universe (see, e.g., Kneib & Natarajan 2011, and the references therein). For almost 30 years since their discovery, they have allowed the astrophysical community to detect extremely faint and distant sources that would otherwise be inaccessible. Strong magnification in the core of lensing clusters has opened a brand-new type of observational approach to characterize the most distant or faint sources while reducing the selection bias in luminosity. Many high-redshift sources have been identified and studied using this approach during the last years (see, e.g., Zheng et al. 2012; Coe et al. 2013; Laporte et al. 2015; Atek et al. 2015). Cluster lenses have also contributed to constrain the luminosity function for galaxies at high-z down to the faintest limits, often through dedicated surveys (Bradley et al. 2014; Ishigaki et al. 2015; Atek et al. 2015). Using lensing clusters as efficient gravitational telescopes requires a detailed knowledge of the mass distribution, which in turn depends on the correct identification of multiply imaged systems in the cluster core (Zitrin et al. 2011; Richard et al. 2014).
This paper presents the results obtained with the Multi Unit Spectroscopic Explorer (MUSE Bacon et al. 2010) of the core of the lensing cluster Abell 1689 (hereafter A1689), as part of MUSE’s commissioning at the ESO Very Large Telescope. This cluster has been extensively studied during the past 20 years because it is one of the most efficient strong-lensing clusters currently known. Previous analysis of A1689 discovered a large number of multiple images. Coe et al. (2010, hereafter C10) used 135 images of 42 galaxies identified within the central ~400 kpc diameter region to constrain their mass model. One of the most spectacular cases of a strong-lensing configuration are the Sextet Arcs, discovered in this cluster by Frye et al. (2007), and produced by a z = 3.038 Lyman-break galaxy (LBG). The large number of multiple images identified in this field has allowed a reliable mass reconstruction for this cluster, making it one of the best-known gravitational telescopes (see, e.g., Limousin et al. 2007; Tu et al. 2008; Coe et al. 2010). For this reason, A1689 has become a privileged line of sight along which to study the properties of faint and distant samples of background galaxies (Alavi et al. 2014).
Integral-field observations of A1689 with MUSE provide a unique view of the central 1 × 1 arcmin2 region at intermediate spectral resolution in the visible domain, allowing us to conduct a complete census of both cluster galaxies and lensed background sources, in particular in the z ~ 2.7−6.5 domain. Our performance assessment of MUSE in the field of A1689 confirms the idea that this instrument is particularly well suited for the study of faint and distant populations of galaxies (see also Richard et al. 2015; Bacon et al. 2015).
The outline of this article is as follows. In Sect. 2 we describe the observations carried out on the field of A1689 and provide a summary of the data reduction and analysis process. Section 3 addresses the properties of the cluster galaxy populations as seen by MUSE. The identification of background sources lensed by A1689 is discussed in Sect. 4, in particular the spectroscopic confirmation of known multiply imaged sources as well as the discovery of new multiple systems. Implications of these results on the mass modeling of A1689 are also discussed in this section. Conclusions and perspectives are given in Sect. 5. Throughout this paper, we adopt a Λ-CDM cosmology with ΩΛ = 0.7, Ωm = 0.3 and H0 = 70 km s-1 Mpc-1. Magnitudes are given in the AB system (Oke & Gunn 1983). All quoted redshift measurements are based on vacuum rest-frame wavelengths unless otherwise specified.
2. From MUSE data to source extraction
2.1. Observations and data reduction
The core of A1689 (z=0.1847, Teague et al. 1990) was targeted with MUSE during its first commissioning run on February 9, 2014 (ESO program 60.A-9100(A)). We observed a single field of view, centered on α = 13:11:30.5, δ = −01:20:41.5 (J2000) and oriented at PA = 0°, covering a field of view of about 1 × 1 arcmin2 (~185 × 185 kpc at the redshift of the cluster). The total exposure time was ~1.83 h, divided into six individual exposures of 1100 s of integration time with a small linear dither pattern of 0.2′′ and no rotation between each exposure. Observations were obtained in the nominal WFM-NOAO-N mode of MUSE, in good seeing conditions ranging between ~0.51′′ and 0.87′′, as measured by the DIMM seeing monitor, and between ~0.9′′ and 1.1′′ (FWHM) as measured from MUSE data cubes in the reconstructed white-light images.
MUSE data were reduced using the MUSE Data Reduction System V1.0 (Weilbacher et al. 2012, 2014), including bias, dark, flat-fielding, and geometrical corrections, basic sky subtraction, wavelength and flux calibrations, and astrometry. The six individual exposures were reduced and combined into a final datacube. Sky subtraction and correction for sky residuals were performed with the ZAP software (Zurich Atmoshere Purge Soto et al. 2016). Several versions of the MUSE datacube were performed, with different choices for the combination parameters and the correction for sky residuals. Flux calibration and telluric correction was achieved based on observations of the standard star HD 49798 (O6 star). The final datacubes extend between 4750 and 9351 Å, that is, 3681 spectral pixels with a scaling of 1.25 Å/pixel and a spatial scale of 0.2′′/pixel. The spectral resolving power varies between ~2000 in the blue and 4000 in the red. The seeing measured on the combined exposure is ~0.6′′FWHM at 7300 Å.
In addition to MUSE data, we used archive observations obtained by the Hubble Space Telescope (HST) with ACS in the optical bands (F475W, F625W, F775W, F850LP; PID 9289, PI: H. Ford). These deep images reach a limiting magnitude of AB ~ 28.2 in the F775W filter (5σ in a 0.2′′ radius aperture) (see also Alavi et al. 2014). Sources were extracted using two different approaches: a guided extraction based on the detection on HST images, and a blind detection of line-emitters using different automated tools. A color image of the HST field of view showing the footprint of the MUSE field is displayed in Fig. 1, together with the lensed sources that are spectroscopically identified or confirmed in this work.
2.2. Extraction of HST-detected sources
Sources were extracted using two different approaches. First, a catalog of objects was built with SExtractor package version 2.8 (Bertin & Arnouts 1996) based on the detection on the F775W image. Two hundred forty-five objects were detected in this way within the MUSE field of view, with Kron-like magnitudes (SExtractor MAG_AUTO) ranging between 17.0 and 28.1. Before extracting background sources in the central region from the MUSE cube, background residuals and continuum emission from bright cluster galaxies (hereafter BCGs) were fitted and removed from the MUSE cube with median filtering in both wavelength and spatial directions. The BCG area hereafter refers to the central region, which is strongly contaminated by the bright galaxies and displayed in a pink color-scale in Fig. 1. When building the catalog, ten bright sources in the cluster core that were missed by SExtractor because of severe crowding, were manually added. In addition, 23 multiple images from Coe et al. (2010) were missing from the SExtractor catalog for various reasons, mainly because they are located within or close to the central halo. They were also added to the catalog, as well as the four line emitters that were serendipitously discovered after manual inspection of the cube. This process provided 282 objects within the MUSE field of view. 1D spectra for all these sources were systematically extracted from the MUSE cube using a fixed aperture corresponding to 1.5′′ diameter.
Based on this guided-and-manual approach, a secure redshift could be determined for all sources up to MAG_AUTO m(775W) ~ 21.5, most of them being cluster galaxies or stars identified based on their continuum emission. Redshifts were first measured based on manual inspection, followed by template fitting. In total, the spectroscopic sample obtained in this way over the entire photometric catalog yields 63 cluster galaxies (49 of them with m(775W) < 21.5), 5 stars, and 24 galaxies behind the cluster, 17 of them corresponding to sources at z ≥ 3 detected by their Lyman-α emission. The majority of these z ≥ 3 identifications were verified manually and by lensing (see below).
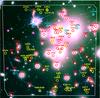 |
Fig. 1 Color image of A1689 obtained by combining F475W, F775W, and F850LP HST/ACS images using a logarithmic scale. The footprint of the MUSE field is displayed together with the sources spectroscopically identified in this field: cluster galaxies (red), stars (magenta), background galaxies at z ≤ 3 (cyan), and z ≥ 3 (yellow). Cluster galaxies that were manually extracted are labeled CG. Objects labeled LN correspond to either line emitters or multiple images lacking a counterpart in the reference catalog based on the F775W image (see text for details). North is up, east is left. A tentative spectroscopic redshift was also obtained for the long southeast arcs in this field, namely 8a and 8b in C10 (see discussion in Sect. 4.1). At the redshift of the cluster, the MUSE field is equivalent to ~185 × 185 kpc. |
2.3. Blind extraction of line emitters
The second approach was the automated (blind) detection and extraction of line emitters and continuum based on three main tools that are developed within the MUSE consortium, namely CubExtractor, LSDCat, and MUSELET. CubExtractor (Cantalupo, in prep.) detects and extracts sources as connected voxels (pixels in the cube) above a given pixel-to-pixel signal-to-noise ratio (S/N) threshold, after 3D Gaussian filtering of the MUSE datacube. LSDCat (Herenz, in prep.) is optimized for the extraction of compact narrow emission-line objects using a matched-filtering approach. MUSELET (for MUSE line-emission tracker, Richard, in prep.) is a simple SExtractor-based tool that extracts sources displaying line-emission, regardless of whether they are linked with continuum emission. All these tools have been optimized for the extraction of line emitters in different environments. Using them in this crowded field was particularly challenging.
A systematic manual inspection was needed to exclude spurious detections, most of them coming from sky-line residuals or imperfect correction for cosmic rays (sometimes showing extended structure in the final cube). During this phase, we used three different versions of the MUSE datacube, with different choices in the parameters used for background subtraction, sky-line residuals and cosmic-ray corrections. Reliable emission lines are expected to be detected in all the cubes. The percentage of spurious detections depends on the flux level of the lines and the parameters used for the automated detection, typically ranging from a few percent for the brightest sources to as high as ~75% for the faintest ones (e.g., flux ~5 × 10-18 erg/s/cm2).
These tools used in various combinations allowed us to detect 14 new emission-line objects, most of them lacking a clear counterpart in the HST/ACS images. All line emitters extracted based on the guided-and-manual approach and discussed in the previous section were detected by one of the automated tools. All sources retained in Sect. 4 were found in all different versions of the MUSE data cubes (with and without background residuals and continuum emission subtracted). All of them yield multiple-image configurations in good agreement with lensing expectations. Based on our experience, the automated procedure was especially useful to find faint emission-line objects, with a typical flux of a few 10-18 erg/s/cm2, in particular those lacking a clear detection on HST/ACS images.
3. Cluster galaxies
The spectroscopic sample obtained in the MUSE field includes 63 cluster galaxies with secure redshifts. All of them exhibit early-type spectra, excepted for two emission-line galaxies. Forty-nine of them are bright, that is, have m(775W) < 21.5. They constitute the majority of the sample within the spectroscopic completeness. Redshifts were measured based on the fit of several absorption lines with high S/N (Balmer series, MgI, Gband, etc.). The mean and the median redshifts for this sample are z = 0.1891 and 0.1889, respectively (z = 0.1883 and 0.1875 when the sample is limited to the completeness level at m(775W) ≤ 21.5). When adopting the mean redshift for the whole sample as the heliocentric reference, the velocity dispersion is found to be σ = 2214 ± 38 km s-1, in good agreement with previous findings in the literature that used more galaxies and wider regions (typically a few Mpc) (see, e.g., Teague et al. 1990; Struble & Rood 1991) This value also agrees well with the largest spectroscopic survey conducted so far on this cluster by Czoske (2004), which included 525 cluster members and displayed a velocity dispersion profile decreasing from ~2100 km s-1 in the center to 1200 km s-1 at ~3 h-1 Mpc from the core. Figure 2 displays the velocity distribution found in the MUSE field of view with respect to the centroid of the whole distribution, and the best Gaussian fit. The velocity dispersion does not depend on the sample and the reference used (i.e., when the center of mass is computed based on either the whole sample or the bright sample alone), all σ values are the same within a ±0.5% interval.
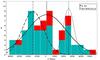 |
Fig. 2 Histogram showing the velocity distribution for the 63 cluster galaxies found in the MUSE field of view with respect to the centroid for the whole distribution (z = 0.1891). Solid lines display the best Gaussian fit to the whole sample. Long and short dashed lines display the best fit to the main cluster component (low-z) and the northeast group (high-z), respectively. |
Summary of the main parameters defining the lensing model.
However, Fig. 2 displays a more complex distribution than the smooth Gaussian distribution found for this cluster on larger scales. Czoske (2004), found no evidence for any substructure at ~1 h-1 Mpc scales, but a group of bright galaxies lies at ~350 kpc northeast of the cluster center, therefore outside the MUSE field of view, but is still visible in the velocity distribution. This group is typically interpreted as evidence for a non-relaxed state in the cluster center that is possibly due to an ongoing merger (Limousin et al. 2007). This close group skews the redshift distribution toward slightly higher redshifts (z ≥ 0.195) and broadens the redshift distribution in the cluster core. Figure 2 also displays the best fit found when considering two independent components, the main cluster component with σ = 1200 ± 51 km s-1, and the group component with σ = 600 ± 68 km s-1. The velocity offset between the two subclumps is 4030 km s-1. As a consequence of this effect, the mean redshift is slightly biased toward a higher value than in previous findings, that is, a value close to z = 0.188 compared to z = 0.184 in the references given above. The redshift of the main cluster component is fully consistent with z = 0.184. There is no obvious trend in the spatial distribution of galaxies belonging to the group across the MUSE field of view.
We have also checked the consistency between our redshifts for galaxies in the center of the cluster with respect to existing data, being aware that spectroscopic targets were more sparsely sampled in previous surveys. Three galaxies of our sample are in common with Teague et al. (1990) (708, 710, and 711 in Fig. 1), and four galaxies with Czoske (2004, and private communication), (545, 713, 777, and 732 in Fig. 1). The average difference is consistent with zero: ⟨ dz ⟩ = 0.0001 ± 0.001.
The results above show that MUSE is able to catch the small-scale substructure in particularly dense environments, a difficult task for standard multi-slit specrographs. This result supports the method adopted by Limousin et al. (2007, hereafter L07) to optimize the lensing mass-modeling in this cluster, based on observations by Czoske (2004) for the cluster dynamics and 32 multiply imaged systems known in this cluster at that epoch. They used a parametric reconstruction of the mass-distribution based on the superposition of two dominant dark-matter clumps, with σ = 1200 and 540 km s-1, respectively, to reproduce the large-scale component. A refined version of the L07 model is used in this paper (see Sect. 4).
4. Lensed sources behind A1689
Previous to our survey, 28 different lensed galaxies displaying 46 multiple images were known in the MUSE field of view, most of them based on photometric redshifts together with lensing considerations (see, e.g., Limousin et al. 2007; Frye et al. 2007; Tu et al. 2008; Coe et al. 2010). Of these, we have been able to confirm 12 images corresponding to 7 different lensed galaxies between z = 0.95 and 5.0. These systems are described in Sect. 4.1. Fourteen new galaxies have also been spectroscopically identified in this area thanks to MUSE data, with redshifts ranging between 0.8 and 6.2, as presented in Sect. 4.2. The majority of the lensed galaxies has been identified based on their Lyman-α emission.
The lensing model used to analyze these data is the one presented in L07, based on Lenstool (Jullo et al. 2007), with some refinements to include the latest spectroscopic constraints on multiple images available in the literature for this cluster (see also Richard et al., in prep.). Table 1 provides the updated version of Table 3 in L07, summarizing the main parameters used throughout this paper for the lensing model. Dark matter halos are modeled by a truncated pseudo-isothermal elliptical mass distribution scaled to their masses, from large-scales (clumps 1 and 2, as discussed in Sect. 3) to cluster-galaxy halos. The main contributions are listed in Table 1 together with the basic scaling parameters used to model the contribution of 192 additional early-type cluster galaxies. All images detected in this small field are expected to be multiply imaged systems lensed by A1689. Our results below are fully consistent with this expectation, as discussed in Sect. 4.3.
Table 2 presents the catalog of lensed images or sources identified in this field of view. Objects labeled LN in this table (Col. 1) correspond either to line emitters or multiple images lacking a counterpart in the reference catalog based on the F775W image. When the image or source was known before, its previous identification is given in Col. 2. Line fluxes were measured after subtracting the underlying continuum. Line profiles were fitted using MPDAF tools (Piqueras et al., in prep.). A double-Gaussian profile was adopted to fit Lyman-α lines, combining two half Gaussian to better mimic the asymmetric profiles. For Lyman-α emitters, we adopted the maximum of the line as reference for redshift determinations. Figures 3 and 4 display the extracted spectra for all images after subtracting underlying continuum, grouped by lensing systems. Figure 5 displays the distribution of emission-line fluxes versus redshift measured for the brightest emission lines (usually Lyman-α) versus redshift for the 21 galaxies found behind A1689. We note that multiply imaged sources are counted only once in this diagram, and only the brightest line is shown for a given source. The median lens-corrected flux is ~1.4 × 10⁻¹⁸ erg/s/cm2. This illustrates the effective depth achieved in this survey based on a relatively modest amount of exposure time.
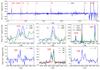 |
Fig. 3 Extracted spectra of all multiply imaged systems identified in the MUSE field of view at z ≤ 3, ordered according to increasing redshift, following the identifications in Table 2. Continuum emission has been subtracted in all cases. The flux for counter-image LN20, extracted within a BCG, has been multiplied by a factor of 3 to improve readability. |
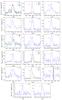 |
Fig. 4 Same as in Fig. 3 for multiply imaged systems at z ≥ 3. The gray area corresponds to a strong emission-line residual. |
Catalog of images identified behind the lensing cluster A1689 within the field of view of MUSE.
4.1. Results on previously known systems
Our MUSE survey has produced some interesting results on previously known systems in this field, in particular those exhibiting emission lines. We summarize these below.
-
System 1 (619(1c) and L1f): one of the most spectacular sources in this field is the Sextet Arc, corresponding to six separate images of a strongly lensed LBGs at z = 3.038. (Frye et al. 2007). Two images of the source are present in the MUSE field of view, namely 1c and 1f. As shown by Frye et al. (2007), this galaxy exhibits a complex behavior that is highlighted by magnification, providing an enhanced spatial resolution. The spectrum is dominated by absorption in image 1a, displaying a complex Lyman-α profile across the galaxy, whereas a strong Lyman-α emission is found in image 1c. We here confirm the redshift found for 1c and provide an additional proof of the reality of this arc by confirming the Lyman-α emission of 1f. Before our survey, only a photometric redshift was available for this image (see C10). In addition to this result, an extended emission is also observed associated with 619(1c), with two main Lyman-α extensions labeled LN23 and LN24 in Table 2, as shown in Fig. 6. Given the location of 1f within the BCG region and its smaller magnification, the counter images of LN23 and LN24 could not be detected.
-
System 4 (750(4a), 518(4b), and L4e): this five-image system was described for the first time by L07, who provided a first spectroscopic z = 1.1, in agreement with the photometric redshifts derived by C10. A precise spectroscopic redshift was used by Jullo et al. (2010), fully consistent with the present value. We here spectroscopically confirm the system as being the multiple image of a source at z = 1.164, based on the detection of the same identical emission-line doublet of [OII]3727 in the three images included in the MUSE field of view.
-
System 7 (1379(7b), 1401, and LN16): the multiply imaged system 7 was previously identified by Frye et al. (2002) and later discussed by L07 and C10, who provided a photometric and lensing-motivated identification for 7b. Frye et al. (2002) and Richard et al. (2011) reported a redshift z = 4.860 for the 7a component, which is located outside the MUSE field, based on the detection of Lyman-α emission for the former and the [OII]3727 in the near-IR for the latter. Here we confirm the nature of this system, with a spectroscopic redshift z = 4.874 for 7b, based on a strong emission-line identified as Lyman-α. The emission region seems to extend beyond the image seen on HST data, toward the neighboring source 1401, as shown in Fig. 7. We note that there is a difference in redshift of ~0.011 (δv ~ 560 km s-1) between the 7b component reported here and the 7a component (using air wavelength reference for all measurements to be consistent), which cannot be easily explained. The extended Lyman-α emission in this source might be sampled differently in the two images. In addition, we confirm the spectroscopic redshift of a counter-image located within the BCG area, labeled LN16 in Table 2. Our results are fully consistent with a three-image system, as suggested by previous authors.
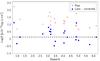
Fig. 5 Distribution of emission-line fluxes measured for the brightest emission-lines versus redshift for the 21 sources found behind A1689, with and without correction for lensing magnification. The lines used are given in Col. 3 of Table 2 (Lyman-α at z ≥ 3). The horizontal dashed line indicates the median lens-corrected flux value. Multiply imaged sources are counted once in this diagram.
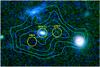
Fig. 6 Color image of A1689 obtained by combining F475W, F775W, and F850LP HST/ACS images using a logarithmic scale, showing a 6.3′′× 4.2′′ region around 619(1c) and its extended emission. Circles have diameters of 0.60′′, close to the FWHM seeing measured in the MUSE data. Cyan isocontours display flux levels for Lyman-α emission, from 0.5 to 2 × 10-19 erg/s/cm2/pix2, with bins of 0.5 × 10⁻¹⁹ erg/s/cm2/pix2.
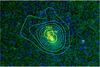
Fig. 7 Color image of A1689 obtained by combining F475W, F775W, and F850LP HST/ACS images using a logarithmic scale, showing a 6.3′′× 4.2′′ region around 1379 and 1401. Circles have diameters of 0.60′′, which is close to the FWHM seeing measured in the MUSE data. Cyan isocontours display flux levels for Lyman-α emission from 0.5 to 18 × 10-19 erg/s/cm2/pix2, with bins of 1 × 10-19 erg/s/cm2/pix2.
-
System 17 (L17a): we spectroscopically confirm the redshift of the three-image system 17 in C10 as z = 2.661, based on identifying the emission-line doublet of CIII]1909. This value agrees well with the photometric and lensing redshifts around z = 2.7 ± 0.5 estimated by L07 and C10.
-
System 26 (L26b): we spectroscopically confirm the redshift of the three-image system 26 in C10 as z = 0.959, based on identifying the emission-line doublet of [OII]3727. This value agrees excellently well with the photometric and lensing redshifts z = 0.9 ± 0.2 estimated by C10. In addition, the counter-image 26c in C10, which has a smaller magnification factor of ~3.2, is also detected as a faint emission seen in the 3D MUSE cube, but it is too faint to be successfully extracted. These results fully confirm the lensing system.
-
System 46 (944(46a) and LN22): this highly magnified double-image system was reported in C10 with uncertain photometric redshifts for the two images. Here we measure a redshift z = 3.483 based on an emission line identified as Lyman-α. The two objects showing this emission on the 1.5′′ diameter aperture are located side by side, but the emission line is clearly centered on LN22, lacking a clear counterpart in the HST/ACS images, as shown in Fig. 8. Based on these measurements, it is more likely a three-image system, with two images located within the MUSE field. The fainter counter-images are expected to be located within the central (noisy) region, with fluxes (~1 × 10-18 erg/s/cm2) that are too faint to be detected with a significant S/N in this area.
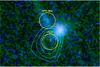
Fig. 8 Color image of A1689 obtained by combining F475W, F775W, and F850LP HST/ACS images using a logarithmic scale, showing a 3.7′′× 2.45′′ region around 944 and LN22. Circles have diameters of 0.60′′, which is close to the FWHM seeing measured in the MUSE data. Cyan isocontours display flux levels for Lyman-α emission from 0.3 to 8 × 10-19 erg/s/cm2/pix2, with bins of 1.25 × 10⁻²⁰ erg/s/cm2/pix2. The brightest source seen in the HST image is likely to be a cluster galaxy, but no spectroscopic redshift could be determined for it.
-
System 50 (L50a, 588(50b) and L50c): MUSE spectroscopy has allowed us to confirm this spectacular three-image system based on the detection of a strong emission-line identified as Lyman-α for a source at z = 4.274, and seen in the three images available in this field. Previous photometric redshifts reported by C10 were highly inaccurate (between z = 2.2 and 3.2). Therefore, these observations allow us to confirm the redshift and nature of this system.
4.2. New multiply imaged sources behind A1689
As a result of this survey, 14 new background sources were identified behind A1689, as reported in Table 2. All of them generate multiply imaged systems, identified from N = 51 to 64 (in continuity with respect to C10). In two cases, we were able to spectroscopically confirm the identification of (at least) two such images:
-
System 51 (1339 and LN20): 1339 is a highly magnified image of a source at z = 0.775, based on the identification of several emission-lines, mainly [OIII]5007, 4959, Hβ, Hγ, NeIII, the [OII]3727 doublet, and MgII. LN20 is an image extracted within the BCG area and displays the same (main) emission lines. These two images are consistent with a new three-image system, with two images located within the MUSE field of view. In this case, magnifications affecting 1339 and LN20 are ~13 and ~2, respectively, which agrees well with the relative line fluxes. The third image is found as expected in the field that is covered by HST images, with m(775W) = 25.1 and magnification ~5.
-
System 52 (1028, 1045 and LN12): 1028 is a highly magnified image of a source at z = 3.112, based on the identification of Lyman-α and CIV seen in emission. Lyman-α in emission is also seen at the same redshift in a region associated with 1045 (in the close neighborhood of 1028), as shown in Fig. 9. The system is consistent with a new three-image source, with two images located within the MUSE field of view, namely 1028 (and its Lyman-α extension 1045), and LN12, which were extracted within the BCG area. The third image is identified in the field covered by HST images, with m(775W) = 26.9 and magnification ~4.
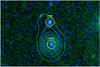 |
Fig. 9 Color image of A1689 obtained by combining F475W, F775W, and F850LP HST/ACS images using a logarithmic scale, showing a 6.3′′× 4.2′′ region around 1028 and 1045. Circles have diameters of 0.60′′, which is close to the FWHM seeing measured in the MUSE data. Cyan isocontours display flux levels for Lyman-α emission from 0.5 to 35 × 10-19 erg/s/cm2/pix2, with bins of 2 × 10-20 erg/s/cm2/pix2. |
-
Systems 53, 54, and 55 (LN9, 1404, and 835): these three images display a similar redshift z ~ 3.18. However, based on the lensing model, they cannot be reconciled with a multiple-image system. LN9 and 1404 are two independent systems with three multiple images each, two of them within the MUSE field, namely the image detected and another counter-image within the BCG region thatisaboutfive times fainter for LN9 and de-magnified (μ ~ 0.03) for 1404. A candidate third image could be extracted for system 54 at the expected position in the field covered by HST images, close to a bright cluster galaxy, with m(775W) = 27.4. In contrast, there is no obvious counterpart for the faint continuum emission associated with LN9 despite a 1.2 times larger magnification, but the image is expected in the close neighborhood of a particularly crowded region. 835 is more likely a double-image system, with a de-magnified counter-image located within the BCG region.
-
System 56 (LN10): this image displays the largest magnification of the sample (μ ~ 75). It is most likely a new three-image source at z ~ 3.419, with two images located within the MUSE field of view. The magnification of the counter-image expected within the BCG area is μ ~ 9, yielding a flux below ~2 × 10-18 erg/s/cm2, which is too faint to be detected in this area. There is an extremely faint object in the field covered by HST images, with m(775W) ~ 28 and magnification ~8, which is a good candidate to the third image.
4.3. Discussion
All background sources detected within the MUSE field of view correspond to multiply imaged systems. The spectroscopic images described above are consistent with this fact. In most cases, they correspond to three- or five-image systems with at least two images located within the MUSE field. The detection of counterparts within the BCG area, with observed line fluxes expected to be around or below ~2 × 10-18 erg/s/cm2, is simply unfeasible. Therefore, in the majority of cases presented above, there is no spectroscopic confirmation of the multiple system, and this is a very common situation in the literature (i.e., the spectroscopic redshift being available for only one of the images in a multiple system). However, for sources exhibiting a continuum (i.e., detected in HST images), we have identified possible counterparts outside the field of MUSE. The mass-model used in this analysis is accurate enough to permit a good determination of magnification factors and related quantities and to identify multiple systems. A new revised mass-model, including all the new multiple images discussed above, will be presented in a coming paper (Richard et al., in preparation).
Compared to the sample of 26 bright well-behaved Lyman-α emitters observed by MUSE in the HDFS at z ≥ 2.9 and displaying extended Lyman-α emission (i.e., isolated, non-AGN galaxies Bacon et al. 2015; Wisotzki et al. 2016), our sample is intrinsically fainter, with Lyman-α luminosities ranging between 40.5 ≲ log(L)[erg s-1] ≲ 42.5 after correction for magnification. As a result of the relatively short exposure time and because these observations were performed close to the extended halo of BCG in the cluster core, we do not discuss the extended Lyman-α emission around individual sources here. However, such an emission is clearly observed in at least four cases as described above (systems 1c, 7b, 46a, and 52; see Figs. 6 to 9).
When we compare the distribution of lens-corrected Lyman-α luminosities for the 17 galaxies found behind A1689 at 3 ≲ z ≲ 7 to a compilation of representative spectroscopic samples from the literature (see Fig. 10), the complementarity between classical blank-field and lensing studies is obvious. Lyman-α emitters observed by MUSE in lensing clusters nicely extend the accessible domain in luminosity between one and two orders of magnitude beyond classical LAE surveys. The luminosities reached here are comparable with those attained by Rauch et al. (2008) in their ~90h exposure with VLT/FORS2 (gray triangles in Fig. 10). The present sample also reaches fainter limits than the survey conducted on the HDFS by Bacon et al. (2015), in particular at z ≳ 4, which is due to the specific pointing covering the highest magnification regime in this particularly efficient cluster.
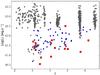 |
Fig. 10 Distribution of lens-corrected Lyman-α luminosities for the 17 galaxies found behind A1689 at 3 ≤ z ≤ 7 (red squares), as compared to Bacon et al. (2015) (blue diamonds), and to a compilation of representative samples of LAE from the literature (gray symbols): 2 ≲ z ≲ 3.8(Blanc et al. 2011) (HETDEX Pilot Survey), 2.7 ≲ z ≲ 3.8 (gray triangles) (Rauch et al. 2008), z ~ 4.9(Shioya et al. 2009), z ~ 5.7(Shimasaku et al. 2006; Ouchi et al. 2008; Henry et al. 2012; Hu et al. 2010), and z ~ 6.5(Ouchi et al. 2010; Hu et al. 2010; Kashikawa et al. 2011). |
A high magnification value also translates into a small effective surface or volume covered by the survey on the corresponding source planes. To evaluate this effect, we computed the effective volume covered by the survey in the different redshift bins from z ~ 3.5 to z ~ 6.5, with redshift slices of Δz = 0.5. A mask was used to remove the areas contaminated by the central BCGs, where faint sources typically below a few ~×10-18 erg/s/cm2 could not be detected. This mask accounts for ~11% of the total surface. We integrated the effective volume outside the mask using the same approach as in Richard et al. (2006), that is, the surface of each pixel was reduced by the corresponding magnification (depending on position and redshift). We used Lenstool and the same lensing model as in Sect. 3 to derive the magnification maps for each redshift slice. The total effective covolume obtained in this way in the field of view of MUSE is ~145 Mpc3 at 3 ≲ z ≲ 7, whereas it is ~2300 Mpc3 in a blank field.
Figure 11 displays the comparison between the density of sources obtained in this way within the whole 3 ≲ z ≲ 7 interval, and expectations based on the extrapolation of the luminosity function (LF) toward the low-luminosity regime covered by the present survey. Luminosity bins were defined to keep at least three sources per bin, and they are independent. Given the small number of sources, we did not introduce any correction for incompleteness at this stage, knowing that incompleteness is expected to affect in particular the faintest bins in Fig. 11. Error bars in this figure include Poisson noise statistics that affect the number of galaxies found in a given luminosity bin, as well as an estimate of the field-to-field variance, added in quadrature. Field-to-field variance was estimated using the public cosmic variance calculator by Trenti & Stiavelli (2008). The error budget is clearly dominated by Poisson noise in this case.
Given the intrinsic low luminosities in our sample, we are particularly sensitive to the value of the slope parameter α, for which a constant value is assumed in other surveys presented in Figs. 10 and 11, where the fit is only sensitive to L∗ and the normalization. Despite these caveats discussed above regarding the small size of this sample, the density of intrinsically faint sources observed in this field is roughly consistent with the steepest values used by the different authors to fit their data, namely α ≤ −1.5, and inconsistent with flatter values of α. Any correction for completeness in the faintest bins will exacerbate this trend. This result still needs further investigation to be confirmed, using larger samples of LAE in this low-luminosity domain. A full analysis of the LF for the faint Lyman-α emitters behind lensing clusters will be presented elsewhere in a forthcoming paper.
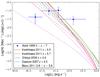 |
Fig. 11 Comparison between the density of sources observed at 3 ≤ z ≤ 7 behind A1689 and expectations based on the extrapolation of the LF toward the low-luminosity regime covered by the present survey. References are given in the figure for different redshifts. Solid lines display the steepest slopes adopted for the LF fit: α = −1.7 for Kashikawa et al. (2011) and Blanc et al. (2011), α = −2.0 for Shioya et al. (2009), and α = −1.6 for Dawson et al. (2007). Dashed and dotted lines correspond to α = −1.5 and −1.3 for Kashikawa et al. (2011) and α = −1.5 and −1.0 for Shioya et al. (2009). Error bars include Poisson noise statistics and field-to-field variance (see text). |
5. Conclusions
To summarize, these are the main results we obtained:
-
Based on guided-and-manual and automated (blind) approaches, a census of sources was obtained in the field of MUSE, most of which are cluster galaxies. The spectroscopic census is complete out to m(775W) < 21.5. The spectroscopic sample includes 63 cluster galaxies with secure redshifts (49 of them with m(775W) < 21.5). The velocity distribution of cluster galaxies is more complex than the smooth Gaussian distribution found for this cluster on larger scales, with a main cluster component with σ = 1200 km s-1, and the signature of the NE group component, with σ = 600 km s-1. This demonstrates that MUSE data are able to catch the small-scale substructure in particularly dense environments, a difficult exercise for usual multi-slit spectrographs. This result supports the mass-model method adopted by L07 and used throughout the paper to retrieve lens-corrected quantities.
-
We are able to confirm 12 images for background sources that correspond to 7 different lensed galaxies between z = 0.95 and 5.0 of the 28 different lensed galaxies known or suspected within the MUSE field of view. In addition, 14 new galaxies were spectroscopically identified in this area thanks to MUSE data, with redshifts ranging between 0.8 and 6.2, the majority of them identified based on their Lyman-α emission. All background sources detected within the MUSE field of view correspond to multiply imaged systems, in most cases three- or five-image systems with at least two images located within the MUSE field.
-
In total, 17 sources are found at z ≥ 3 based on their Lyman-α emission, with Lyman-α luminosities ranging between 40.5≲log(Lyα)≲42.5 after correction for magnification. Four of these systems display extended Lyman-α emission. Our sample is intrinsically fainter than the usual samples available in the literature, in particular at z ≥ 4, and comparable to the faintest samples currently available at lower redshifts (e.g., the sample Lyman-α emitters observed by MUSE in the HDFS at z≥2.9 Bacon et al. 2015; Wisotzki et al. 2016). Given the intrinsically low luminosities, this sample is particularly sensitive to the slope of the LF toward the faintest-end. The density of sources obtained in this survey is roughly consistent with a steep value of α ≤ −1.5, although this result still needs further investigation.
These results illustrate the efficiency of MUSE in characterizing lensing clusters on one hand, and studying faint and distant populations of galaxies on the other hand. In particular, our current survey of lensing clusters is expected to provide a unique census of sources responsible for the reionization in a limited representative volume at z ~ 4−7.
Acknowledgments
We thank O. Czoske for providing unpublished spectroscopic data on A1689. Part of this work was supported by the French CNRS. This work has been carried out thanks to the support of the OCEVU Labex (ANR-11-LABX-0060) and the A*MIDEX project (ANR-11-IDEX-0001-02) funded by the “Investissements d’Avenir” French government program managed by the ANR. Partially funded by the ERC starting grant CALENDS (J.R., V.P., B.C.), and the Agence Nationale de la recherche bearing the references ANR-09-BLAN-0234 and ANR-13-BS05-0010-02 (FOGHAR). Based on observations made with ESO Telescopes at the La Silla Paranal Observatory under programme ID 60.A-9100(B). We thank all the staff at Paranal Observatory for their valuable support during the commissioning of MUSE. Also based on observations made with the NASA/ESA Hubble Space Telescope (PID 9289).
References
- Alavi, A., Siana, B., Richard, J., et al. 2014, ApJ, 780, 143 [NASA ADS] [CrossRef] [Google Scholar]
- Atek, H., Richard, J., Kneib, J.-P., et al. 2015, ApJ, 800, 18 [NASA ADS] [CrossRef] [Google Scholar]
- Bacon, R., Accardo, M., Adjali, L., et al. 2010, in SPIE Conf. Ser., 7735, 8 [Google Scholar]
- Bacon, R., Brinchmann, J., Richard, J., et al. 2015, A&A, 575, A75 [NASA ADS] [CrossRef] [EDP Sciences] [Google Scholar]
- Bertin, E., & Arnouts, S. 1996, A&AS, 117, 393 [NASA ADS] [CrossRef] [EDP Sciences] [Google Scholar]
- Blanc, G. A., Adams, J. J., Gebhardt, K., et al. 2011, ApJ, 736, 31 [NASA ADS] [CrossRef] [Google Scholar]
- Bradley, L. D., Zitrin, A., Coe, D., et al. 2014, ApJ, 792, 76 [NASA ADS] [CrossRef] [Google Scholar]
- Coe, D., Benítez, N., Broadhurst, T., & Moustakas, L. A. 2010, ApJ, 723, 1678 [NASA ADS] [CrossRef] [Google Scholar]
- Coe, D., Zitrin, A., Carrasco, M., et al. 2013, ApJ, 762, 32 [NASA ADS] [CrossRef] [Google Scholar]
- Czoske, O. 2004, in Outskirts of Galaxy Clusters: Intense Life in the Suburbs, ed. A. Diaferio, IAU Colloq. 195, 183 [Google Scholar]
- Dawson, S., Rhoads, J. E., Malhotra, S., et al. 2007, ApJ, 671, 1227 [NASA ADS] [CrossRef] [Google Scholar]
- Frye, B., Broadhurst, T., & Benítez, N. 2002, ApJ, 568, 558 [NASA ADS] [CrossRef] [Google Scholar]
- Frye, B. L., Coe, D., Bowen, D. V., et al. 2007, ApJ, 665, 921 [NASA ADS] [CrossRef] [Google Scholar]
- Henry, A. L., Martin, C. L., Dressler, A., Sawicki, M., & McCarthy, P. 2012, ApJ, 744, 149 [NASA ADS] [CrossRef] [Google Scholar]
- Hu, E. M., Cowie, L. L., Barger, A. J., et al. 2010, ApJ, 725, 394 [NASA ADS] [CrossRef] [Google Scholar]
- Ishigaki, M., Kawamata, R., Ouchi, M., et al. 2015, ApJ, 799, 12 [NASA ADS] [CrossRef] [Google Scholar]
- Jullo, E., Kneib, J.-P., Limousin, M., et al. 2007, New J. Phys., 9, 447 [Google Scholar]
- Jullo, E., Natarajan, P., Kneib, J.-P., et al. 2010, Science, 329, 924 [NASA ADS] [CrossRef] [PubMed] [Google Scholar]
- Kashikawa, N., Shimasaku, K., Matsuda, Y., et al. 2011, ApJ, 734, 119 [NASA ADS] [CrossRef] [Google Scholar]
- Kneib, J.-P., & Natarajan, P. 2011, A&ARv, 19, 47 [NASA ADS] [CrossRef] [Google Scholar]
- Laporte, N., Streblyanska, A., Kim, S., et al. 2015, A&A, 575, A92 [NASA ADS] [CrossRef] [EDP Sciences] [Google Scholar]
- Limousin, M., Richard, J., Jullo, E., et al. 2007, ApJ, 668, 643 [NASA ADS] [CrossRef] [Google Scholar]
- Oke, J. B., & Gunn, J. E. 1983, ApJ, 266, 713 [NASA ADS] [CrossRef] [Google Scholar]
- Ouchi, M., Shimasaku, K., Akiyama, M., et al. 2008, ApJS, 176, 301 [NASA ADS] [CrossRef] [Google Scholar]
- Ouchi, M., Shimasaku, K., Furusawa, H., et al. 2010, ApJ, 723, 869 [NASA ADS] [CrossRef] [Google Scholar]
- Rauch, M., Haehnelt, M., Bunker, A., et al. 2008, ApJ, 681, 856 [NASA ADS] [CrossRef] [Google Scholar]
- Richard, J., Pelló, R., Schaerer, D., Le Borgne, J.-F., & Kneib, J.-P. 2006, A&A, 456, 861 [NASA ADS] [CrossRef] [EDP Sciences] [Google Scholar]
- Richard, J., Jones, T., Ellis, R., et al. 2011, MNRAS, 413, 643 [NASA ADS] [CrossRef] [Google Scholar]
- Richard, J., Jauzac, M., Limousin, M., et al. 2014, MNRAS, 444, 268 [NASA ADS] [CrossRef] [Google Scholar]
- Richard, J., Patricio, V., Martinez, J., et al. 2015, MNRAS, 446, L16 [NASA ADS] [CrossRef] [Google Scholar]
- Shimasaku, K., Kashikawa, N., Doi, M., et al. 2006, PASJ, 58, 313 [NASA ADS] [Google Scholar]
- Shioya, Y., Taniguchi, Y., Sasaki, S. S., et al. 2009, ApJ, 696, 546 [NASA ADS] [CrossRef] [Google Scholar]
- Soto, K. T., Lilly, S. J., Bacon, R., Richard, J., & Conseil, S. 2016, MNRAS, 458, 3210 [NASA ADS] [CrossRef] [Google Scholar]
- Struble, M. F., & Rood, H. J. 1991, ApJS, 77, 363 [NASA ADS] [CrossRef] [Google Scholar]
- Teague, P. F., Carter, D., & Gray, P. M. 1990, ApJS, 72, 715 [NASA ADS] [CrossRef] [Google Scholar]
- Trenti, M., & Stiavelli, M. 2008, ApJ, 676, 767 [Google Scholar]
- Tu, H., Limousin, M., Fort, B., et al. 2008, MNRAS, 386, 1169 [NASA ADS] [CrossRef] [Google Scholar]
- Weilbacher, P. M., Streicher, O., Urrutia, T., et al. 2012, in SPIE Conf. Ser., 8451 [Google Scholar]
- Weilbacher, P. M., Streicher, O., Urrutia, T., et al. 2014, in Astronomical Data Analysis Software and Systems XXIII, eds. N. Manset, & P. Forshay, ASP Conf. Ser., 485, 451 [Google Scholar]
- Wisotzki, L., Bacon, R., Blaizot, J., et al. 2016, A&A, 587, A98 [NASA ADS] [CrossRef] [EDP Sciences] [Google Scholar]
- Zheng, W., Postman, M., Zitrin, A., et al. 2012, Nature, 489, 406 [NASA ADS] [CrossRef] [PubMed] [Google Scholar]
- Zitrin, A., Broadhurst, T., Barkana, R., Rephaeli, Y., & Benítez, N. 2011, MNRAS, 410, 1939 [NASA ADS] [Google Scholar]
All Tables
Catalog of images identified behind the lensing cluster A1689 within the field of view of MUSE.
All Figures
|
Fig. 1 Color image of A1689 obtained by combining F475W, F775W, and F850LP HST/ACS images using a logarithmic scale. The footprint of the MUSE field is displayed together with the sources spectroscopically identified in this field: cluster galaxies (red), stars (magenta), background galaxies at z ≤ 3 (cyan), and z ≥ 3 (yellow). Cluster galaxies that were manually extracted are labeled CG. Objects labeled LN correspond to either line emitters or multiple images lacking a counterpart in the reference catalog based on the F775W image (see text for details). North is up, east is left. A tentative spectroscopic redshift was also obtained for the long southeast arcs in this field, namely 8a and 8b in C10 (see discussion in Sect. 4.1). At the redshift of the cluster, the MUSE field is equivalent to ~185 × 185 kpc. |
| In the text | |
|
Fig. 2 Histogram showing the velocity distribution for the 63 cluster galaxies found in the MUSE field of view with respect to the centroid for the whole distribution (z = 0.1891). Solid lines display the best Gaussian fit to the whole sample. Long and short dashed lines display the best fit to the main cluster component (low-z) and the northeast group (high-z), respectively. |
| In the text | |
|
Fig. 3 Extracted spectra of all multiply imaged systems identified in the MUSE field of view at z ≤ 3, ordered according to increasing redshift, following the identifications in Table 2. Continuum emission has been subtracted in all cases. The flux for counter-image LN20, extracted within a BCG, has been multiplied by a factor of 3 to improve readability. |
| In the text | |
|
Fig. 4 Same as in Fig. 3 for multiply imaged systems at z ≥ 3. The gray area corresponds to a strong emission-line residual. |
| In the text | |
|
Fig. 5 Distribution of emission-line fluxes measured for the brightest emission-lines versus redshift for the 21 sources found behind A1689, with and without correction for lensing magnification. The lines used are given in Col. 3 of Table 2 (Lyman-α at z ≥ 3). The horizontal dashed line indicates the median lens-corrected flux value. Multiply imaged sources are counted once in this diagram. |
| In the text | |
|
Fig. 6 Color image of A1689 obtained by combining F475W, F775W, and F850LP HST/ACS images using a logarithmic scale, showing a 6.3′′× 4.2′′ region around 619(1c) and its extended emission. Circles have diameters of 0.60′′, close to the FWHM seeing measured in the MUSE data. Cyan isocontours display flux levels for Lyman-α emission, from 0.5 to 2 × 10-19 erg/s/cm2/pix2, with bins of 0.5 × 10⁻¹⁹ erg/s/cm2/pix2. |
| In the text | |
|
Fig. 7 Color image of A1689 obtained by combining F475W, F775W, and F850LP HST/ACS images using a logarithmic scale, showing a 6.3′′× 4.2′′ region around 1379 and 1401. Circles have diameters of 0.60′′, which is close to the FWHM seeing measured in the MUSE data. Cyan isocontours display flux levels for Lyman-α emission from 0.5 to 18 × 10-19 erg/s/cm2/pix2, with bins of 1 × 10-19 erg/s/cm2/pix2. |
| In the text | |
|
Fig. 8 Color image of A1689 obtained by combining F475W, F775W, and F850LP HST/ACS images using a logarithmic scale, showing a 3.7′′× 2.45′′ region around 944 and LN22. Circles have diameters of 0.60′′, which is close to the FWHM seeing measured in the MUSE data. Cyan isocontours display flux levels for Lyman-α emission from 0.3 to 8 × 10-19 erg/s/cm2/pix2, with bins of 1.25 × 10⁻²⁰ erg/s/cm2/pix2. The brightest source seen in the HST image is likely to be a cluster galaxy, but no spectroscopic redshift could be determined for it. |
| In the text | |
|
Fig. 9 Color image of A1689 obtained by combining F475W, F775W, and F850LP HST/ACS images using a logarithmic scale, showing a 6.3′′× 4.2′′ region around 1028 and 1045. Circles have diameters of 0.60′′, which is close to the FWHM seeing measured in the MUSE data. Cyan isocontours display flux levels for Lyman-α emission from 0.5 to 35 × 10-19 erg/s/cm2/pix2, with bins of 2 × 10-20 erg/s/cm2/pix2. |
| In the text | |
|
Fig. 10 Distribution of lens-corrected Lyman-α luminosities for the 17 galaxies found behind A1689 at 3 ≤ z ≤ 7 (red squares), as compared to Bacon et al. (2015) (blue diamonds), and to a compilation of representative samples of LAE from the literature (gray symbols): 2 ≲ z ≲ 3.8(Blanc et al. 2011) (HETDEX Pilot Survey), 2.7 ≲ z ≲ 3.8 (gray triangles) (Rauch et al. 2008), z ~ 4.9(Shioya et al. 2009), z ~ 5.7(Shimasaku et al. 2006; Ouchi et al. 2008; Henry et al. 2012; Hu et al. 2010), and z ~ 6.5(Ouchi et al. 2010; Hu et al. 2010; Kashikawa et al. 2011). |
| In the text | |
|
Fig. 11 Comparison between the density of sources observed at 3 ≤ z ≤ 7 behind A1689 and expectations based on the extrapolation of the LF toward the low-luminosity regime covered by the present survey. References are given in the figure for different redshifts. Solid lines display the steepest slopes adopted for the LF fit: α = −1.7 for Kashikawa et al. (2011) and Blanc et al. (2011), α = −2.0 for Shioya et al. (2009), and α = −1.6 for Dawson et al. (2007). Dashed and dotted lines correspond to α = −1.5 and −1.3 for Kashikawa et al. (2011) and α = −1.5 and −1.0 for Shioya et al. (2009). Error bars include Poisson noise statistics and field-to-field variance (see text). |
| In the text | |
Current usage metrics show cumulative count of Article Views (full-text article views including HTML views, PDF and ePub downloads, according to the available data) and Abstracts Views on Vision4Press platform.
Data correspond to usage on the plateform after 2015. The current usage metrics is available 48-96 hours after online publication and is updated daily on week days.
Initial download of the metrics may take a while.