Fig. 2
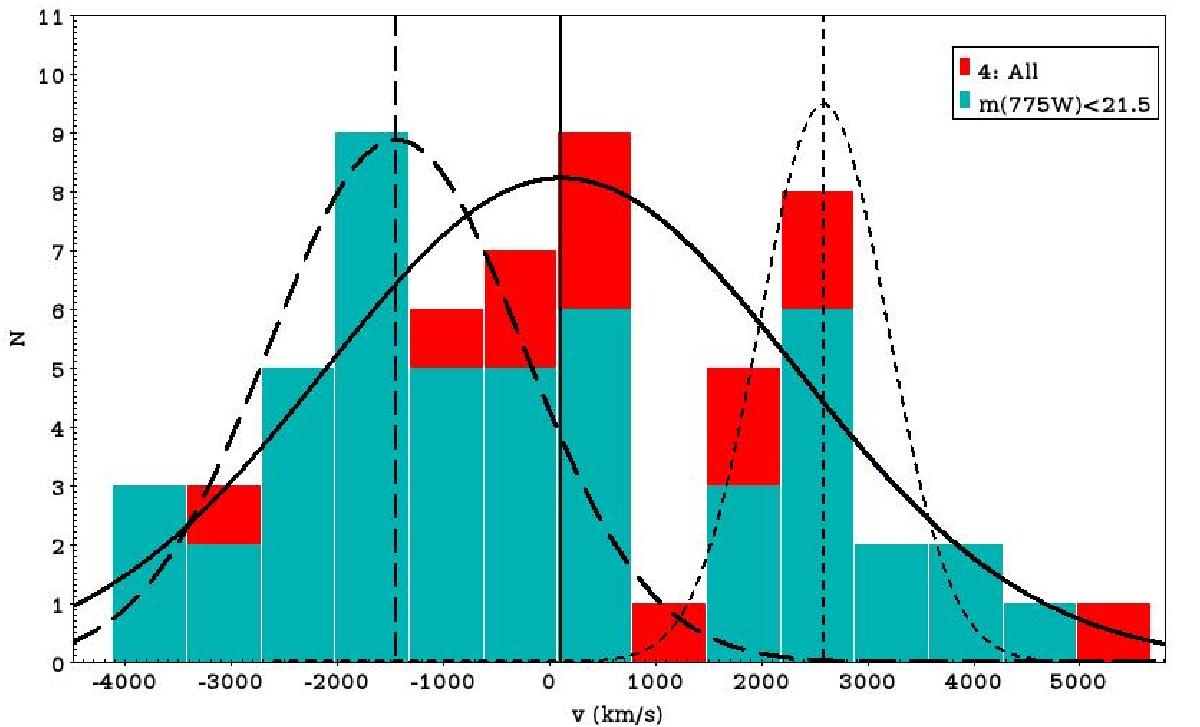
Histogram showing the velocity distribution for the 63 cluster galaxies found in the MUSE field of view with respect to the centroid for the whole distribution (z = 0.1891). Solid lines display the best Gaussian fit to the whole sample. Long and short dashed lines display the best fit to the main cluster component (low-z) and the northeast group (high-z), respectively.
Current usage metrics show cumulative count of Article Views (full-text article views including HTML views, PDF and ePub downloads, according to the available data) and Abstracts Views on Vision4Press platform.
Data correspond to usage on the plateform after 2015. The current usage metrics is available 48-96 hours after online publication and is updated daily on week days.
Initial download of the metrics may take a while.