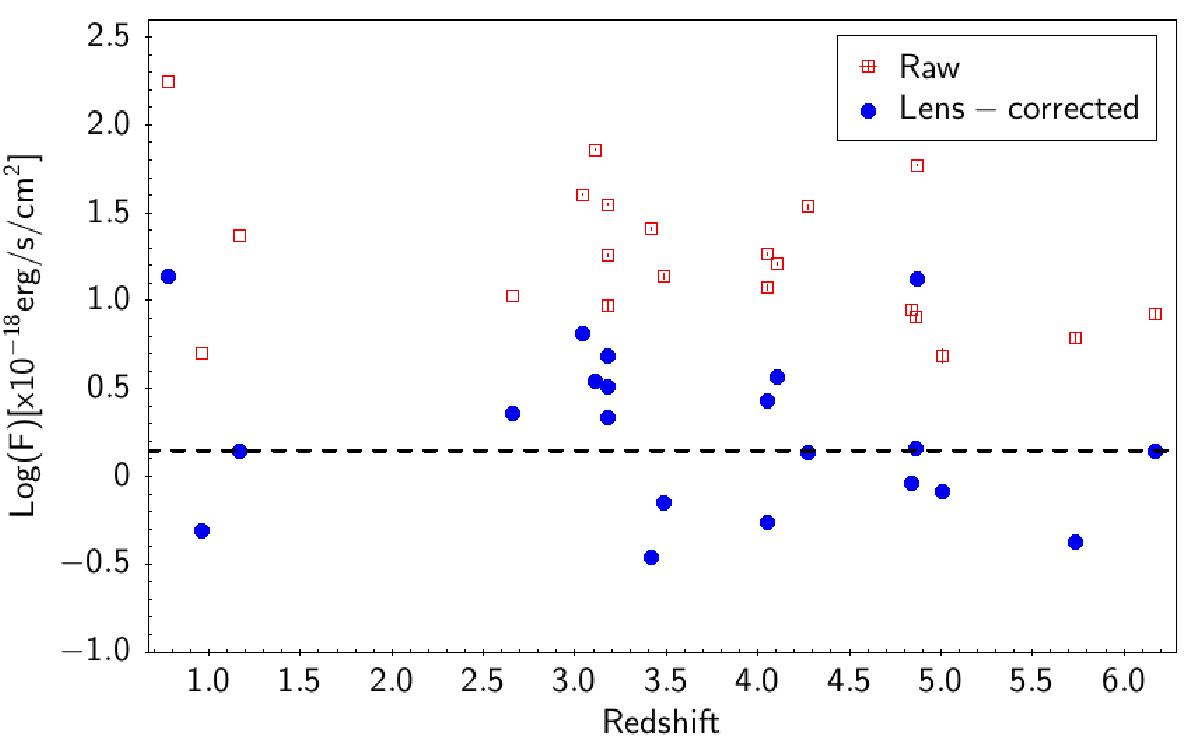
Fig. 5

Distribution of emission-line fluxes measured for the brightest emission-lines versus redshift for the 21 sources found behind A1689, with and without correction for lensing magnification. The lines used are given in Col. 3 of Table 2 (Lyman-α at z ≥ 3). The horizontal dashed line indicates the median lens-corrected flux value. Multiply imaged sources are counted once in this diagram.
Current usage metrics show cumulative count of Article Views (full-text article views including HTML views, PDF and ePub downloads, according to the available data) and Abstracts Views on Vision4Press platform.
Data correspond to usage on the plateform after 2015. The current usage metrics is available 48-96 hours after online publication and is updated daily on week days.
Initial download of the metrics may take a while.


