Fig. 11
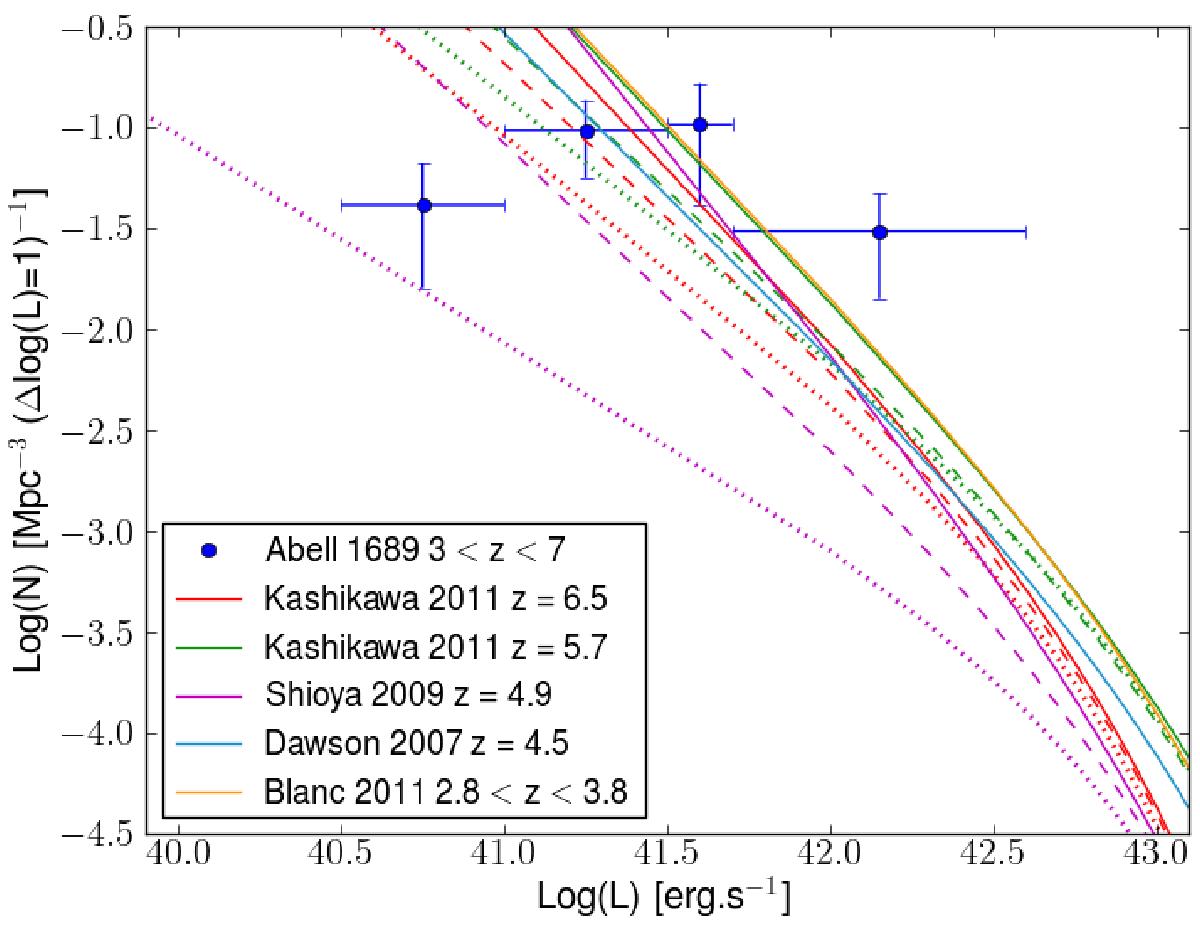
Comparison between the density of sources observed at 3 ≤ z ≤ 7 behind A1689 and expectations based on the extrapolation of the LF toward the low-luminosity regime covered by the present survey. References are given in the figure for different redshifts. Solid lines display the steepest slopes adopted for the LF fit: α = −1.7 for Kashikawa et al. (2011) and Blanc et al. (2011), α = −2.0 for Shioya et al. (2009), and α = −1.6 for Dawson et al. (2007). Dashed and dotted lines correspond to α = −1.5 and −1.3 for Kashikawa et al. (2011) and α = −1.5 and −1.0 for Shioya et al. (2009). Error bars include Poisson noise statistics and field-to-field variance (see text).
Current usage metrics show cumulative count of Article Views (full-text article views including HTML views, PDF and ePub downloads, according to the available data) and Abstracts Views on Vision4Press platform.
Data correspond to usage on the plateform after 2015. The current usage metrics is available 48-96 hours after online publication and is updated daily on week days.
Initial download of the metrics may take a while.