Fig. 1
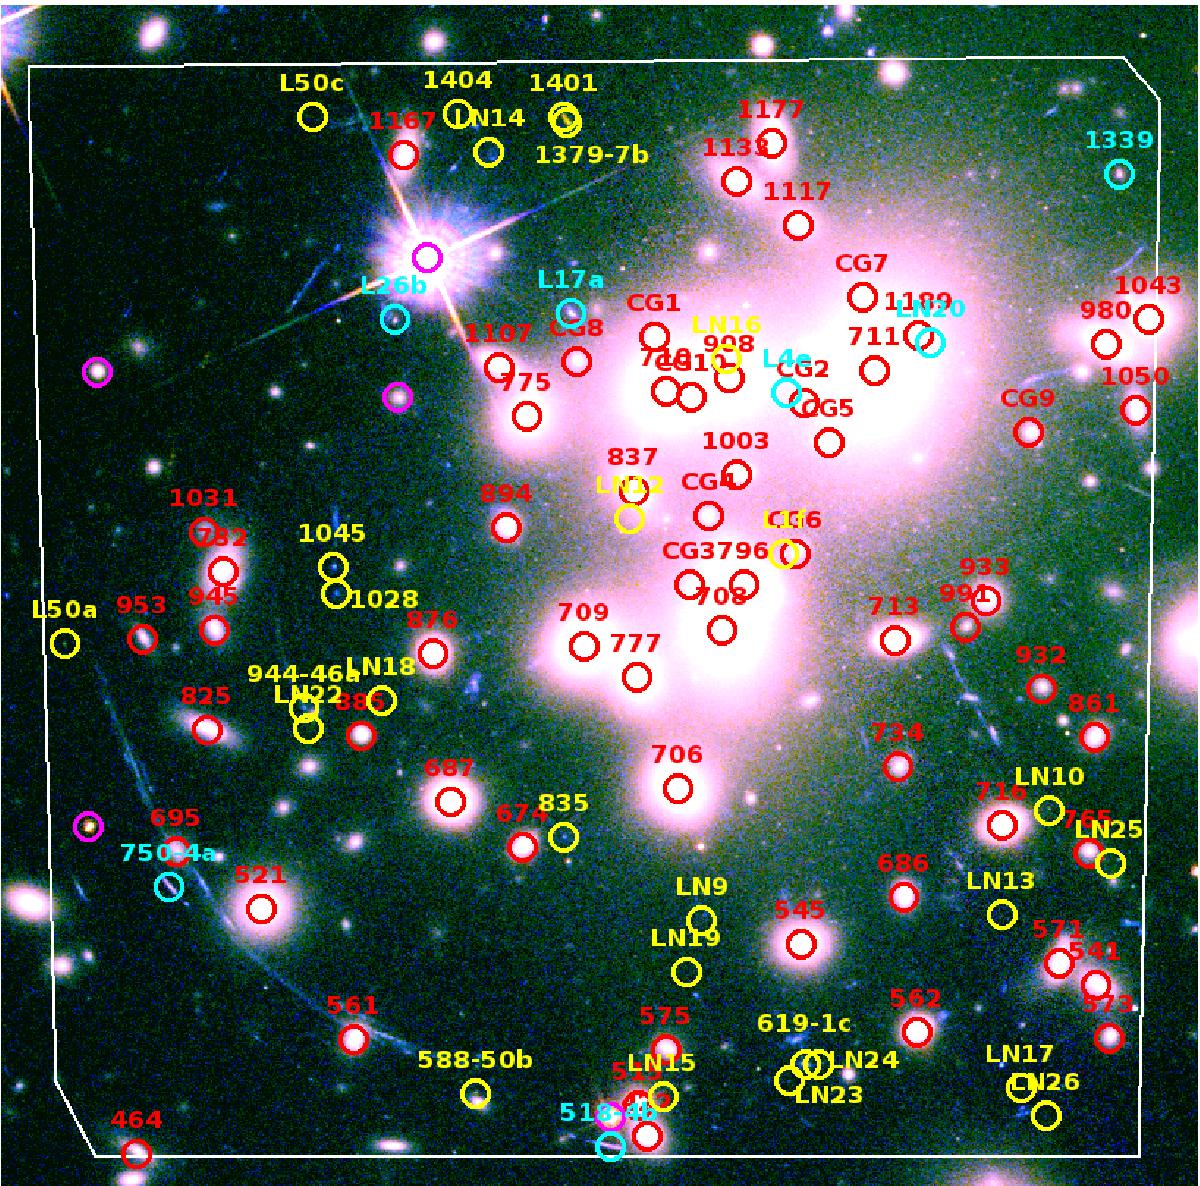
Color image of A1689 obtained by combining F475W, F775W, and F850LP HST/ACS images using a logarithmic scale. The footprint of the MUSE field is displayed together with the sources spectroscopically identified in this field: cluster galaxies (red), stars (magenta), background galaxies at z ≤ 3 (cyan), and z ≥ 3 (yellow). Cluster galaxies that were manually extracted are labeled CG. Objects labeled LN correspond to either line emitters or multiple images lacking a counterpart in the reference catalog based on the F775W image (see text for details). North is up, east is left. A tentative spectroscopic redshift was also obtained for the long southeast arcs in this field, namely 8a and 8b in C10 (see discussion in Sect. 4.1). At the redshift of the cluster, the MUSE field is equivalent to ~185 × 185 kpc.
Current usage metrics show cumulative count of Article Views (full-text article views including HTML views, PDF and ePub downloads, according to the available data) and Abstracts Views on Vision4Press platform.
Data correspond to usage on the plateform after 2015. The current usage metrics is available 48-96 hours after online publication and is updated daily on week days.
Initial download of the metrics may take a while.