Fig. 6
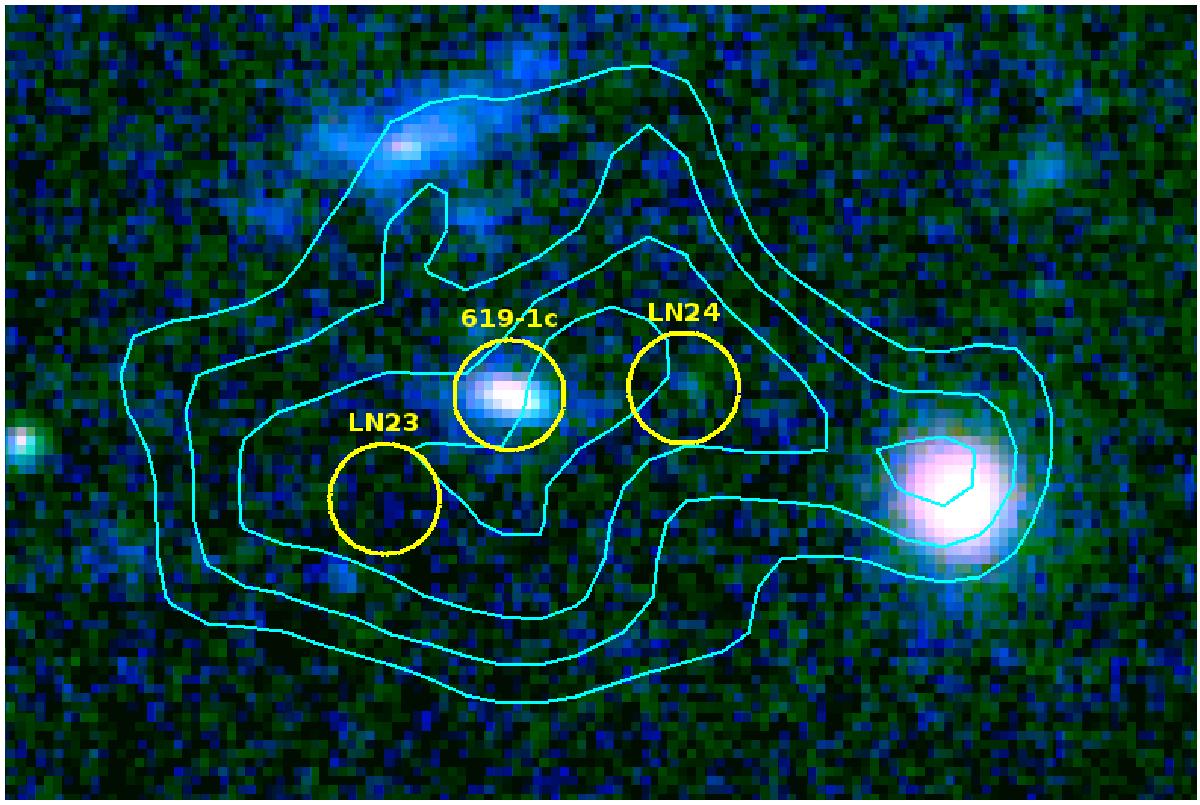
Color image of A1689 obtained by combining F475W, F775W, and F850LP HST/ACS images using a logarithmic scale, showing a 6.3′′× 4.2′′ region around 619(1c) and its extended emission. Circles have diameters of 0.60′′, close to the FWHM seeing measured in the MUSE data. Cyan isocontours display flux levels for Lyman-α emission, from 0.5 to 2 × 10-19 erg/s/cm2/pix2, with bins of 0.5 × 10⁻¹⁹ erg/s/cm2/pix2.
Current usage metrics show cumulative count of Article Views (full-text article views including HTML views, PDF and ePub downloads, according to the available data) and Abstracts Views on Vision4Press platform.
Data correspond to usage on the plateform after 2015. The current usage metrics is available 48-96 hours after online publication and is updated daily on week days.
Initial download of the metrics may take a while.