Fig. 10
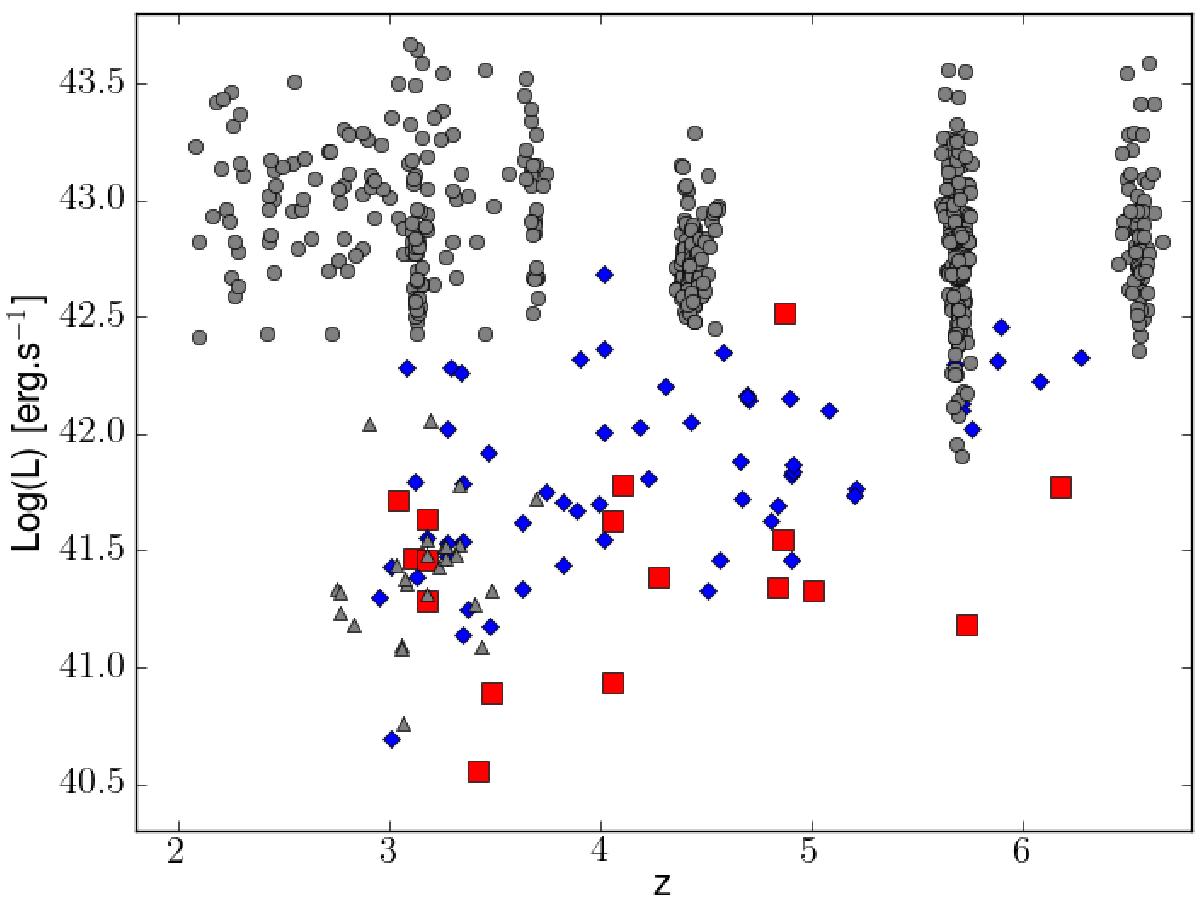
Distribution of lens-corrected Lyman-α luminosities for the 17 galaxies found behind A1689 at 3 ≤ z ≤ 7 (red squares), as compared to Bacon et al. (2015) (blue diamonds), and to a compilation of representative samples of LAE from the literature (gray symbols): 2 ≲ z ≲ 3.8(Blanc et al. 2011) (HETDEX Pilot Survey), 2.7 ≲ z ≲ 3.8 (gray triangles) (Rauch et al. 2008), z ~ 4.9(Shioya et al. 2009), z ~ 5.7(Shimasaku et al. 2006; Ouchi et al. 2008; Henry et al. 2012; Hu et al. 2010), and z ~ 6.5(Ouchi et al. 2010; Hu et al. 2010; Kashikawa et al. 2011).
Current usage metrics show cumulative count of Article Views (full-text article views including HTML views, PDF and ePub downloads, according to the available data) and Abstracts Views on Vision4Press platform.
Data correspond to usage on the plateform after 2015. The current usage metrics is available 48-96 hours after online publication and is updated daily on week days.
Initial download of the metrics may take a while.