| Issue |
A&A
Volume 590, June 2016
|
|
|---|---|---|
| Article Number | A98 | |
| Number of page(s) | 26 | |
| Section | Interstellar and circumstellar matter | |
| DOI | https://doi.org/10.1051/0004-6361/201527652 | |
| Published online | 23 May 2016 | |
A proposed new diagnostic for Herbig disc geometry
FWHM versus J of CO ro-vibrational lines⋆
1 Kapteyn Astronomical Institute Rijks-universiteit Groningen (RuG), Landleven 12, 9747 Groningen, The Netherlands
e-mail: bertelsen@astro.rug.nl
2 Departamento de Astronomía, Universidad de Chile, Casilla 36-D, Santiago, Chile
3 European Southern Observatory, Karl-Schwarzschild-Str.2, 85748 Garching bei München, Germany
4 Anton Pannekoek Astronomical Institute, University of Amsterdam, PO Box 94249, 1090 GE Amsterdam, The Netherlands
5 SRON Netherlands Institute for Space Research, Sorbonnelaan 2, 3584 CA Utrecht, The Netherlands
6 UJF-Grenoble 1/CNRS-INSU, Institut de Planétologie et d’Astrophysique (IPAG) UMR 5274, 38041 Grenoble, France
7 SUPA, School of Physics & Astronomy, University of St. Andrews, North Haugh, St. Andrews KY16 9SS, UK
Received: 27 October 2015
Accepted: 9 March 2016
Aims. The CO ro-vibrational lines observed from Herbig group II discs are often seen to be broad, while the same lines observed from group I discs are often narrow. This difference is not well understood. In this paper we explore the underlying cause for this difference and provide a pathway for a better understanding of the geometry and structure of the inner discs around Herbig Ae/Be stars.
Methods. High spectral resolution infrared spectra of CO ro-vibrational emission from six Herbig Ae/Be candidate stars were taken with the CRyogenic high-resolution InfraRed Echelle Spectrograph (CRIRES) at the Very Large Telescope (VLT). From these spectra, we produce individual and co-added CO ro-vibrational line profiles. We investigate line profile shape differences, and we explore the full width at half maximum (FWHM) variations with J quantum number in the context of disc geometry. Furthermore, we put our new sources into the context of earlier observed sources to study a large sample. For comparison, we also investigate the FWHM variations with J of modelled CO ro-vibrational lines from two typical disc geometries produced with the thermochemical disc modelling code ProDiMo.
Results. For our new observations of CO ro-vibrational lines, we find that the FWHM of individual lines are in the range of 10–60 km s-1. We find both narrow and broad single-peaked emission lines, but only Hen 2-80 displays double-peaked emission lines. For HD 250550, the FWHM of the CO lines increases with J value, indicating a radially extended emitting region, while Hen 2-80 shows a constant FWHM versus J behaviour, indicating a narrow emitting region. This qualitatively agrees with the two different modelled disc geometries. Comparing dust and gas inner disc geometries (inferred by the spectral energy distribution (SED) and CO ro-vibrational emission) for the expanded sample of observed Herbig discs, we find no clear correspondence between the SED (spectral energy distribution) groups of the sources and their inner CO radius.
Conclusions. The FWHM versus J is a potential new gas diagnostic for the inner disc with, for example, a constant FWHM versus J indicating the presence of a large gas hole or gap. Models and observations both indicate the potential of this new diagnostic. Our extended sample does not fully support the previous trend where group I discs have CO ro-vibrational emission lines with small FWHM. Instead, our CO ro-vibrational data from a handful of sources indicates different inner disc geometries for the gas and dust of these sources.
Key words: infrared: stars / line: profiles / circumstellar matter / protoplanetary disks / stars: pre-main sequence
© ESO, 2016
1. Introduction
Infrared CO ro-vibrational emission lines are promising tracers of the geometry and structure of the inner protoplanetary discs. They are routinely detected in ground-based observations of discs around young stellar objects (YSOs) and their line profiles reveal that they originate within a few tens of au from the central star (Carr et al. 2001; Najita et al. 2003; Blake & Boogert 2004; Brittain et al. 2007; van der Plas et al. 2015), coinciding with the region of planet formation.
It has been found empirically that Herbig Ae/Be (HAeBe) stars show two types of spectral energy distributions (SED): Group I, which display a rise in the mid-IR, and group II, which show no rise (Meeus et al. 2001). Group I discs seem to be dominated by large gaps and possibly depleted inner discs. Maaskant et al. (2013) showed – using Q- and N-band imaging and radiative transfer modelling for four HAeBe discs classified as group I from their SEDs – that all four required solutions with a large dust gap separating the inner and outer discs. They finally conclude that many, if not all, group I discs seem to have gaps. Group II discs have more compact discs; there is growing evidence that gaps in the 2 to 10 au range are present (see e.g. Menu et al. 2015).
CO ro-vibrational emission lines from Herbig discs have been studied on several occasions. For example, a recent re-analysis of CRIRES archival data by Banzatti & Pontoppidan (2015) find that Herbig star spectra show single-component line profiles, unlike T Tauri spectra, which often show two distinct components. Observations do not always show symmetric double-peaked line profiles; instead, flat-topped profiles, symmetric or asymmetric single-peaked profiles, profiles with shoulders or other variations have been observed (Blake & Boogert 2004; Brittain et al. 2007; Salyk et al. 2011; Hein Bertelsen et al. 2014; van der Plas et al. 2015). These shapes can occur if the profile is a composite of CO emission coming from both the inner and outer disc if a disc wind is present (Bast et al. 2011; Pontoppidan et al. 2011) or if eccentricities are present in the disc. However, flat-topped profiles can also be a result of low spectral resolution, asymmetries can arise randomly in noisy profiles, and non-Keplerian profile shapes can arise from instrumental effects like slit loss (Hein Bertelsen et al. 2014). Keeping these challenges in mind, the interpretation of CO ro-vibrational line profiles from the HAeBe discs provides a powerful tool for tracing the disc geometry in planet forming environments.
van der Plas et al. (2015) were the first to attempt a statistical analysis of CO ro-vibrational emission lines from a larger sample of Herbig Ae/Be discs, including both group I and group II sources. They found that the CO emission in the discs, classified as group II from the SED, originates much closer to the star than in the discs classified as group I from the SED. Their sample included only four group I discs, limiting general conclusions about the radial origin of CO emission in this type of discs. Additionally, van der Plas et al. (2015) identify a correlation between the excitation mechanism for the CO lines and group I/II classification. The group I discs in the sample had a dominant fluorescent excitation mechanism, indicated by Tvib>Trot, and the group II discs had a dominant thermal (LTE) excitation mechanism, indicated by Tvib ≤ Trot. From the study by Brittain et al. (2007), UV (ultraviolet) fluorescence is an important excitation mechanism in dust-depleted discs, and Maaskant et al. (2013) showed that all group I discs could in fact be discs with gaps. The presence of a gap would force the various CO transitions to be emitted in a narrow region, similar for all J levels, at the inner rim of the outer disc. This might cause the UV fluorescence to become more important. An example of this is the disc around HD 100546 where the CO ro-vibrational emission starts at the inner wall of the outer disc and UV fluorescence is a dominant excitation mechanism (Brittain et al. 2013; Hein Bertelsen et al. 2014). If we consider instead a continuous disc without gaps, the CO transitions can be emitted from a broader region (higher J closer to the star resulting in wider lines, and lower J lines dominated by emission from the outer regions resulting in narrow lines) and allow for the possibility that thermal excitation at small radii becomes more important. The sources from van der Plas et al. (2015), which seem to require fluorescence from Tvib>Trot, are all sources with the full width at half maximum (FWHM) versus J constant.
Our new observations of CO ro-vibrational emission will expand the current sample of Herbig Ae/Be discs (especially group I) and provide the basis for a better understanding of the geometry and structure in the two types of HAeBe discs. This is key when establishing the CO ro-vibrational lines as a tracer of planet forming processes across stars of different masses and evolutionary states. In Sects. 2 and 3 we present our sample and our new observations. In Sect. 4 we describe the details of our data reduction and analysis methods and present our results. In Sect. 5 we discuss the overall trend for the CO emitting region and disc geometry that can be derived from a large sample of observed HAeBes (this paper, Salyk et al. 2011; van der Plas et al. 2015). In Sect. 6 we present CO ro-vibrational emission from two modelled disc geometries for the purpose of comparison, and in Sect. 7 we discuss, for both models and observations, the implications of the FWHM versus J behaviour on the disc geometry and the effects of disc inclination. Finally in Sect. 8 we present our conclusions.
2. Sample
Our sample of sources was selected from the list of HAeBe candidates by The et al. (1994). Preference in the target selection was given to Meeus et al. group I targets as these stars were under-represented in previous studies of CO emission from HAeBe discs. An overview of our sample is shown in Table 1 and background details of the individual sources are discussed in Appendix A. Extinction-corrected SEDs of all stars were constructed from the literature and are shown in Fig. 1. The sources have been given a rough classification based on their position in a diagram of near-IR over total infrared luminosity versus IRAS [12]–[60] colour similar to that in van Boekel et al. (2005; Fig. A.1). With the exception of HD 163296, which is close to the boundary line between the two groups, and T Ori, owing to a lack of IRAS data for this source, all stars in our sample fall within the area occupied by group I discs.
Stellar parameters of the observed sources.
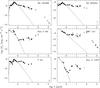 |
Fig. 1 Extinction-corrected SEDs of all sources in our sample. Unreddened Kurucz (1991) photospheric models corresponding to Teff and log g from the literature are fitted to the extinction-corrected observed photometry. Measurements with beam sizes <3′′ are shown as solid dots and measurements with beam sizes >3′′ are shown as open squares. |
3. Observations
High-resolution spectra of ten sources were obtained on March 5 and March 6, 2012, with the VLT CRyogenic high-resolution InfraRed Echelle Spectrograph (CRIRES, Kaeufl et al. 2004). Four of these sources (Hen 2-14, Hen 3-1386, Th 35-101, and V883 Ori) have been rejected as Herbig Ae/Be stars on the basis of a careful literature review and are therefore not discussed further in this paper. A more detailed discussion of these sources can be found in Hein Bertelsen (2015). For each target, the wavelength region from 4.5 μm to 5 μm was covered using 3 or 6 different grating settings (4.6575, 4.7363, and 4.9948 μm and the additional three settings 4.6376, 4.8219, and 5.0087 μm). The observations were made through a slit with a width of 0.2′′ and the telescope was nodded by 10′′ along the slit for every other exposure to subtract the sky emission. Since the CO ro-vibrational lines also occur in the Earth’s atmosphere, we chose to perform the observations at a time when the velocity shift of our individual targets would be as large as possible for most of the targets. Furthermore, we observed nearby telluric standard stars immediately after or before each target to remove the telluric absorption lines. Flat fields were collected during the daytime (within 12 h of the science observations). See Table 2 for the summary of the observations.
Log of our CRIRES observations.
4. Data reduction and analysis
The science data were reduced using version 2.2.1 of the CRIRES data reduction pipeline1. The observations were done in nodding mode. The spectra are nodded between two positions (A and B) 10′′ apart on the sky in the pattern ABBA so that the source is in different positions on the chip. The sky emission was removed by subtracting the nodded A and B spectra. One-dimensional spectra were extracted at each grating setting for each individual source. The optimal extraction method2 was used. The spectra of the telluric standard stars were reduced in the same way. The telluric standard star spectra were divided by a corresponding stellar atmosphere model of Kurucz (including line opacities) to determine the instrument response function and atmospheric transmission curve. The optical depth of the telluric lines was then scaled to the depth of the science target and small adjustments in the wavelength were applied when needed. These adjustments in optical depth and wavelength are done by minimising the telluric residuals. This corrects for the small differences in wavelength calibration and atmospheric parameters between the science spectrum and the telluric standard. As a last step in the data reduction process, the science spectra were divided by the response function of the corresponding standard star (examples of the final telluric corrected science spectra can be seen in Figs. B.1 and B.2).
4.1. Flux calibration
We calibrated the continuum level of our sources to the corresponding spectroscopic standard (the collected telluric standards). For the standard stars we collected the W2 magnitudes (λc = 4.60 μm) from the WISE all-sky catalogue: HR6527 (mM = 2.050 ± 0.103 mag), HR4730 (mM = 1.671 ± 0.025 mag), and HR2421 (mM = 1.521 ± 0.037 mag). Using these values, the continuum flux at 4.6 μm of the three standard stars is respectively, 25.83 Jy, 36.62 Jy, and 42.05 Jy. There are small differences in the widths of the point spread function for the science spectra and the telluric standard spectra (we expect these differences to be due to variations in the performance of the adaptive optics system). We do not correct for these differences, but note here that the error expected from these differences in our flux calibration is <10%. Furthermore, when viewing the full spectra for each source there are inconsistent variations in continuum level at different wavelength settings (or detectors) for overlapping or neighbouring regions. These variations are at the 10% level. We apply flux shifts to the frames where this is needed to make the full spectrum fit one consistent continuum curve.
4.2. Line detection
All of our observed sources have clear detections of H i recombination lines in emission: Pfund β 7-5 and the Humphreys ϵ 11-6 line. For these lines, individual line profiles are shown in Fig. B.3. The FWHM, the line centres, and the derived doppler shifts, together with the 3σ error bars are shown for all sources in Table B.1. Spectra from four of our sources (HD 163296, HD 250550, Hen 2-80, Hen 3-1227) also show clear detections of CO ro-vibrational emission lines. The CO emission from these four sources is not spatially resolved (for more details on spatially resolving emission with CRIRES see van der Plas et al. 2015). CO ro-vibrational emission lines could also be present in MWC 137. The spectrum shows what appears to be many wide and often blended emission lines.
For the four sources with CO detections, individual CO lines were identified and extracted using wavelengths from Chandra et al. (1996). For each source certain wavelength settings overlap, resulting in a few lines being detected twice. Furthermore, in the cases of Hen 2-80 and Hen 3-1227 we collected observations during two nights with the same wavelength settings. These doubly collected lines can be used for sanity checks and uncertainty estimates. For the further analysis we consider our line selection carefully. Some lines are contaminated by telluric residuals and some lines are blended and cannot be separated for individual profile extraction. We thus manually select the best uncontaminated and unblended lines for further analysis (Table C.1).
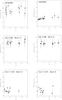 |
Fig. 2 FWHM as a function of Jup for the v = 1–0 emission lines observed from our four CO detected sources. The source names are indicated on the plots. In the middle and bottom rows FWHM collected for Hen 2-80 and Hen 3-1227 are shown for March 5, 2012 (left) and March 6, 2012 (right). The error bars are based on the variation that occurs in the FWHM when using the standard deviation of the nearby continuum as uncertainty for the continuum placement when fitting a Gaussian. In a few cases, where the lines are very narrow, this approach leads to errors smaller than the plotting symbols. |
4.3. CO line profiles
The CO ro-vibrational lines selected for analysis, are listed in Table C.1 (and Figs. C.1 to C.4). To quantify the line shape variations for each source, we show plots of FWHM versus Jup in Fig. 2. The FWHM plotted here is the FWHM of the fitted Gaussian. A Gaussian does not always match the detailed line shapes well (but here a good line shape match is in fact obtained in all cases except for Hen 2-80), nonetheless it is a good and consistent measurement of the width because the entire line profile is evaluated to derive a FWHM. A manual measurement of the FWHM would be dependent on a personal choice of the maximum location and hence difficult to reproduce. For HD 250550, we fit a two-component Gaussian (a central main component and a smaller blue shifted component) owing to the presence of a shoulder on the blue side of the profile. The FWHM values in Fig. 2 are those from the main Gaussian. We do not show the FWHM of the secondary component since we are interested in emission from the disc and the origin of the secondary component is unknown.
The error bars in Fig. 2, for all sources, are based on the variation in FWHM when shifting the continuum by using the standard deviation of the nearby continuum (for each line). The Gaussian overestimates the error for the FWHM of Hen 2-80. For Hen 3-1227, the error is underestimated owing to the very narrow and peaky shape of the Gaussian.
From the FWHM versus J plots, we see that only the lines from HD 163296 and HD 250550 show differences in line profile shape through the line samples. To assess whether a correlation between FWHM and J-value is present for any of the sources, we used the Astronomy SURVival analysis (ASURV) code (Isobe et al. 1986), to perform Kendall’s Tau test for each CO detected source. For HD 250550 we found a probability below 10-4 that a correlation is not present (even if we disregard the three high J lines a correlation is still highly probable), while the other three sources (HD 163296, Hen 2-80, and Hen 3-1227) show probabilities of 70%–84% that a correlation is not present. Thus, there is a very strong correlation between FWHM and J-value in the data from HD 250550.
In Fig. 3 we show the medians of the v = 1–0 lines from each source. For HD 250550, splitting high and low J into two separate medians is useful since the FWHM increases with J. For HD 163296, the FWHM does not have a clear correlation with J; however, the shape of the single peak is asymmetric for high J lines, while symmetric for low J lines. Hence, even though there is no significant change of the FWHM over J (within error bars or as shown by the Kendall’s Tau test), we also split the high and low J into two separate medians for HD 163296. For the last two sources (Hen 2-80 and Hen 3-1227) high and low J medians do not show any significant differences; instead, separate medians (including all J) from the two observation nights are shown. In Table 3 we show the FWHM results from the line profile analysis and in Tables C.2 to C.8 we show line fluxes for all the collected lines.
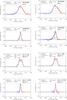 |
Fig. 3 Normalised median of all 12COv = 1–0 lines observed from the four sources where CO is detected. The source names are indicated on the plots. In the first two rows (for HD 163296 and HD 250550), we show low J (J< 10) medians on the left and high J (J> 20) medians on the right. In the lower two rows (for Hen 2-80 and Hen 3-1227), we show medians for all J collected on two separate nights: March 5, 2012, on the left, March 6, 2012, on the right. In all frames, the solid black line shows the Gaussian fit, the red dashed line is the centre of the Gaussian or zero velocity, and the red- and blue-shifted side of the line profile are indicated with red and blue lines, respectively. The FWHM of the Gaussian is printed at the top left of each frame together with the ratio of the integrated red and blue side of the line. For Hen 2-80 the peak separation of the median is also shown. For HD 250550 the sum of the two Gaussians is shown as a dotted black line. |
Results from the line profile analysis.
5. Discussion of the observational sample
5.1. CO emitting region and disc classification
Table 4 presents an overview of observed properties from the discs in our sample, the discs in the sample by van der Plas et al. (2015), and discs from Salyk et al. (2011).
Source overview from this work and the literature.
A trend discussed by van der Plas et al. (2015) is the tendency for group II discs to be emitting CO ro-vibrational emission from the dust sublimation radius (wide profiles) and group I discs to be emitting from much further out (narrow profiles). To explore this trend, we plot in Fig. 4 the 10% inner radius of the CO emission, RCO10%, versus the 30/13.5 μm continuum flux for the sources listed in Table 4. The F30/13.5 ratio measures the mid-IR excess slope seen in the SEDs, and separates discs that are classified as group I or group II into two regions. Group I discs are seen to fall above the F30/13.5 = 2.1 limit, while discs classified as group II are seen to fall below this limit (Maaskant et al. 2014; Acke et al. 2010). This scheme is in agreement with the classification from the LNIR/LIR versus [12]–[60] colour diagram, but we only have the F30 /F13.5 ratio for two of our observed sources (HD 163296 and HD 250550). The reason we use the F30 /F13.5 ratio here (instead of the LNIR/LIR versus [12]–[60] colour diagram) is that it offers us a simple way to display in one diagram the comparison between group I/group II classification and inner radius of the CO ro-vibrational emitting region. The 10% inner radius of the CO emission, RCO10%, is an estimate for where the onset of the CO emission is located; it is derived from the half width at 10% of the maximum (HW10M) in the median line profiles 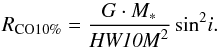 (1)Here G is the gravitational constant, M∗ is the stellar mass, and i is the inclination of the disc. The HW10M are calculated from the Gaussian fits. If we exclusively consider the van der Plas sample, there was indeed a sharp jump in radii for the onset of CO emission (with only one exception, HD 135344B) when comparing group I and group II discs (left and right of the dashed line in Fig. 4). When the new sources from our own sample and those from Salyk et al. (2011) are also considered, the previously found sharp jump disappears. Three more sources (four in total) with CO emitting regions close to the star fall in the regime of discs classified as group I from the SED. Thus, comparing a larger sample of sources (e.g. Salyk et al. 2011; van der Plas et al. 2015, and this paper) leads to a much more diverse picture from these discs than seen from a smaller sample, i.e. the van der Plas et al. (2015) sample alone. The distribution of group I and II sources over RCO10% is very similar except for the three sources with RCO10%> 6 au. These three sources are, interestingly, the sources for which van der Plas et al. (2015) have found evidence for fluorescence shown by vibrational CO temperatures that are much larger than the rotational values (Tvib ≫ Trot).
Discs whose gas diagnostics do not correlate with their SED group classification could be discs where the radial dust and gas distribution differ. These kind of cases have been noticed before. Fedele et al. (2008) found evidence of discs flared in the gas, but self-shadowed in the dust when comparing [O i] emission and 10 μm dust emission (vertically different distribution of dust and gas). Brown et al. (2009) resolved dust gaps in three discs (HD 135344B, LkHα 330, SR 21N) with continuum observations (880 μm), while gas observations (CO, 4.7 μm) show that gas is still present in the inner regions of the same discs. Furthermore, PAHs (polycyclic aromatic hydrocarbons) are observed from within dust gaps (Maaskant et al. 2014) and ALMA observations also reveal gas in dust depleted regions (e.g. Casassus et al. 2013; Bruderer et al. 2014). The presence or absence of a dust gap cannot necessarily be deduced from the SED alone (see e.g. RY Tau, Isella et al. 2010), hence, imaging data could be useful to help clarify the geometry of the dust in the inner disc. In addition, comparisons between SED and gas lines from other sources that seem to show dust/gas radial de-coupling could also add to our understanding.
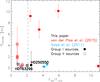 |
Fig. 4 RCO10% versus the 30 μm over 13.5 μm continuum flux from this study (black) and from the studies by van der Plas et al. (2015; red) and Salyk et al. (2011; blue). Group I discs are plotted as filled squares while group II discs are plotted as open squares. |
5.2. Silicate features and disc geometry
In the following, we compare the inner dust radii based on SED classification with those found for the CO ro-vibrational emission. In Table 4, we identify six sources where these two do not agree. Five group I sources show CO ro-vibrational transitions emitted from close to the star (<2 au, smaller than typical group I dust gap/hole sizes), and one group II source shows CO emission from 4.2 au, which is well beyond the dust condensation radius.
Out of the five group I sources which show RCO10%< 2 au, three are labelled group Ia and one is labelled group Ib. Group Ia sources display emission features due to amorphous and crystalline silicates in their mid-IR spectra, whereas group Ib sources do not have these features. Group II sources are in this context all labelled group IIa since they all have silicate features. Thus, three of the sources that are inconsistent in SED classification and onset radii for CO show a prominent silicate feature.
Maaskant et al. (2013) and Khalafinejad et al. (2016) have shown that the presence of large gaps or holes in the inner discs will cause these silicate features to disappear. Consequently, the presence of a prominent silicate component observed from group Ia sources could indicate a gap/hole small enough to keep the dust at temperatures required for the silicate emission feature. HD 100546 and HD 179218 are two group Ia sources with a confirmed gap and a detection of the silicate feature. In HD 100546 this feature arises from the wall at 10–13 au; in HD 179218, the inner radius of the outer disc component is ~15 au (Fedele et al. 2008). On the other hand, Khalafinejad et al. (2016) found a very weak tentative detection of silicate emission features from HD 100453, i.e. a source on the border of a group Ia/Ib identification. This disc has a larger gap of ~17 au and thus lower temperatures (T ~ 160 K) in the inner regions of the outer disc. The distance of the inner wall of the outer disc can thereby be critical for the presence of a silicate feature, or conversely, the presence or absence of this feature may distinguish between small and large dust gaps/holes in group I sources. In the following paragraphs we use the above discussion to devise a finite set of possible inner disc geometries from the SEDs and RCO10%.
In Fig. 5, we sketch four possible inner disc geometries and link them to the SEDs: (a) a no-hole disc with silicate features present (group IIa SED); (b) a disc with a large hole and no silicate features (group Ib SED); (c) a disc with a small hole and silicate features present (group Ia SED), and d) a disc where the radial dust and gas distribution differs (group I SED). Depending on the size of the dust hole, silicate features may or may not be present.
In the general view, group I sources with broad CO lines detected could be interpreted in one of two ways: (1) These discs have small dust+gas gaps/holes meaning that silicate features should be detectable and that CO lines are emitted from the disc wall beyond the small gap/hole (sketch c in Fig. 5) or (2) These discs have gaps/holes only in the dust and therefore display group I behaviour in the SED, while CO lines are emitted from inside the dust gap. The dust and gas are in this case distributed differently (sketch d in Fig. 5). HD 250550, AB Aur, and MWC 758 (all group Ia sources) are consistent with the first interpretation since they have silicate features present. For Hen 2-80, the presence of the silicate feature is unknown. For this source both interpretations are possible. Observations of the silicate feature would thus be very helpful to place this object into the above suggested scheme. HD 135344B, however, is labelled as a group Ib source and thus has no silicate features, implying that the dust gap is large. Thus, the onset of CO emission close to the star seems to require gas to be present within the large gap (30 au, Maaskant et al. 2013), and the second interpretation is more likely here. Meanwhile, Carmona et al. (2014) recently constrained the structure of this disc with modelling, using multiwavelength gas and dust observations, and indeed concluded that the CO emission originates inside the gap.
HD 98922 is the only group II source where CO is emitted further out than expected, ~4.2 au. However, considering the high luminosity of the central star (~890 L⊙) the inner dust rim could be further out than typically seen for group II sources, consistent with the onset of the CO emission. Unless the gas surface density is strongly depleted (CO column densities NCO< 1015 cm-2), CO can survive the harsh UV radiation field of the star, because the dissociating bands become optically thick. For example, CO bandhead emission at 2.3 μm is frequently seen in the inner discs (inside 10 au) of young massive stars with L∗> 103L⊙ (e.g. Ilee et al. 2014). However, the interpretation based on the high luminosity hinges on the distance, which is not well determined; in addition, HD 98922 could also be a spectroscopic double star (Blondel & Djie 2006). Gaia should clarify this issue soon.
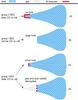 |
Fig. 5 Possible disc geometries: a) a continuous disc without a hole/gap, resulting in a group II SED with silicate features and broad CO ro-vibrational lines emitted from close to the star; b) a disc with a large hole, resulting in a group I SED without silicate feature (group Ib) and with narrow CO ro-vibrational lines emitted from the outer disc wall; c) a disc with a small hole, resulting in a group I SED with silicate feature (group Ia) and with broad CO ro-vibrational lines emitted from the outer disc wall (in this case close to the star); and d) a disc with a small or large dust hole, resulting in a group I SED (with or without silicate features) and broad CO lines. The radial gas distribution differs from that of the dust and the CO lines are thus emitted from within the hole. |
6. Modelling
To support the discussion of the link between disc geometry and FWHM of the CO ro-vibrational lines, we explore modelled CO ro-vibrational lines from two distinctly different inner disc geometries (a disc with a gap and a disc without a gap) produced from two pre-existing ProDiMo models (presented as examples of geometries and not meant to specifically match any of the observed discs in our sample). With these models we produce samples of CO ro-vibrational lines to tentatively test the connection between inner disc geometry and FWHM versus J behaviour.
ProDiMo is a thermo-chemical disc code that solves the gas heating and cooling and the gas chemistry self-consistently (Woitke et al. 2009). The two models are parametrised disc structures originating from the radiative transfer codes MCFOST (Pinte et al. 2006, 2009) and MCMax (Min et al. 2009). MCFOST and MCMax are three-dimensional Monte Carlo continuum radiative transfer codes that calculate the dust temperature and continuum radiation field in the disc. The coupling between ProDiMo and MCFOST or MCMax is explained in Woitke et al. (2010). To model the CO ro-vibrational lines with ProDiMo we use the complete CO ro-vibrational molecular model described in Thi et al. (2013).
The first model is a flaring disc without a gap (Model #1): We run ProDiMo on top of a previously published MCMax model that was fitted to the Q- and N-band images of the disc around HD 97048 (Maaskant et al. 2013). In that study Maaskant et al. (2013) modelled a series of discs without and with gaps of varying size to assess the need for gaps to match the observed SED and images. Model #1 is a ProDiMo model run on top of the continuous disc model (no gap) from Maaskant et al. (2013), and with the PAH abundance set to fPAH = 0.7.
The second model is a flaring disc with a gap from 4–13 au (Model #2): We use a previously published model computed for the disc around HD 100546 (Thi et al. 2011; Hein Bertelsen et al. 2014). This is a ProDiMo model on top of an MCFOST dust model (Tatulli et al. 2011; Benisty et al. 2010) constrained by the observed SED and near- and mid-IR interferometric data. For this disc, UV fluorescence has been identified as the dominant excitation mechanism, and the CO ro-vibrational emission starts at the outer disc wall. The gas density distributions for both models are shown in Fig. 6, and their key parameters are listed in Table 5. For more details on the two models, see Maaskant et al. (2013) and Hein Bertelsen et al. (2014).
Key parameters of the two modelled disc geometries.
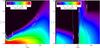 |
Fig. 6 Gas density distribution of the two disc models. Model #1 is on the left and model #2 is on the right. Contour lines showing Tgas = 2000 K (white), min(Av,ver,Av,rad) = 1.0 (minimum of the radial and vertical dust extinction) (black), and the CO abundance of 10-5 (red) are overplotted. |
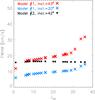 |
Fig. 7 FWHM as a function of Jup for v = 1–0 emission lines collected from Model #1, a Herbig Ae/Be ProDiMo model with the inner disc starting at 0.3 au (two different inclinations shown), and Model #2 of the disc HD 100546, a disc with a gap. |
7. Comparison of models and observations
7.1. FWHM versus J
To investigate the FWHM versus J behaviour for the CO ro-vibrational lines in different disc types, we use the two modelled examples of disc geometry. These two models show profoundly different FWHM versus J behaviour (Fig. 7). For model #1 (disc without a gap), the FWHM grows steadily with J similar to the behaviour observed for HD 250550. For model #2 (gap at 4–13 au), no J dependence is seen for the FWHM of the lines. The width is constant for all transitions, indicating that the emission is always coming from the same narrow region, similar to the behaviour observed for Hen 2-80. For both models we performed tests, switching off the UV fluorescence. There are no significant changes in line fluxes for Model #1; thus, UV fluorescence has no impact on the line fluxes in this modelled flaring disc without a gap. For Model #2, UV fluorescence has a large impact on the line fluxes of the higher v-bands (vu> 1). This can be explained by the fact that there is no CO gas at temperatures of thousands of Kelvin (due to the lack of CO in the inner 10 au), which are needed to excite CO to the higher v-bands via thermal excitation. UV fluorescent excitation, however, can occur at any gas temperature. Thus, for the modelled disc with a gap, UV fluorescence is an important excitation mechanism. From these two models, we see that UV fluorescence does not always affect line fluxes in flaring discs. However, links between constant FWHM versus J behaviour, the presence of a dust gap, and the excitation mechanism could be possible. This would be consistent with the conclusions of the study by Brittain et al. (2007) who found that UV fluorescence can be an important excitation mechanism in dust-depleted discs and the study of Maaskant et al. (2013) who found evidence that discs classified from the SED as group I might all be discs with gaps.
We can split our sample of sources in Table 4 in half if we choose  au. Six out of eight sources with RCO10%> 1 au show constant FWHM versus J behaviour, while this is true only for two out of eight sources with RCO10%< 1 au. One of these two sources is HD 163296 for which Blake & Boogert (2004) and Salyk et al. (2011) find strong profile differences between low and high J lines (single-peaked versus double-peaked). From a comparison between NIRSPEC and CRIRES spectra taken ten years apart, Hein Bertelsen et al. (2016) have found possible variability related to a disc wind component in the CO ro-vibrational line profiles; this will affect the FWHM measurements. The other source is AB Aur where the high J lines are systematically wider than the low J lines, but within the error bars the source is consistent with a constant FWHM versus J behaviour. Spectra with higher S/N are needed to clarify this case. The two sources showing increasing FWHM versus J while having RCO10%> 1 au are HD 98922 and HD 95881. The stellar luminosity of HD 98922 (log L = 2.95) can push the dust condensation radius much further out than in normal Herbig discs (see Sect. 5.2). We conclude that this trend in FWHM versus J bears additional diagnostic value and we will investigate it further in an upcoming modelling paper.
7.2. Disc inclination
The single-peaked shape and the narrow FWHM of lines from e.g. HD 250550 or Hen 3-1227 could be connected to a low inclination of the discs. With Model #1, we tested the line behaviour for different inclinations. The vsep versus inclination behaviour for a high and a low J modelled line is shown in Fig. 8. At low inclination the peak separation drops below the instrument detection limit and we would observe a single peak. In Fig. 7 we also see that low inclination yields smaller FWHM and an overall flatter FWHM versus J behaviour. An inclination of <35° could already produce single-peaked line profiles for low J lines, but the model indicates that an inclination of <20° is necessary in order to also see the higher J lines as single peaks.
An inclination of this size is consistent with the inclination assumed for HD 250550 by Fedele et al. (2011). However, at such low inclinations, the FWHM of the lines in the model become much smaller than observed for HD 250550 (Fig. 7). If the single peaks from HD 250550 are due to low inclination, the CO emission needs to start very close to the star (with the main contribution from this region), in order to be consistent with the observed FWHM of 15–20 km s-1. Model #1 has an extended emitting region for the CO; ~30% of the line flux comes from 20–70 au for low J lines and ~20% of the line flux comes from 20–50 au for high J lines. HD 250550 could also have an extended emitting region since the FWHM versus Jup behaviour shows a steady increase in FWHM with J level just like the model (Fig. 7). In the model, this extended emitting region means that the peak separation of low J lines becomes quite narrow already at higher inclinations. Another explanation for the single-peaked line profiles could be the presence of a slow molecular wind component in the line profiles (see e.g. Bast et al. 2011; Pontoppidan et al. 2011).
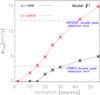 |
Fig. 8 Inclination versus peak separation for a modelled v(1–0)R6 line and v(1–0)R35 line from a flaring disc model with no gap (Model #1). |
8. Conclusions
We have collected high-resolution IR spectra from six additional Herbig Ae/Be stars and have confirmed detections of CO ro-vibrational emission lines from four of these sources (HD 163296, HD 250550, Hen 2-80, and Hen 3-1227).
For HD 250550, the FWHM of the CO lines increases with J value, suggesting an extended emitting region that moves closer to the star for higher J levels. Hen 2-80 shows a constant FWHM versus J behaviour, suggesting that all transitions are emitted from the same narrow region. Results from two modelled disc geometries suggest a connection between dust gaps in the inner disc and a constant FWHM versus J behaviour (possibly connected to a dominant fluorescent excitation mechanism), while an increasing FWHM versus J behaviour could be connected with a continuous disc without a gap (possibly connected to a dominant thermal excitation mechanism). This could eventually turn into an additional observational diagnostic. If the FWHM increases steadily with J, the gas would be continuously distributed in a disc reaching from the dust sublimation radius to the maximum allowed by the excitation mechanism. Meanwhile, if the FWHM stays constant and the line is fairly narrow, it could suggest a gap/hole since large parts of the region, where the lines normally originate, are missing. Consequently the emitting area becomes very small and the same for all lines. This would be consistent with the interpretation of group I discs as discs with gaps (Maaskant et al. 2013).
Our observed sample together with previously observed sources does not support the simple dichotomy where discs labelled group I from the SED have narrower CO ro-vibrational emission lines, i.e. are emitting further out in the disc. Many group I discs do have narrow profiles, but several exceptions exist. We suggest that these exceptions might represent cases where either gas and dust are radially not co-spatial or the gap in the disc responsible for the group I classification is small (silicate features detected).
Further investigations, such as additional examples of observed discs that show increasing FWHM versus J for the CO ro-vibrational lines, complementary data from HD 250550 that can reveal or exclude the presence of a dust gap, data to clarify the inclination of HD 250550, and detailed modelling are required to better understand both the trend of FWHM versus J behaviour, its link with disc geometry (flat, flaring, gap, no gap), and the suggested spatial decoupling of dust and gas (dust gap versus dust+gas gap). The significance of these mechanisms for the appearance of the CO ro-vibrational lines will be investigated in a modelling grid in a forthcoming paper.
Acknowledgments
The authors thank the ESO staff on Paranal for their help in the observations on which this paper is based. The authors thank the anonymous referee for a careful report that helped to improve the paper. The authors thank Andres Carmona for many interesting discussions and for sharing spectra of the OI line observed from Hen 2-80. The authors thank Koen Maaskant for supplying the MCMax model for HD 97048. I.K., W.F.T., and P.W. acknowledge funding from the EU FP7-2011 under Grant Agreement No. 284405. G.v.d.p. acknowledges support from the Millennium Science Initiative (Chilean Ministry of Economy) through grant Nucleus P10-022-F and also acknowledges financial support provided by FONDECYT following grant 3140393.
References
- Acke, B., & van den Ancker, M. E. 2004, A&A, 426, 151 [NASA ADS] [CrossRef] [EDP Sciences] [Google Scholar]
- Acke, B., & van den Ancker, M. E. 2006, A&A, 457, 171 [NASA ADS] [CrossRef] [EDP Sciences] [Google Scholar]
- Acke, B., Bouwman, J., Juhász, A., et al. 2010, ApJ, 718, 558 [NASA ADS] [CrossRef] [Google Scholar]
- Acker, A., Chopinet, M., Pottasch, S. R., & Stenholm, B. 1987, A&AS, 71, 163 [NASA ADS] [Google Scholar]
- Banzatti, A., & Pontoppidan, K. M. 2015, ApJ, 809, 167 [NASA ADS] [CrossRef] [Google Scholar]
- Barbier-Brossat, M., & Figon, P. 2000, A&AS, 142, 217 [NASA ADS] [CrossRef] [EDP Sciences] [Google Scholar]
- Bast, J. E., Brown, J. M., Herczeg, G. J., van Dishoeck, E. F., & Pontoppidan, K. M. 2011, A&A, 527, A119 [NASA ADS] [CrossRef] [EDP Sciences] [Google Scholar]
- Benisty, M., Tatulli, E., Ménard, F., & Swain, M. R. 2010, A&A, 511, A75 [NASA ADS] [CrossRef] [EDP Sciences] [Google Scholar]
- Blake, G. A., & Boogert, A. C. A. 2004, ApJ, 606, L73 [NASA ADS] [CrossRef] [Google Scholar]
- Blondel, P. F. C., & Djie, H. R. E. T. A. 2006, A&A, 456, 1045 [NASA ADS] [CrossRef] [EDP Sciences] [Google Scholar]
- Bouret, J.-C., Martin, C., Deleuil, M., Simon, T., & Catala, C. 2003, A&A, 410, 175 [NASA ADS] [CrossRef] [EDP Sciences] [Google Scholar]
- Brittain, S. D., Simon, T., Najita, J. R., & Rettig, T. W. 2007, ApJ, 659, 685 [NASA ADS] [CrossRef] [Google Scholar]
- Brittain, S. D., Najita, J. R., Carr, J. S., et al. 2013, ApJ, 767, 159 [NASA ADS] [CrossRef] [Google Scholar]
- Brown, J. M., Blake, G. A., Qi, C., et al. 2009, ApJ, 704, 496 [NASA ADS] [CrossRef] [Google Scholar]
- Bruderer, S., van der Marel, N., van Dishoeck, E. F., & van Kempen, T. A. 2014, A&A, 562, A26 [NASA ADS] [CrossRef] [EDP Sciences] [Google Scholar]
- Canto, J., Rodriguez, L. F., Calvet, N., & Levreault, R. M. 1984, ApJ, 282, 631 [NASA ADS] [CrossRef] [Google Scholar]
- Carmona, A., van den Ancker, M. E., Audard, M., et al. 2010, A&A, 517, A67 [NASA ADS] [CrossRef] [EDP Sciences] [Google Scholar]
- Carmona, A., Pinte, C., Thi, W. F., et al. 2014, A&A, 567, A51 [NASA ADS] [CrossRef] [EDP Sciences] [Google Scholar]
- Carr, J. S., Mathieu, R. D., & Najita, J. R. 2001, ApJ, 551, 454 [NASA ADS] [CrossRef] [Google Scholar]
- Casassus, S., van der Plas, G., M, S. P., et al. 2013, Nature, 493, 191 [NASA ADS] [CrossRef] [Google Scholar]
- Chandra, S., Maheshwari, V. U., & Sharma, A. K. 1996, A&AS, 117, 557 [NASA ADS] [CrossRef] [EDP Sciences] [Google Scholar]
- de Gregorio-Monsalvo, I., Ménard, F., Dent, W., et al. 2013, A&A, 557, A133 [NASA ADS] [CrossRef] [EDP Sciences] [Google Scholar]
- de Zeeuw, T., & Norris, J. 1999, PASP, 111, 653 [NASA ADS] [CrossRef] [Google Scholar]
- Dullemond, C. P., van den Ancker, M. E., Acke, B., & van Boekel, R. 2003, ApJ, 594, L47 [NASA ADS] [CrossRef] [Google Scholar]
- Ellerbroek, L. E., Podio, L., Dougados, C., et al. 2014, A&A, 563, A87 [NASA ADS] [CrossRef] [EDP Sciences] [Google Scholar]
- Esteban, C., & Fernandez, M. 1998, MNRAS, 298, 185 [NASA ADS] [CrossRef] [Google Scholar]
- Fedele, D., van den Ancker, M. E., Acke, B., et al. 2008, A&A, 491, 809 [NASA ADS] [CrossRef] [EDP Sciences] [MathSciNet] [Google Scholar]
- Fedele, D., Pascucci, I., Brittain, S., et al. 2011, ApJ, 732, 106 [NASA ADS] [CrossRef] [Google Scholar]
- Finkenzeller, U., & Jankovics, I. 1984, A&AS, 57, 285 [NASA ADS] [Google Scholar]
- Finkenzeller, U., & Mundt, R. 1984, A&AS, 55, 109 [NASA ADS] [Google Scholar]
- Fuente, A., Rodríguez-Franco, A., Testi, L., et al. 2003, ApJ, 598, L39 [NASA ADS] [CrossRef] [Google Scholar]
- Gorti, U., & Hollenbach, D. 2009, ApJ, 690, 1539 [Google Scholar]
- Grady, C. A., Devine, D., Woodgate, B., et al. 2000, ApJ, 544, 895 [Google Scholar]
- Gray, R. O., & Corbally, C. J. 1998, AJ, 116, 2530 [NASA ADS] [CrossRef] [Google Scholar]
- Hein Bertelsen, R. P. 2015, Ph.D. Thesis, University of Groningen [Google Scholar]
- Hein Bertelsen, R. P., Kamp, I., Goto, M., et al. 2014, A&A, 561, A102 [NASA ADS] [CrossRef] [EDP Sciences] [Google Scholar]
- Hein Bertelsen, R. P., Kamp, I., van der Plas, G., et al. 2016, MNRAS, 458, 1466 [NASA ADS] [CrossRef] [Google Scholar]
- Henize, K. G. 1967, ApJS, 14, 125 [NASA ADS] [CrossRef] [Google Scholar]
- Ilee, J. D., Fairlamb, J., Oudmaijer, R. D., et al. 2014, MNRAS, 445, 3723 [NASA ADS] [CrossRef] [Google Scholar]
- Isella, A., Testi, L., Natta, A., et al. 2007, A&A, 469, 213 [CrossRef] [EDP Sciences] [Google Scholar]
- Isella, A., Carpenter, J. M., & Sargent, A. I. 2010, ApJ, 714, 1746 [NASA ADS] [CrossRef] [Google Scholar]
- Isobe, T., Feigelson, E. D., & Nelson, P. I. 1986, ApJ, 306, 490 [NASA ADS] [CrossRef] [Google Scholar]
- Kaeufl, H.-U., Ballester, P., Biereichel, P., et al. 2004, in Ground-based Instrumentation for Astronomy, eds. A. F. M. Moorwood, & M. Iye, SPIE Conf. Ser., 5492, 1218 [Google Scholar]
- Kawamura, A., Onishi, T., Yonekura, Y., et al. 1998, ApJS, 117, 387 [NASA ADS] [CrossRef] [Google Scholar]
- Khalafinejad, S., Maaskant, K. M., Mariñas, N., & Tielens, A. G. G. M. 2016, A&A, 587, A62 [NASA ADS] [CrossRef] [EDP Sciences] [Google Scholar]
- Kraus, M. 2009, A&A, 494, 253 [NASA ADS] [CrossRef] [EDP Sciences] [Google Scholar]
- Kurucz, R. L. 1991, BAAS, 23, 1047 [Google Scholar]
- Maaskant, K. M., Honda, M., Waters, L. B. F. M., et al. 2013, A&A, 555, A64 [NASA ADS] [CrossRef] [EDP Sciences] [Google Scholar]
- Maaskant, K. M., Min, M., Waters, L. B. F. M., & Tielens, A. G. G. M. 2014, A&A, 563, A78 [NASA ADS] [CrossRef] [EDP Sciences] [Google Scholar]
- Martin, C., Bouret, J.-C., Deleuil, M., Simon, T., & Catala, C. 2004, in Extrasolar Planets: Today and Tomorrow, eds. J. Beaulieu, A. Lecavelier Des Etangs, & C. Terquem, ASP Conf. Ser., 321, E325 [Google Scholar]
- Meeus, G., Waters, L. B. F. M., Bouwman, J., et al. 2001, A&A, 365, 476 [NASA ADS] [CrossRef] [EDP Sciences] [Google Scholar]
- Menu, J., van Boekel, R., Henning, T., et al. 2015, A&A, 581, A107 [NASA ADS] [CrossRef] [EDP Sciences] [Google Scholar]
- Min, M., Dullemond, C. P., Dominik, C., de Koter, A., & Hovenier, J. W. 2009, A&A, 497, 155 [NASA ADS] [CrossRef] [EDP Sciences] [Google Scholar]
- Miroshnichenko, A. S. 2007, ApJ, 667, 497 [NASA ADS] [CrossRef] [Google Scholar]
- Montesinos, B., Eiroa, C., Mora, A., & Merín, B. 2009, A&A, 495, 901 [NASA ADS] [CrossRef] [EDP Sciences] [Google Scholar]
- Mora, A., Merín, B., Solano, E., et al. 2001, A&A, 378, 116 [NASA ADS] [CrossRef] [EDP Sciences] [Google Scholar]
- Najita, J., Carr, J. S., & Mathieu, R. D. 2003, ApJ, 589, 931 [NASA ADS] [CrossRef] [Google Scholar]
- Oksala, M. E., Kraus, M., Cidale, L. S., Muratore, M. F., & Borges Fernandes, M. 2013, A&A, 558, A17 [NASA ADS] [CrossRef] [EDP Sciences] [Google Scholar]
- Pereira, C. B., Franco, C. S., & de Araújo, F. X. 2003, A&A, 397, 927 [NASA ADS] [CrossRef] [EDP Sciences] [Google Scholar]
- Pinte, C., Ménard, F., Duchêne, G., & Bastien, P. 2006, A&A, 459, 797 [NASA ADS] [CrossRef] [EDP Sciences] [Google Scholar]
- Pinte, C., Harries, T. J., Min, M., et al. 2009, A&A, 498, 967 [NASA ADS] [CrossRef] [EDP Sciences] [Google Scholar]
- Pontoppidan, K. M., Blake, G. A., & Smette, A. 2011, ApJ, 733, 84 [NASA ADS] [CrossRef] [Google Scholar]
- Sabbadin, F., & Hamzaoglu, E. 1981, A&A, 94, 25 [NASA ADS] [Google Scholar]
- Salyk, C., Blake, G. A., Boogert, A. C. A., & Brown, J. M. 2011, ApJ, 743, 112 [NASA ADS] [CrossRef] [Google Scholar]
- Schmidt-Kaler, T. 1982, Bulletin d’Information du Centre de Données Stellaires, 23, 2 [Google Scholar]
- Shevchenko, V. S., & Vitrichenko, E. A. 1994, in The Nature and Evolutionary Status of Herbig Ae/Be Stars, eds. P. S. The, M. R. Perez, & E. P. J. van den Heuvel, ASP Conf. Ser., 62, 55 [Google Scholar]
- Sitko, M. L., Carpenter, W. J., Kimes, R. L., et al. 2008, ApJ, 678, 1070 [NASA ADS] [CrossRef] [Google Scholar]
- Stenholm, B., & Acker, A. 1987, A&AS, 68, 51 [Google Scholar]
- Swings, J. P. 1973, Astrophys. Lett., 15, 71 [NASA ADS] [Google Scholar]
- Tatulli, E., Benisty, M., Ménard, F., et al. 2011, A&A, 531, A1 [NASA ADS] [CrossRef] [EDP Sciences] [Google Scholar]
- The, P. S., de Winter, D., & Perez, M. R. 1994, A&AS, 104, 315 [NASA ADS] [Google Scholar]
- Thi, W.-F., Ménard, F., Meeus, G., et al. 2011, A&A, 530, L2 [NASA ADS] [CrossRef] [EDP Sciences] [Google Scholar]
- Thi, W. F., Kamp, I., Woitke, P., et al. 2013, A&A, 551, A49 [NASA ADS] [CrossRef] [EDP Sciences] [Google Scholar]
- Tilling, I., Woitke, P., Meeus, G., et al. 2012, A&A, 538, A20 [NASA ADS] [CrossRef] [EDP Sciences] [Google Scholar]
- Tobin, J. J., Hartmann, L., Furesz, G., Mateo, M., & Megeath, S. T. 2009, ApJ, 697, 1103 [NASA ADS] [CrossRef] [Google Scholar]
- van Boekel, R., Min, M., Waters, L. B. F. M., et al. 2005, A&A, 437, 189 [NASA ADS] [CrossRef] [EDP Sciences] [Google Scholar]
- van der Plas, G., van den Ancker, M. E., Waters, L. B. F. M., & Dominik, C. 2015, A&A, 574, A75 [NASA ADS] [CrossRef] [EDP Sciences] [Google Scholar]
- Verhoeff, A. P., Waters, L. B. F. M., van den Ancker, M. E., et al. 2012, A&A, 538, A101 [NASA ADS] [CrossRef] [EDP Sciences] [Google Scholar]
- Webster, L. B. 1966, PASP, 78, 136 [NASA ADS] [CrossRef] [Google Scholar]
- Woitke, P., Kamp, I., & Thi, W.-F. 2009, A&A, 501, 383 [NASA ADS] [CrossRef] [EDP Sciences] [Google Scholar]
- Woitke, P., Pinte, C., Tilling, I., et al. 2010, MNRAS, L53 [Google Scholar]
- Zickgraf, F.-J. 2003, A&A, 408, 257 [NASA ADS] [CrossRef] [EDP Sciences] [Google Scholar]
Appendix A: Observed sample
HD 163296
HD 163296 is a well-studied Herbig Ae star of spectral type A3Ve (Gray & Corbally 1998) with a protoplanetary disc. In the LNIR/LIR versus [12]–[60] colour diagram it falls in the range of group II discs (see Fig. A.1). This classification is supported by the lack of PAHs in its infrared spectrum (Acke & van den Ancker 2004). However, HD 163296 has properties of both a flat and a flaring discs, in particular a scattering disc is observed (Grady et al. 2000), which is not expected for a self-shadowed disc. Montesinos et al. (2009) estimated the stellar mass in the system to M∗ ~ 2.3 M⊙ and the age to 5 Myr. From spatially resolved sub-mm data, Isella et al. (2007) estimated the disc around HD 163296 to have an inclination of 46° ± 4° and a position angle of 128° ± 4°. The disc is located at a distance of 119 pc (Hipparcos). The disc has been observed in scattered light out to a radius of ~500 au (Grady et al. 2000).
The presence of a giant planet or brown dwarf orbiting in the outer disc has been suggested by Grady et al. (2000) to explain an annulus of reduced scattering around 325 au in the optical choronagraphic images from the Space Telescope Imaging Spectrograph (STIS) on the Hubble Space Telescope (HST). The reduced scattering is consistent with a cleared zone like that caused by a substellar companion.
Isella et al. (2007) studied the disc with interferometric observations, from 0.87 to 7 mm, both in the continuum and the CO emission lines. From these observations the 12CO and 13CO was found to be optically thick. From the continuum dust emission the authors found an outer radius of 200 ± 15 au while CO lines imply an outer radius of 550 ± 50 au. The authors suggest that it is necessary to introduce a sharp drop in continuum emission by a factor of >30 at a radius of 200 au to explain the lack of continuum emission from radii larger than 200 au. HD 163296 thereby differs from the standard transitional disc where it is the inner disc that is dust depleted.
Recent ALMA band 7 data, at ~850 μm, sets the outer dust disc radius at 240 au and the CO outer radius at 575 au (de Gregorio-Monsalvo et al. 2013). These observations show a well-resolved dusty disc and no suggestion of gaps or holes at R> 25 au. The authors find that it is not possible to fit a standard tapered-edge model with one unique density profile to both data sets simultaneously. The CO channel maps require a thicker gas disc, while the mid- and far-IR SED require a flatter dust disc than previously presented in Tilling et al. (2012).
HD 163296 shows variations in near-IR brightness on timescales of years (Sitko et al. 2008). The source has a bipolar jet (HH 409) discovered in choronagraphic images from the Space Telescope Imaging Spectrograph (STIS; Grady et al. 2000). The high-velocity gas in the jet has radial velocities of 200–300 km s-1. Ellerbroek et al. (2014) found that the jet displays periods of intensified outflow activity at regular intervals of 16.0 ± 0.7 yr. They also identify transient optical fading, together with enhanced near-IR excess, and conclude that this is consistent with a scenario where dust clouds are launched above the disc plane.
HD 250550
HD 250550 is a confirmed Herbig Ae/Be star of spectral type B8–A0IVe (Gray & Corbally 1998) with a protoplanetary disc. The SED of HD 250550 is similar to that of HD 163296 and it has a lack of PAHs in its infrared spectrum (Acke & van den Ancker 2006). In our LNIR/LIR versus [12]–[60] colour diagram this disc falls (on the group I side) close to line dividing group I and group II discs (see Fig. A.1). In previous literature using standard classification methods it has been labelled as a group I source (e.g. Acke & van den Ancker 2006; Fedele et al. 2011; Maaskant et al. 2014), and in this paper we will thus consider this a group I source. The central star has an estimated mass of M∗ ~ 3.6 M⊙ and age of 1 Myr (Martin et al. 2004). The object is located at a distance of 280 pc (Canto et al. 1984; Kawamura et al. 1998). In FUSE (Far Ultraviolet Spectroscopic Explorer) observations, emission lines from C iii and O vi were detected (Bouret et al. 2003).
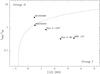 |
Fig. A.1 LNIR/LIR versus [12]–[60] colour plot (van Boekel et al. 2005) displaying all sources in our sample except T Ori (no 12 or 60 micron data available). Sources to the left of the empirical line are defined as group II and sources to the right are group I. |
Hen 2-80 (SS73 34)
Hen 2-80 was recently confirmed to be a Herbig Be star of spectral type B6Ve (Carmona et al. 2010). In our LNIR/LIR versus [12]–[60] colour diagram it falls clearly on the group I side (see Fig. A.1). However, this is the earliest spectral type in our sample. In a study of discs around Herbig Be stars Verhoeff et al. (2012) concluded that generally the SEDs of Herbig Be stars do not show flaring geometries, but rather indicate self-shadowed geometries. In a study of photo-evaporation of discs as a function of stellar luminosity, Gorti & Hollenbach (2009) concluded that the outer discs of hot luminous young stars should evaporate on relatively short timescales. In a simplistic view this would mean that more luminous stars lose their outer discs quickly and the chance of seeing a flaring disc around a massive pre-main sequence star is very small.
Hen 2-80 is located at a distance larger than 750 pc (minimum distance based on luminosity). Carmona et al. (2010) observed the source using high-resolution spectroscopy in the optical, covering the wavelength region 3500–9200 Å (R ~ 45 000). The spectrum is flat and exhibits only a few absorption lines. The observed emission lines in the spectrum include Hα, He i lines, Mg ii, H i P(17), O i, S ii, N ii, and Ca ii. Carmona et al. (2010) published spectra of the Hα line showing narrow absorption centred on the line.
MWC 137
MWC137 was classified as a Herbig Be star of spectral type B0ep (Sabbadin & Hamzaoglu 1981; Finkenzeller & Mundt 1984). The SED of MWC137 resembles that of a flaring disc around a Herbig Ae/Be star (see Fig. 1), and it falls clearly on the group I side in our LNIR/LIR versus [12]–[60] colour diagram (see Fig. A.1). However, the listed luminosity (L∗> 4.1) and effective temperature (Teff = 30 000) are unexpectedly high for a Herbig star and Esteban & Fernandez (1998) favoured to classify it as a B[e] supergiant. Meanwhile, the N-band mid-IR spectrum published by Verhoeff et al. (2012) looks very similar to that of MWC297, which is believed to be a massive Herbig Be star.
MWC 137 is located at a distance greater than 1000 pc (minimum distance based on luminosity). The object appears to be spectroscopically variable (Zickgraf 2003). An upper limit of 0.007 M⊙ for the disc mass has been found, using continuum images at 1.4 and 2.7 mm from IRAM and at 1.3 and 0.7 cm from the NRAO VLA (Fuente et al. 2003).
Verhoeff et al. (2012) performed N-band imaging and long slit spectroscopy with VISIR/VLT. They conclude that the observed PAH emission originates both from a circumstellar disc and from a surrounding nebula.
In a survey of massive evolved stars, including MWC 137, Oksala et al. (2013) obtained K-band spectroscopic data with the SINFONI at the VLT. Their observations of the first overtone CO band head emission is the first detection of CO emission from this source. 13CO emission was also detected. Their model suggests that the CO emitting region is located in a detached disc or ring structure and not in a continuous disc. Kraus (2009) note that pre-main sequence levels of 13C should not produce visible 13CO band head emission. This lead Oksala et al. (2013) to conclude from their 12CO/13CO band head ratio that MWC137 could be an evolved, post-main sequence object. Esteban & Fernandez (1998) investigated the nebula (S 266) around MWC137 using narrow-band Hα image and high-resolution spectroscopy and suggested that it is a ring nebula; in the continuum subtracted Hα image, they saw a clear filamentary shell structure and a fainter and more diffuse emission filling its inner regions. The classification of this object remains uncertain, thus we consider it a non-confirmed Herbig-candidate.
T Ori
T Ori is a confirmed Herbig Ae star of spectral type A3IVe (Mora et al. 2001). T Ori has not been plotted in our LNIR/LIR versus [12]–[60] colour diagram since the 12 and 60 micron data for this source is contaminated by emission from nearby bright sources. However, its SED appears typical of a self-shadowed or flat disc (see Fig. 1). This classification is supported by the absence of PAH emission in the infrared spectrum of T Ori (Acke & van den Ancker 2006). Furthermore, T Ori shows strong photometric variations in the optical of the type that is seen around UX Orionis stars and in a modelling study by Dullemond et al. (2003) it has been shown that UXOR-type phenomenon should only occur in self-shadowed discs. The star is located at a distance of 510 pc (de Zeeuw & Norris 1999) and is reported as a spectroscopic binary (Shevchenko & Vitrichenko 1994).
Hen 3-1227 (Hen 2-174, SS73 62, WRAY 15-1520)
Hen 3-1227 is a star of spectral type Be (Pereira et al. 2003). It is located at a distance larger than 400 pc (minimum distance based on luminosity). In our LNIR/LIR versus [12]–[60] colour diagram (see Fig. A.1), Hen 3-1227 is located on the group I side. However, the SED does not resemble a typical disc around a Herbig star (neither group I nor group II).
This source has been studied in several surveys and was classified as a possible planetary nebula (Webster 1966; Henize 1967). However, this classification was later rejected by Stenholm & Acker (1987) and Acker et al. (1987). Its spectrum shows only Hα, Hβ, and [O i] (6300 Å) emission (Swings 1973). Pereira et al. (2003) collected spectra from the ESO 1.52 m telescope in La Silla (3500–7500 and 3100–5100 Å) and reported a continuum of a reddened Be star with Hα, Hβ, Hδ, and [O i] (6300 and 6363 Å) in emission and Hγ in absorption. Miroshnichenko (2007) labels Hen 3-1227 as an FS CMa-type candidate, but the somewhat broad Balmer lines seen in the optical spectra suggests a high surface gravity, which could indicate an object close to the main sequence. The classification remains uncertain, but from the optical spectra we cannot exclude it as a pre-main sequence object. As we did for for MWC 137 we therefore also consider Hen 3-1227 a non-confirmed Herbig-candidate.
Appendix B: CRIRES spectra
HI line data and velocity shifts.
Figures B.1 and B.2 show examples of the near-IR CRIRES spectra from one of the six wavelength settings from all six sources. The final telluric corrected spectra are shown (black) together with the original uncorrected spectra (blue) and the telluric standard spectra (red). CO ro-vibrational and H i line identifications are indicated on the plots. Low transmission regions in the final corrected spectra are plotted as dotted red lines and are ignored during line extraction. Figure B.3 shows the H i lines present in our spectra and Table B.1 shows the collected FWHM and velocity shifts of these lines. In Fig. B.4, we show the line profile of the [OI] line at 6300 Å observed from Hen 2-80 by Carmona et al. (2010), and in Fig. B.5 we show a VLT/UVES spectrum from MWC 137 with a detection of the K i 7699 Å line.
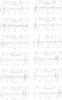 |
Fig. B.1 Spectra from all observed sources in our sample (source names are indicated in the plot titles). The spectra are from chip 1 and chip 2 (indicated in the plot titles) of the spectra taken at wavelength setting 4.657 μm. The spectra are wavelength calibrated using the H i lines. |
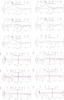 |
Fig. B.2 Spectra from all observed sources in our sample (source names are indicated in the plot titles). The spectra are from chip 3 and chip 4 (indicated in the plot titles) of the spectra taken at wavelength setting 4.657 μm. The spectra are wavelength calibrated using the H i lines. |
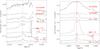 |
Fig. B.3 Humphreys ϵ 11-6 lines (left) and the Pfund β 7-5 lines (right) observed from our sample of stars. To avoid residual telluric features caused by the saturation of telluric emission lines we show only those regions of the spectra with transmittance above 35%. The vertical red dashed line is the location of the line centre. Target names are indicated in the figure. |
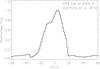 |
Fig. B.4 Line profile of the [O i] line at 6300 Å observed from Hen 2-80 by Carmona et al. (2010). The observed spectrum is not corrected for telluric absorption or emission (airglow). |
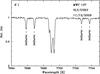 |
Fig. B.5 VLT/UVES optical spectrum from MWC 137 (extracted from the ESO data archive) showing multiple absorption components in the K i 7699 Å line. |
Appendix C: Extracted line fluxes and profiles
The individual CO ro-vibrational lines collected from the four CO detected sources and selected for further analysis are listed in Table C.1 and shown in Figs. C.1 to C.4 together with a median of all transitions at the bottom of each plot. In Fig. C.3, we also show the low J, v = 1–0 lines collected from Hen 2-80 with CO ro-vibrational absorption superposed. These were not selected for further analysis. For the selected lines, calculated line fluxes are presented in Tables C.2 to C.8. The line selection approach is described in Sect. 4.2.
CO lines selected for further analysis.
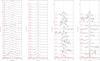 |
Fig. C.1 From left to right: 12COv = 1–0 lines observed from HD 163296 and 12COv = 1–0 lines, 12COv = 2–1 lines, and 13COv = 1–0 lines from HD 250550. |
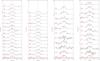 |
Fig. C.2 From left to right: 12COv = 1–0 lines observed from Hen 2-80 on March 5, 2012 and on March 6, 2012, and 12COv = 2–1 lines observed from Hen 2-80 on March 5, 2012, and March 6, 2012. |
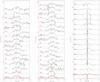 |
Fig. C.3 From left to right: 13COv = 1–0 lines observed from Hen 2-80 on March 5, 2012, and March 6, 2012, and 12CO absorption lines superposed on the emission lines observed from Hen 2-80 on March 5, 2012. |
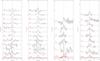 |
Fig. C.4 From left to right: 12COv = 1–0 lines observed from Hen 3-1227 on March 5, 2012, and March 6, 2012, and 13COv = 1–0 lines observed from Hen 3-1227 on March 5, 2012, and March 6, 2012. |
HD 163296 12CO line fluxes.
HD 250550 12CO and 13CO line fluxes.
HD 250550 12COv = 2–1 and 13CO line fluxes.
Hen 2-80 12CO line fluxes from March 5, 2012.
Hen 2-80 12CO line fluxes from March 6, 2012.
Hen 2-80 13CO line fluxes.
Hen 3-1227 12CO and 13COv = 1–0 line fluxes.
Appendix C.1: HD 163296
We include 12COv = 1–0 emission lines from J = 2 up to J = 36 in our study. We detect very broad emission lines indicating that the CO ro-vibrational lines are emitted fairly close to the star, consistent with the previous trend of group I discs emitting at smaller radii. We find single-peaked emission lines for low and mid J values, while flat-topped asymmetric profiles with shoulders seem to be present at higher J. The scatter in the FWHM measurements are caused by low S/N and very wide lines with broad wings hard to separate from the continuum. This scatter is reflected well in the associated error bars, based on the standard deviation of the nearby continuum. The line shapes that we observe are not compatible with the earlier line detections of Blake & Boogert (2004) and Salyk et al. (2011) using NIRSPEC/Keck data (R ~ 25 000). At low J, Blake & Boogert (2004) find single-peaked profiles of similar shape to our observed profiles, but they are much wider than ours. For high J lines, Salyk et al. (2011) find double-peaked and again much wider profiles than ours (for J> 25, FWHM = 83 km s-1 compared to our FWHM = 59 km s-1). If we can exclude the instrumental set-up as the cause for these profile differences (the earlier data were collected using NIRSPEC/Keck and not CRIRES/VLT), this could be connected to the reported variations in near-IR brightness (Sitko et al. 2008; Ellerbroek et al. 2014). An in-depth study of our detected CO lines from this source, including a thorough comparison to previous observations and to a model, will be the topic of a forthcoming paper.
Appendix C.2: HD 250550
In our study we include 12COv = 1–0 emission lines from J = 1 up to J = 35, v = 2–1 emission lines from J = 6 up to J = 20, and 13COv = 1–0 emission lines from J = 5 up to J = 25. The v = 1–0 lines are single peaked with a blue-shifted shoulder that seems to increase for higher J. The noticed correlation between the FWHM (of the main component) and J value (increasing FWHM, confirmed with the Kendall’s Tau test performed in Sect. 4.3) points to a CO emitting region where lines of higher excitation come from regions closer to the star.
The lower J line median for HD 250550 shows a narrower Gaussian profile (FWHM = 15 km s-1) with a shoulder at –17 km s-1, while the higher J line median shows a wider main component (FWHM = 20 km s-1) where the blue component has grown and merged with the line wing of the main component.
The line shape of the 12CO v(1-0)R30 line is consistent with that observed previously by Brittain et al. (2007). The average FWHM and single-peaked line shape of our detected lines is consistent with the FWHM and line shape of the ro-vibrational OH line at 2.9345 μm reported by Fedele et al. (2011). The single-peaked shape could be caused by low inclination of the disc, and based on their observations of the OH line Fedele et al. (2011) conclude that a model with an inclination of 10° gives the best fit. The velocity resolution for CRIRES is 3 km s-1, so double peaks separated by ≤3 km s-1 could be observed as single peaks.
Appendix C.3: Hen 2-80
We include 12COv = 1–0 emission lines from J = 5 up to J = 36, v = 2–1 emission lines from J = 0 to J = 27, and 13COv = 1–0 emission lines from J = 4 to J = 27. These lines show broad, double-peaked profiles and the fact that the width and line shape are similar through all J values (see Figs. 2 and 3) indicates a similar emitting region for all lines. One of the causes for a similar emitting region could be the presence of a gap, which would be consistent with the classification of the source as group I based on the LNIR/LIR versus [12]–[60] colour. The width of the lines, however, is not consistent with this classification. The peak separations for the observed lines are also fairly large (~22–25 km s-1), indicating that the CO emitting region is not very extended and/or that the disc has an inclination far from face on.
We also detect 12COv = 1–0 J< 6 lines, but these coincide with CO ro-vibrational absorption lines (Fig. C.3). These absorption lines are perfectly centred on the emission lines and their origin could likely be in the reported surrounding nebulosity (Carmona et al. 2010).
Appendix C.4: Hen 3-1227
We include 12COv = 1–0 emission lines from J = 0 to J = 26 and 13COv = 1–0 emission lines from J = 4 to J = 23. All lines are weak, narrow, and single peaked. This could be due to a low inclination angle of the disc. However, we cannot confirm a protoplanetary disc nature for this object (see Sect. 2). The lack of full J coverage together with the scatter (due to low S/N) in the FWHM values makes it hard to determine whether the FWHM is constant or rising with J (Fig. 2). However, the FWHM values are not inconsistent with a constant FWHM versus J behaviour.
Appendix C.5: MWC 137
We see broad and blended emission lines over the entire spectrum. The crowded spectrum does not come from a poorly chosen standard star spectrum for the telluric correction since the same spectrum was used for the correction of T Ori, a source that shows a mostly flat spectrum. We have clear detections of the H i recombination lines and of CO absorption v = 1–0 from lower J levels (Jup = 0,1,2,3,4). For the CO absorption lines, the lowest J (Jup = 0,1) transitions are seen as narrow double-peaked or multicomponent lines with a separation of 12 km s-1. A high-resolution VLT/UVES optical spectrum of MWC 137 extracted from the ESO data archive (see Fig. B.5) also shows multiple absorption components in the K i 7699 Å line with the same velocity separation as seen in the CO absorption lines. Therefore, we interpret the CO absorption seen in our spectra of MWC 137 as being due to the presence of cool molecular material in multiple absorbing foreground clouds. The broad blended emission features present throughout the spectrum could be blended CO ro-vibrational lines since no other molecule has been reported to produce such strong and numerous emission in this particular wavelength region. Similar spectra has been observed from other discs, e.g. RW Aur by Najita et al. (2003), who show that blended very broad CO ro-vibrational lines can explain the observed spectrum, and HD 101412 by van der Plas et al. (2015), where first overtone CO emission was also seen, similar to MWC 137 (Oksala et al. 2013).
Appendix C.6: T Ori
For T Ori no CO emission lines were found in the spectra (Figs. B.1 and B.2). The spectrum shows a somewhat flat and sometimes “bumpy” continuum. In the previous study (van der Plas et al. 2015), CO fundamental lines were detected from a similar source, HD 190073 (group II classification and spectral type A2IVpe). The line fluxes for the v = 1–0 lines from this source range from 1.4 ± 0.6 × 10⁻¹⁴ to 3.3 ± 1.3 × 10⁻¹⁴ erg/cm2/s (van der Plas et al. 2015). Scaled to the distance of T Ori (i.e. 1.7 times further away), we would expect typical flux levels below ~10-14 erg/cm2/s. This is of the same order as some of the weakest lines (v = 2–1 or 13CO) that we detect in sources such as HD 250550 and Hen 3-1227. However, the detected lines in these two sources were narrow and sharply peaked and were therefore easier to separate from the continuum. For T Ori, because it is a group II source, we expect emission lines to be wider (emitted closer to the star) and therefore more difficult to separate from the continuum in the case of weak lines. Thus, the observed flat spectrum we see from T Ori is consistent with the expectation of broad and weak emission lines with line fluxes below the detection limit.
A similar explanation is also valid for the v = 2–1 and for the 13CO lines from HD 163296. These lines, though still visible in the spectra, are too broad and weak to be quantified. The v = 1–0 lines, detected from HD 163296, are also very wide but strong enough (10-13 erg/cm2/s) that they can be separated from the continuum.
All Tables
All Figures
|
Fig. 1 Extinction-corrected SEDs of all sources in our sample. Unreddened Kurucz (1991) photospheric models corresponding to Teff and log g from the literature are fitted to the extinction-corrected observed photometry. Measurements with beam sizes <3′′ are shown as solid dots and measurements with beam sizes >3′′ are shown as open squares. |
| In the text | |
|
Fig. 2 FWHM as a function of Jup for the v = 1–0 emission lines observed from our four CO detected sources. The source names are indicated on the plots. In the middle and bottom rows FWHM collected for Hen 2-80 and Hen 3-1227 are shown for March 5, 2012 (left) and March 6, 2012 (right). The error bars are based on the variation that occurs in the FWHM when using the standard deviation of the nearby continuum as uncertainty for the continuum placement when fitting a Gaussian. In a few cases, where the lines are very narrow, this approach leads to errors smaller than the plotting symbols. |
| In the text | |
|
Fig. 3 Normalised median of all 12COv = 1–0 lines observed from the four sources where CO is detected. The source names are indicated on the plots. In the first two rows (for HD 163296 and HD 250550), we show low J (J< 10) medians on the left and high J (J> 20) medians on the right. In the lower two rows (for Hen 2-80 and Hen 3-1227), we show medians for all J collected on two separate nights: March 5, 2012, on the left, March 6, 2012, on the right. In all frames, the solid black line shows the Gaussian fit, the red dashed line is the centre of the Gaussian or zero velocity, and the red- and blue-shifted side of the line profile are indicated with red and blue lines, respectively. The FWHM of the Gaussian is printed at the top left of each frame together with the ratio of the integrated red and blue side of the line. For Hen 2-80 the peak separation of the median is also shown. For HD 250550 the sum of the two Gaussians is shown as a dotted black line. |
| In the text | |
|
Fig. 4 RCO10% versus the 30 μm over 13.5 μm continuum flux from this study (black) and from the studies by van der Plas et al. (2015; red) and Salyk et al. (2011; blue). Group I discs are plotted as filled squares while group II discs are plotted as open squares. |
| In the text | |
|
Fig. 5 Possible disc geometries: a) a continuous disc without a hole/gap, resulting in a group II SED with silicate features and broad CO ro-vibrational lines emitted from close to the star; b) a disc with a large hole, resulting in a group I SED without silicate feature (group Ib) and with narrow CO ro-vibrational lines emitted from the outer disc wall; c) a disc with a small hole, resulting in a group I SED with silicate feature (group Ia) and with broad CO ro-vibrational lines emitted from the outer disc wall (in this case close to the star); and d) a disc with a small or large dust hole, resulting in a group I SED (with or without silicate features) and broad CO lines. The radial gas distribution differs from that of the dust and the CO lines are thus emitted from within the hole. |
| In the text | |
|
Fig. 6 Gas density distribution of the two disc models. Model #1 is on the left and model #2 is on the right. Contour lines showing Tgas = 2000 K (white), min(Av,ver,Av,rad) = 1.0 (minimum of the radial and vertical dust extinction) (black), and the CO abundance of 10-5 (red) are overplotted. |
| In the text | |
|
Fig. 7 FWHM as a function of Jup for v = 1–0 emission lines collected from Model #1, a Herbig Ae/Be ProDiMo model with the inner disc starting at 0.3 au (two different inclinations shown), and Model #2 of the disc HD 100546, a disc with a gap. |
| In the text | |
|
Fig. 8 Inclination versus peak separation for a modelled v(1–0)R6 line and v(1–0)R35 line from a flaring disc model with no gap (Model #1). |
| In the text | |
|
Fig. A.1 LNIR/LIR versus [12]–[60] colour plot (van Boekel et al. 2005) displaying all sources in our sample except T Ori (no 12 or 60 micron data available). Sources to the left of the empirical line are defined as group II and sources to the right are group I. |
| In the text | |
|
Fig. B.1 Spectra from all observed sources in our sample (source names are indicated in the plot titles). The spectra are from chip 1 and chip 2 (indicated in the plot titles) of the spectra taken at wavelength setting 4.657 μm. The spectra are wavelength calibrated using the H i lines. |
| In the text | |
|
Fig. B.2 Spectra from all observed sources in our sample (source names are indicated in the plot titles). The spectra are from chip 3 and chip 4 (indicated in the plot titles) of the spectra taken at wavelength setting 4.657 μm. The spectra are wavelength calibrated using the H i lines. |
| In the text | |
|
Fig. B.3 Humphreys ϵ 11-6 lines (left) and the Pfund β 7-5 lines (right) observed from our sample of stars. To avoid residual telluric features caused by the saturation of telluric emission lines we show only those regions of the spectra with transmittance above 35%. The vertical red dashed line is the location of the line centre. Target names are indicated in the figure. |
| In the text | |
|
Fig. B.4 Line profile of the [O i] line at 6300 Å observed from Hen 2-80 by Carmona et al. (2010). The observed spectrum is not corrected for telluric absorption or emission (airglow). |
| In the text | |
|
Fig. B.5 VLT/UVES optical spectrum from MWC 137 (extracted from the ESO data archive) showing multiple absorption components in the K i 7699 Å line. |
| In the text | |
|
Fig. C.1 From left to right: 12COv = 1–0 lines observed from HD 163296 and 12COv = 1–0 lines, 12COv = 2–1 lines, and 13COv = 1–0 lines from HD 250550. |
| In the text | |
|
Fig. C.2 From left to right: 12COv = 1–0 lines observed from Hen 2-80 on March 5, 2012 and on March 6, 2012, and 12COv = 2–1 lines observed from Hen 2-80 on March 5, 2012, and March 6, 2012. |
| In the text | |
|
Fig. C.3 From left to right: 13COv = 1–0 lines observed from Hen 2-80 on March 5, 2012, and March 6, 2012, and 12CO absorption lines superposed on the emission lines observed from Hen 2-80 on March 5, 2012. |
| In the text | |
|
Fig. C.4 From left to right: 12COv = 1–0 lines observed from Hen 3-1227 on March 5, 2012, and March 6, 2012, and 13COv = 1–0 lines observed from Hen 3-1227 on March 5, 2012, and March 6, 2012. |
| In the text | |
Current usage metrics show cumulative count of Article Views (full-text article views including HTML views, PDF and ePub downloads, according to the available data) and Abstracts Views on Vision4Press platform.
Data correspond to usage on the plateform after 2015. The current usage metrics is available 48-96 hours after online publication and is updated daily on week days.
Initial download of the metrics may take a while.