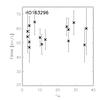
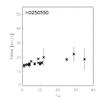
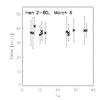
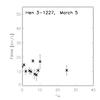
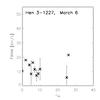
Fig. 2
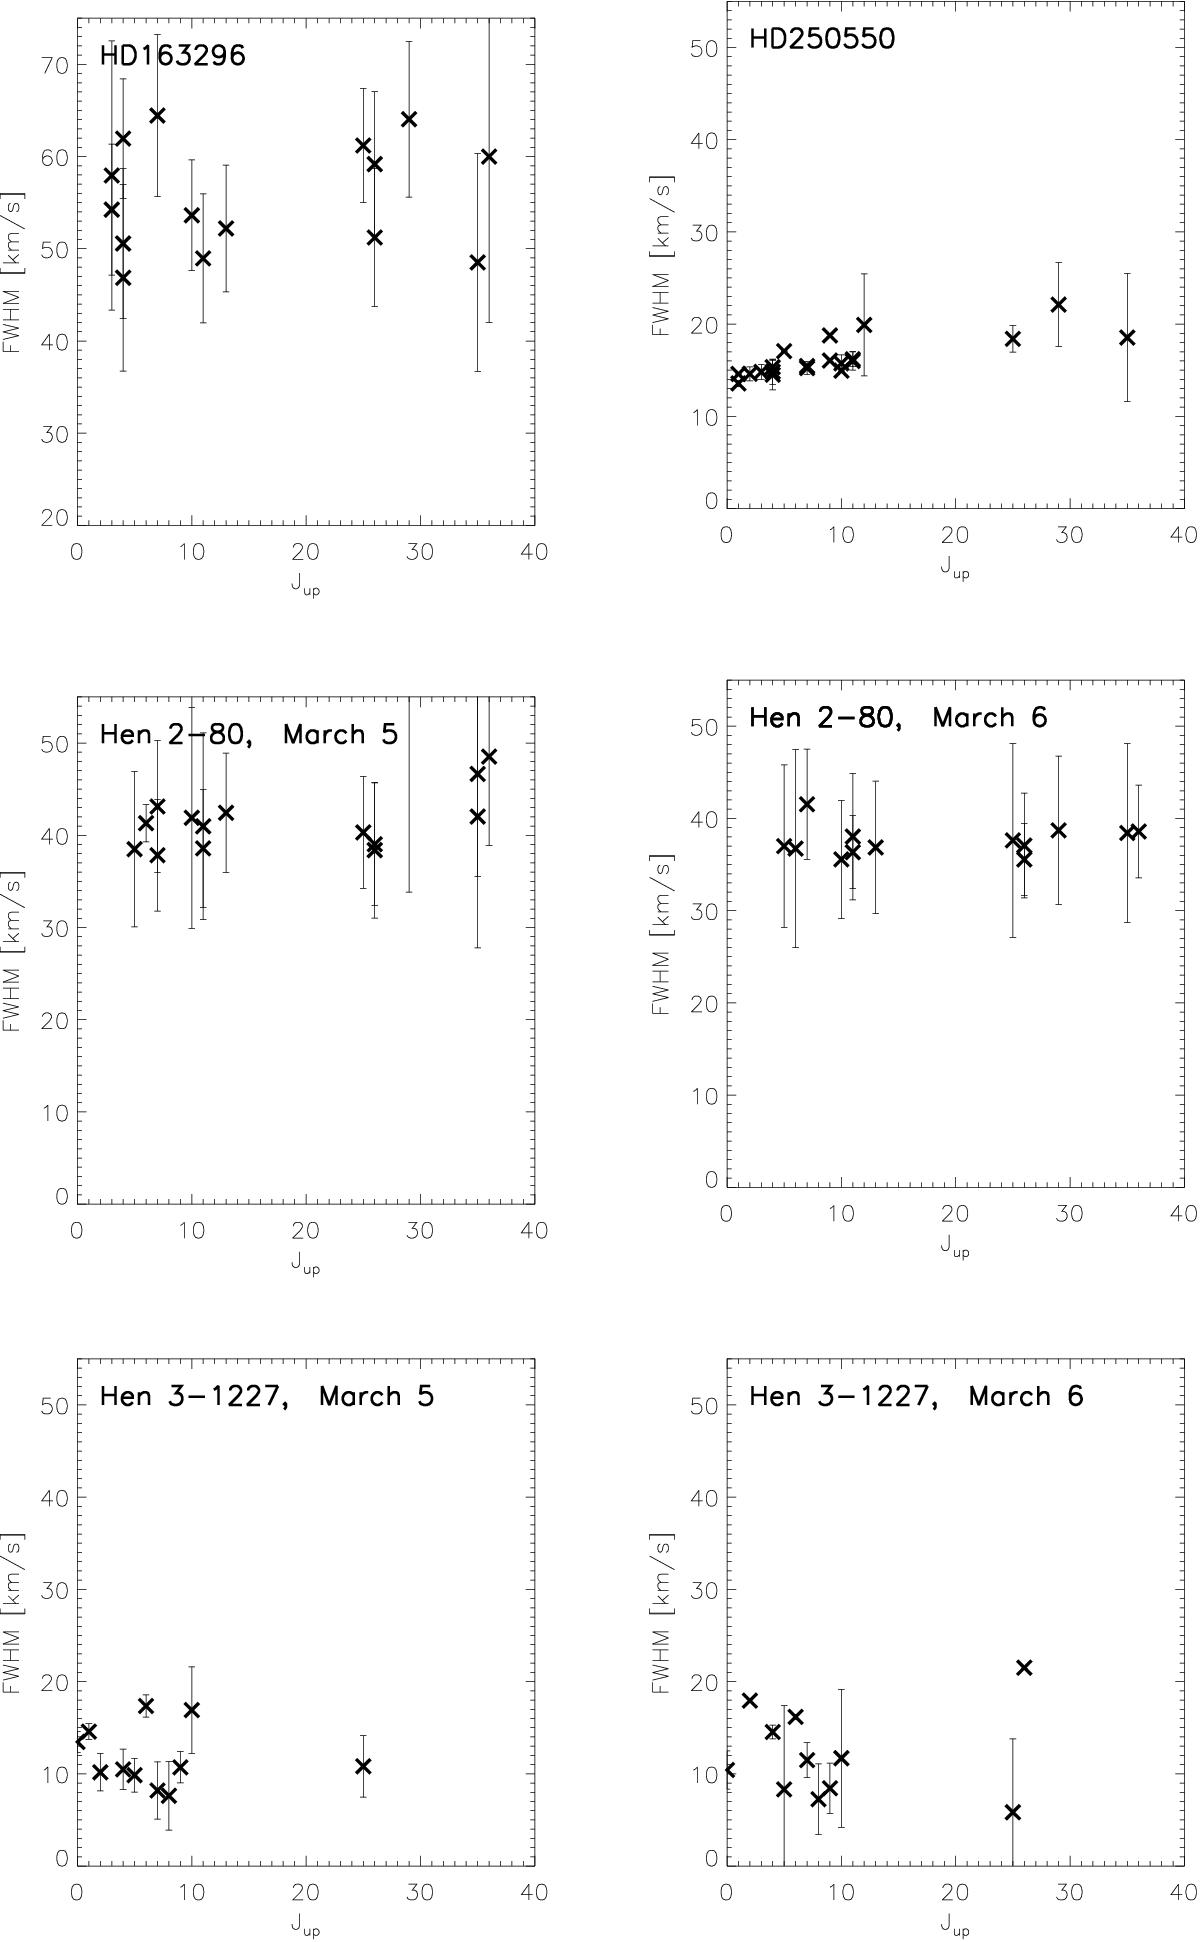
FWHM as a function of Jup for the v = 1–0 emission lines observed from our four CO detected sources. The source names are indicated on the plots. In the middle and bottom rows FWHM collected for Hen 2-80 and Hen 3-1227 are shown for March 5, 2012 (left) and March 6, 2012 (right). The error bars are based on the variation that occurs in the FWHM when using the standard deviation of the nearby continuum as uncertainty for the continuum placement when fitting a Gaussian. In a few cases, where the lines are very narrow, this approach leads to errors smaller than the plotting symbols.
Current usage metrics show cumulative count of Article Views (full-text article views including HTML views, PDF and ePub downloads, according to the available data) and Abstracts Views on Vision4Press platform.
Data correspond to usage on the plateform after 2015. The current usage metrics is available 48-96 hours after online publication and is updated daily on week days.
Initial download of the metrics may take a while.