Free Access
Fig. 4
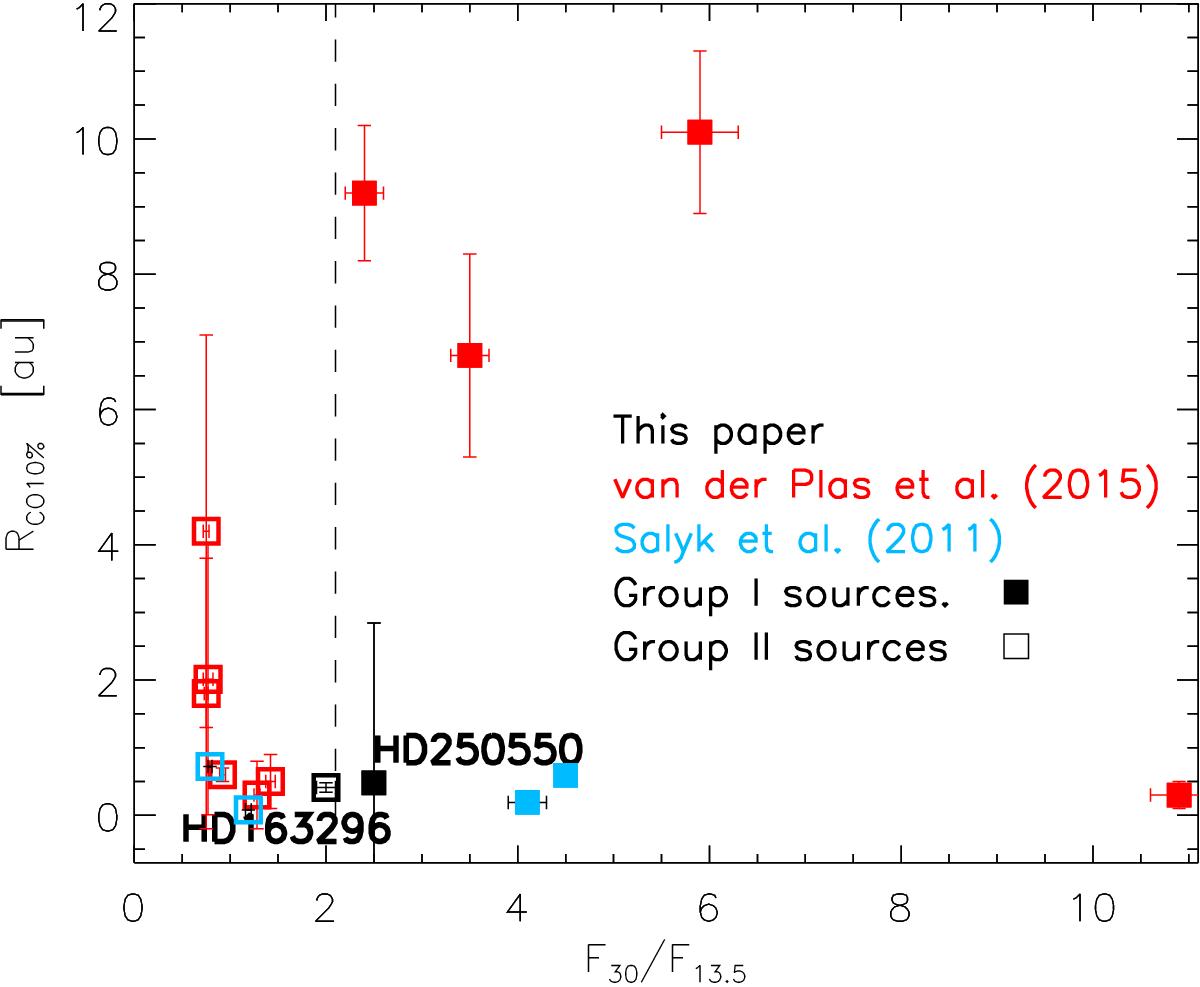
RCO10% versus the 30 μm over 13.5 μm continuum flux from this study (black) and from the studies by van der Plas et al. (2015; red) and Salyk et al. (2011; blue). Group I discs are plotted as filled squares while group II discs are plotted as open squares.
Current usage metrics show cumulative count of Article Views (full-text article views including HTML views, PDF and ePub downloads, according to the available data) and Abstracts Views on Vision4Press platform.
Data correspond to usage on the plateform after 2015. The current usage metrics is available 48-96 hours after online publication and is updated daily on week days.
Initial download of the metrics may take a while.