Free Access
Fig. A.1
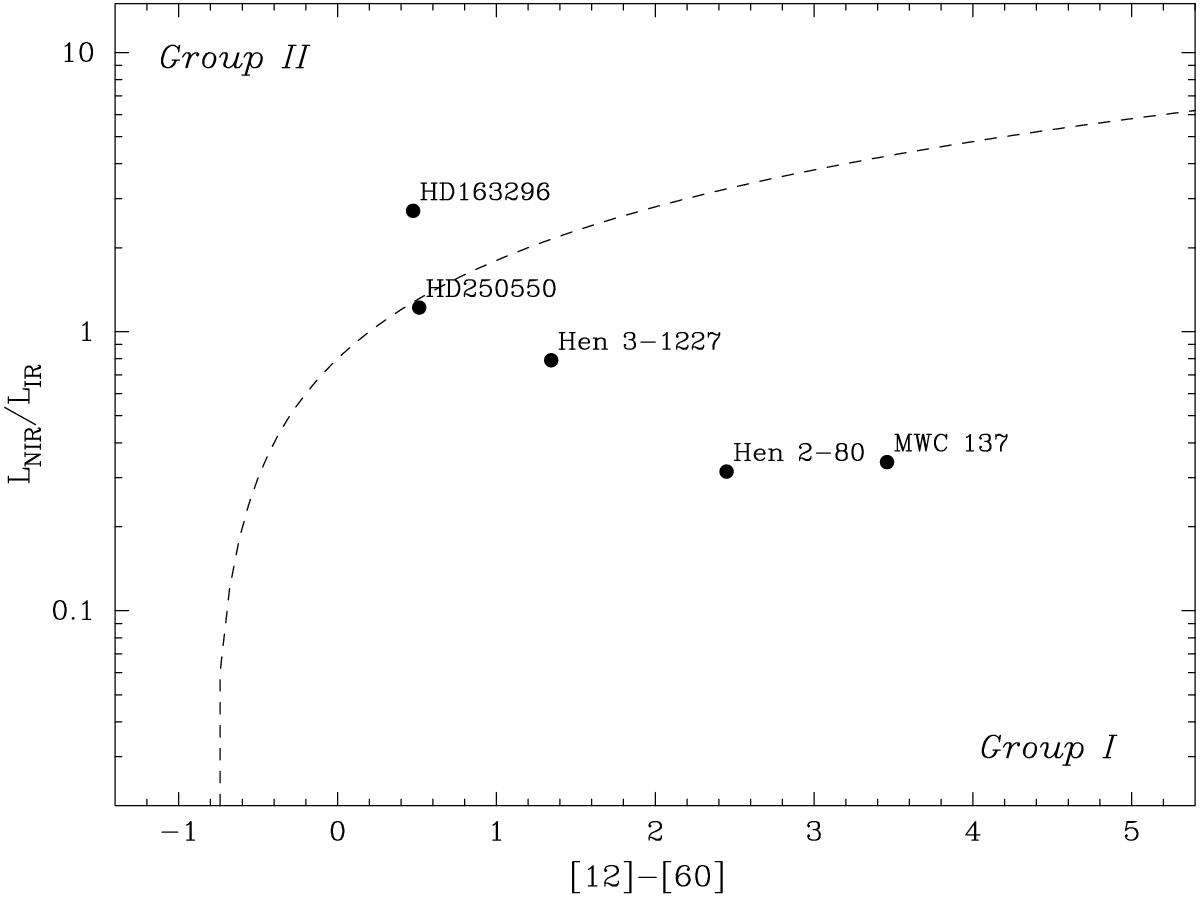
LNIR/LIR versus [12]–[60] colour plot (van Boekel et al. 2005) displaying all sources in our sample except T Ori (no 12 or 60 micron data available). Sources to the left of the empirical line are defined as group II and sources to the right are group I.
Current usage metrics show cumulative count of Article Views (full-text article views including HTML views, PDF and ePub downloads, according to the available data) and Abstracts Views on Vision4Press platform.
Data correspond to usage on the plateform after 2015. The current usage metrics is available 48-96 hours after online publication and is updated daily on week days.
Initial download of the metrics may take a while.