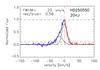
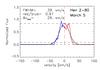
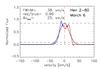
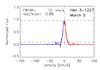
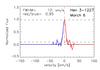
Fig. 3
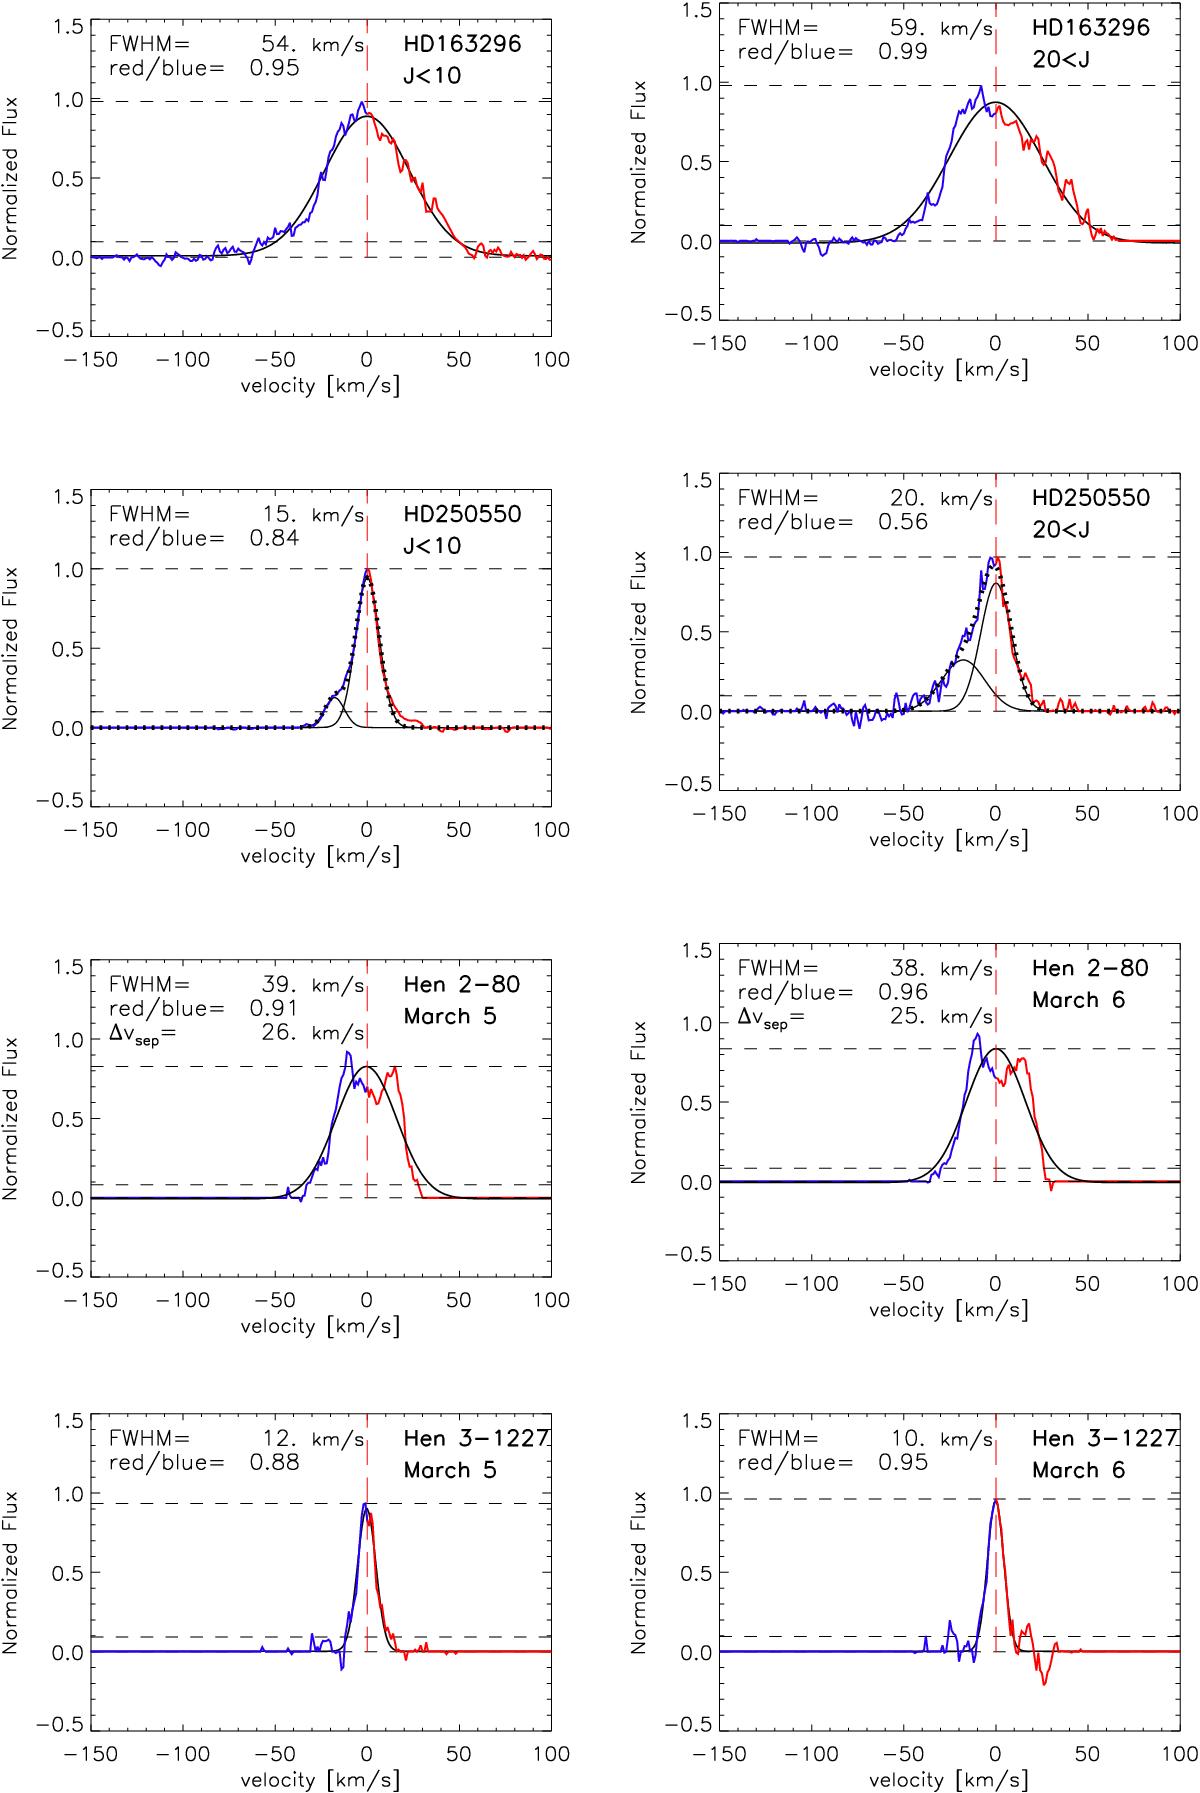
Normalised median of all 12COv = 1–0 lines observed from the four sources where CO is detected. The source names are indicated on the plots. In the first two rows (for HD 163296 and HD 250550), we show low J (J< 10) medians on the left and high J (J> 20) medians on the right. In the lower two rows (for Hen 2-80 and Hen 3-1227), we show medians for all J collected on two separate nights: March 5, 2012, on the left, March 6, 2012, on the right. In all frames, the solid black line shows the Gaussian fit, the red dashed line is the centre of the Gaussian or zero velocity, and the red- and blue-shifted side of the line profile are indicated with red and blue lines, respectively. The FWHM of the Gaussian is printed at the top left of each frame together with the ratio of the integrated red and blue side of the line. For Hen 2-80 the peak separation of the median is also shown. For HD 250550 the sum of the two Gaussians is shown as a dotted black line.
Current usage metrics show cumulative count of Article Views (full-text article views including HTML views, PDF and ePub downloads, according to the available data) and Abstracts Views on Vision4Press platform.
Data correspond to usage on the plateform after 2015. The current usage metrics is available 48-96 hours after online publication and is updated daily on week days.
Initial download of the metrics may take a while.