| Issue |
A&A
Volume 584, December 2015
|
|
|---|---|---|
| Article Number | A88 | |
| Number of page(s) | 23 | |
| Section | Extragalactic astronomy | |
| DOI | https://doi.org/10.1051/0004-6361/201526191 | |
| Published online | 08 December 2015 | |
Central enhancement of the nitrogen-to-oxygen abundance ratio in barred galaxies⋆,⋆⋆
1 Dpto. de Física Teórica y del Cosmos, Campus de Fuentenueva, Universidad de Granada, 18071 Granada, Spain
e-mail: estrella@ugr.es
2 Instituto Carlos I de Física Teórica y Computacional, 18071 Granada, Spain
3 Instituto de Astrofísica de Andalucía, CSIC, Apartado 3004, 18080 Granada, Spain
4 Instituto de Astronomia, Geofísica e Ciências Atmosféricas. Universidade de São Paulo, R. do Matão, 1226, 05508-090 São Paulo, SP, Brazil
5 European Southern Observatory, 19001 Casilla, Santiago 19, Chile
Received: 26 March 2015
Accepted: 9 July 2015
Context. Bar-induced gas inflows towards galaxy centres are recognised as a key agent for the secular evolution of galaxies. One immediate consequence of this inflow is the accumulation of gas in the centre of galaxies where it can form stars and alter the chemical and physical properties.
Aims. Our aim is to study whether the properties of the ionised gas in the central parts of barred galaxies are altered by the presence of a bar and whether the change in central properties is related to bar and/or parent galaxy properties.
Methods. We use a sample of nearby face-on disc galaxies with available SDSS spectra, morphological decomposition, and information on the stellar population of their bulges, to measure the internal Balmer extinction from the Hα to Hβ line ratio, star formation rate, and relevant line ratios to diagnose chemical abundances and gas density.
Results. The distributions of all the parameters analysed (internal Balmer extinction at Hβ (c(Hβ)), star formation rate per unit area, electron density, [N ii]λ6583/Hα emission-line ratio, ionisation parameter, and nitrogen-to-oxygen (N/O) abundance ratio) are different for barred and unbarred galaxies, except for the R23 metallicity tracer and the oxygen abundance obtained from photoionisation models. The median values of the distributions of these parameters point towards (marginally) larger dust content, star formation rate per unit area, electron density, and ionisation parameter in the centres of barred galaxies than in their unbarred counterparts. The most remarkable difference between barred and unbarred galaxies appears in the [N ii]λ6583/Hα line ratio that is, on average, ~25% higher in barred galaxies, due to an increased N/O abundance ratio in the centres of these galaxies compared to the unbarred ones. We analyse these differences as a function of galaxy morphological type (as traced by bulge-to-disc light ratios and bulge mass), total stellar mass, and bulge Sérsic index. We observe an enhancement of the differences between central gas properties in barred and unbarred galaxies in later-type galaxies or galaxies with less massive bulges. However, the bar seems to have a lower impact on the central gas properties for galaxies with bulges above ~1010 M⊙ or total mass M⋆ ≳ 1010.8 M⊙.
Conclusions. We find observational evidence that the presence of a galactic bar affects the properties of the ionised gas in the central parts of disc galaxies (radii ≲0.6–2.1 kpc). The most striking effect is an enhancement in the N/O abundance ratio. This can be interpreted qualitatively in terms of our current knowledge of bar formation and evolution, and of chemical evolution models, as being the result of a different star formation history in the centres of barred galaxies caused by the gas inflow induced by the bar. Our results lend support to the scenario in which less massive and more massive bulges have different origins or evolutionary processes, with the gaseous phase of the former currently having a closer relation to the bars.
Key words: galaxies: evolution / galaxies: abundances / galaxies: bulges / galaxies: spiral / galaxies: structure / galaxies: ISM
Appendix A is available in electronic form at http://www.aanda.org
Extinction-corrected line fluxes are only available at the CDS via anonymous ftp to cdsarc.u-strasbg.fr (130.79.128.5) or via http://cdsarc.u-strasbg.fr/viz-bin/qcat?J/A+A/584/A88
© ESO, 2015
1. Introduction
The distribution of gas and stars in disc galaxies has a basic axisymmetric structure, which is driven by rotation. However, superimposed non-axisymmetric morphological features, such as spiral arms or bars, may have important consequences on their evolution (e.g. Kormendy & Kennicutt 2004). This secular, internally driven, evolution is thought to be dominant in recent times, as opposed to the evolution driven by galactic hierarchical merging and external gas accretion (e.g. Barnes & Hernquist 1992). Stellar bars have received a lot of attention and are seen as important agents for the secular evolution of galaxies, because their non-axisymmetric gravitational potential redistributes the angular momentum of the gas and stars in galactic discs (e.g. Sellwood & Wilkinson 1993; Athanassoula 2003). Gas is dissipative and, at radii well inside corotation, loses angular momentum as a result of the gravitational torque exerted by the bar. As a result, gas is driven towards the galaxy centre (e.g. Athanassoula 1992; Friedli & Benz 1993; Friedli et al. 1994). Analytical and numerical simulations also show that the effectiveness with which a bar influences galaxy dynamics (bar strength) changes as the bar evolves (Athanassoula 2003) and, as a consequence, the bar-induced gas inflow rate changes accordingly (Regan & Teuben 2004).
According to simulations, bar-induced gas inflow can affect the central properties of galaxies in a number of ways: it can increase the central gas and dust concentration and trigger star formation (SF; Friedli & Benz 1993; Martinet & Friedli 1997), produce the formation and growth of a disky pseudobulge (Kormendy & Kennicutt 2004; Cheung et al. 2013), and alter the central abundance and dilute the initial disc metallicity gradient (Friedli & Benz 1993; Friedli et al. 1994). If the gas were to reach the central parsecs it could potentially act as fuel for a central massive black hole (Shlosman et al. 1989) and thus form an active galactic nucleus or AGN (e.g. Coelho & Gadotti 2011; Oh et al. 2012). Eventually, bars can produce central mass concentrations and, once they have accumulated sufficient mass in the centre, they weaken. For a sufficiently high mass, the bar may even dissolve (e.g. Pfenniger & Norman 1990; Friedli & Benz 1993; Bournaud & Combes 2002), although, in more recent simulations, bars appear more robust than initially thought (e.g. Shen & Sellwood 2004; Athanassoula et al. 2005, 2013). For a detailed description of the role of bars in secular evolution, see the review by Kormendy & Kennicutt (2004) and references therein.
Observational evidence exists for bar-induced gas inflows (e.g. Regan et al. 1997; Zurita et al. 2004). The inflow rate has been measured to within a range of ~0.1–1 M⊙ yr-1 (Regan et al. 1997; Sakamoto et al. 1999), with a higher rate being found in earlier-type galaxies (Regan & Teuben 2004; Sheth et al. 2005). However, the observational search for the theoretically predicted effects of bar inflows on the properties of the central gas-phase component of galaxies has not been successful in many cases, and conclusions are frequently contradictory.
Compared to unbarred galaxies, barred galaxies have higher central molecular mass concentrations (Sakamoto et al. 1999; Sheth et al. 2005), which produce a higher star formation rate (SFR) in the centres of barred galaxies, as observed by several authors (e.g. Hummel et al. 1990; Ho et al. 1997b; Wang et al. 2012; Zhou et al. 2015; Ellison et al. 2011; Oh et al. 2012). However, there is no agreement on the dependence of this enhancement in SFR with bar properties. For example, Wang et al. (2012) and Zhou et al. (2015) find a positive trend between SFR and ellipticity or ellipticity-based parameters for strong bars, and Oh et al. (2012) find it with bar length, but no dependency is found by other authors (Pompea & Rieke 1990; Roussel et al. 2001; Ellison et al. 2011). Meanwhile, Ellison et al. (2011) find an enhancement in central SFR only for barred galaxies with a mass greater than 1010M⊙, and the enhancements observed by Oh et al. (2012) are restricted to the reddest galaxies in their sample. Moreover, Cacho et al. (2014) have recently found no enhancement in SFR in barred galaxies compared with unbarred ones.
Studies of the central gas-phase metallicity yielded even more complex results. Ellison et al. (2011) find that there are central oxygen abundances ~0.06 dex larger in barred than in unbarred galaxies at a given galactic stellar mass, but Cacho et al. (2014) find no difference in a similar study to the one performed by Ellison et al. (2011). Other authors (Considère et al. 2000; Dutil & Roy 1999) used a smaller galaxy sample and obtained lower central oxygen abundances in barred starbursts than in normal, unbarred, galaxies. So far no relation has been found between bar strength and central oxygen abundance.
Thus, while simulations predict strong effects in the central gas properties of barred galaxies, no convincing observational confirmation has yet been found. The same bars that produce an enhancement in SFR do not seem to produce the metallicity alteration that simulations predict (Friedli et al. 1994; Martel et al. 2013). Bar evolution, with its accompanying bar-strength change, linked to the fact that bars can even be destroyed (meaning that currently unbarred galaxies have maybe had a bar) might be part of the reason for the current discrepancies in findings. Also, central properties might also depend on the availability of gas and on host galaxy properties in general (namely total mass or Hubble-type), which makes sample selection critical.
The advent of the SDSS spectroscopic data has made it possible to study the effects of bars in central gas properties using large galaxy samples and covering wide ranges in host galaxy properties. Although studies in this field have contributed to interesting results, all publications, so far, have focused on central star formation. Only in a few cases has oxygen abundance also been studied (Ellison et al. 2011; Cacho et al. 2014). However, bar-induced gas inflows might also alter other physical properties of the central gas. For example, if bars are able to produce higher central mass concentrations (Sakamoto et al. 1999; Sheth et al. 2005), higher concentrations of dust should be expected in the centres of barred galaxies, which would produce greater extinction. This greater concentration of gas and dust in the centres of barred galaxies, combined with a larger bar-induced SFR, could also lead to higher electron densities in the centres of barred galaxies (Ho et al. 1997b). The history of star-formation in galaxy centres is likely to be different in barred and unbarred galaxies due to the gas supply induced by the bars, which might leave footprints in the N/O abundance ratio (Mollá & Gavilán 2010; Mallery et al. 2007; Edmunds & Pagel 1978). Consequently, it is worth exploring other properties of the ionised gas that might be modified by the effect of a bar. This is the motivation for the work presented below.
In this paper we study ionised gas properties in the centres of barred and unbarred galaxies. In addition to the SFR and oxygen abundance, we also measure the Balmer extinction, electron density, and the N/O abundance ratio. We use a sample of nearby galaxies with available spectra from which we remove AGN. Our galaxy sample has important advantages compared to previous samples: galaxies are face-on (i< 26°), the stellar component has already been studied by Coelho & Gadotti (2011), and morphological 2D decomposition (and therefore structural information on bars, bulges and discs) is also available (Gadotti 2009). Our aim is to look for observational evidence that bar-induced inflows have important consequences for the central properties of the gas and, therefore, on secular evolution.
This paper is organised as follows. In Sect. 2 we describe our galaxy sample. In Sect. 3 we describe the procedure to measure the emission-line fluxes on which our study is based. Afterwards we remove AGN from the sample (Sect. 4). In Sects. 5–8, the internal extinction, central oxygen abundance, N/O ratio, SFR, and electron density are calculated for all sample galaxies and the distribution of these parameters is analysed and compared separately for both barred and unbarred galaxies. In the following Sects. 9–11 we explore the dependence of the found differences on Hubble-type, total galaxy, and bulge mass, and possible dependencies on bar properties. In Sect. 12, we discuss our results, which are then summarised in Sect. 13.
2. Galaxy sample
The galaxy sample studied here is the one used by Coelho & Gadotti (2011) to study the stellar populations of the bulges of barred and unbarred galaxies. This sample is based on the one studied morphologically by Gadotti (2009).
The sample contains all spiral face-on galaxies (axial ratio  ) in the Sloan Digital Sky Survey (SDSS) data release 2, with stellar masses larger than 1010M⊙, redshift
  , bulge-to-total luminosity ratio above 0.043 (i.e. earlier than ~Sd), and with signal-to-noise ratio in their corresponding SDSS spectra greater than or equal to 10, measured over the spectral range corresponding to the SDSS g-band. This sample is made up of 251 barred and 324 unbarred galaxies. The two sub-samples of barred and unbarred galaxies have similar total stellar mass distributions (Coelho & Gadotti 2011).
3. Analysis of the spectra
3.1. Spectra pre-processing
The spectra analysed in this paper come from the SDSS data release 7. The spectra pre-processing comprises shifting of the original spectra to the rest frame using the redshifts from the SDSS database, re-sampling in steps of 1 Å, and Galactic extinction correction as described by Cid Fernandes et al. (2005).
Afterwards the emission of the stellar component was modelled with the spectral synthesis code starlight (Cid Fernandes et al. 2005). This is done by comparing the observed SDSS spectra, on a pixel-by-pixel basis, to stellar population models (Vazdekis et al. 2010).
We refer the reader to Coelho & Gadotti (2011) and Gadotti (2009) and references therein for full details on the sample selection and biases, and on the spectra pre-processing and modelling of the stellar component.
3.2. Emission-line measurements
The emission-line fluxes were automatically measured over the stellar-emission-subtracted SDSS spectra of the galaxy sample. The latter had already been processed as described in the paragraph above.
We developed a code for measuring the fluxes of the brightest emission lines of the optical spectra. These include [O ii]λλ3727,3729, Hδ, Hγ, Hβ, [O iii]λ4959, [O iii]λ5007, [O i]λ6300, [N ii]λ6548, Hα, [N ii]λ6584, and [S ii]λλ6717, 6731. All line fluxes were measured independently of each other, with no assumptions on the relative strength of any pair of lines.
Initially, the code searches for significant emission (over the continuum level) at the rest-frame wavelength of the brightest emission lines. At this point, the continuum level is determined using a linear fit of the median continuum level in two spectral regions on both sides of each emission line. If the code detects an emission peak, with a signal of at least twice the standard deviation of the continuum level, then the emission line profile is fitted with a Gaussian function, and the central wavelength and full-width at half maximum (FWHM) of the line are determined. Only fitted emission features yielding reasonable values1 for the central wavelength and FWHM are considered as true detections. Afterwards, the code measures the emission-line fluxes. To do this, the code first defines new regions dominated by continuum emission on both sides of each emission line. The size and distance of these continuum regions from the emission-line central wavelength depend on both the previously determined FWHM and on the location of neighbouring emission lines. The continuum level at the emission-line position is estimated through a linear fit of the median continuum levels in the continuum regions. This is an important step in the procedure, as the greatest contribution to uncertainties in the line fluxes stems from the determination of the continuum level. Line fluxes are then obtained from direct integration of the emission-line profiles over the continuum level, which was determined as described above. An exception is made for [N ii]λ6548, Hα, [N ii]λ6583, and [S ii]λλ6717, 6731, for which fluxes obtained from Gaussian line-fitting were adopted to ensure accurate flux retrieval in cases where these sets of lines were blended.
The preliminary flux measurements were carefully inspected for unreliable measurements and/or undetected emission lines which are clearly detectable by eye. These checks were done interactively, by visual inspection of the individual spectra and on the Gaussian and continuum fits. We also compared our automatic flux measurements with measurements done by hand with the SPLOT IRAF2 task for random sets of spectra. The code was then modified accordingly until automatic results were in reasonable agreement (within ~20%) with by-hand flux measurements.
The uncertainty of the line fluxes was estimated by propagating the uncertainty of the continuum level emission in the line-flux calculation. Emission-line flux measurements with signal-to-noise ratios lower than three were rejected and set to zero. Typically, relative errors are below ~5% for line fluxes brighter than ~1.5 × 10⁻¹⁵ erg s-1 cm-2 for all emission lines, except for [O ii]λλ3727,3729, for which relative errors are larger (~10%) at that flux level. Line flux relative errors increase by up to ~20% at flux levels of ~3 × 10-16 erg s-1 cm-2 for all lines except for [O ii]λλ3727,3729, where errors are typically larger (~25−30%).
We have empirically checked the quality of our emission-line measurements by comparing the emission-line ratios, [N ii]λ6548/[N ii]λ6584 and [O iii]λ4959/[O iii]λ5007, to their theoretical values. This is done in Fig. 1. The emission-line fluxes of both doublets correlate with each other, with correlation coefficients of 0.97 and 0.88 for the [O iii] and [N ii] doublets, respectively. The fitted slopes are 0.34 ± 0.01 and 0.37 ± 0.02 for [O iii]λ4959 vs. [O iii]λ5007, and [N ii]λ6548 vs. [N ii]λ6584, respectively, which are close to the theoretical value (i.e. 1/3) (Osterbrock & Ferland 2006). The dispersion in the [N ii]λ6548 vs. [N ii]λ6584 is larger than that in the [O iii] doublet, especially for higher values of [N ii]λ6584/Hβ. In general, the galaxies with larger deviations from the best linear fits are also those with larger error bars. This fact reinforces our flux error estimates, which seems to represent the real uncertainties in the measurements well. Data points with the largest deviation from the best fit are normally AGNs (especially for the [N ii] doublet). We only concentrate on non-AGN galaxies in this paper and, therefore, our results will not be affected by these larger uncertainties.
 |
Fig. 1 Comparison of the measured emission-line fluxes of the two lines in doublets [N ii]λλ6548, 6584 (left) and [O iii]λλ4959, 5007 (right) normalised to the Hβ emission-line flux. Purple points indicate galaxies classified as AGN (Sect. 4). The dashed green line shows the best linear fit to the data, which yields a slope of 0.37 ± 0.02 and 0.34 ± 0.01 for [N ii]λ6548/Hβ vs. [N ii]λ6584/Hβ, and [O iii]λ4959/Hβ vs. [O iii]λ5007/Hβ, respectively (see text in Sect. 3.2 for details). |
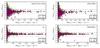 |
Fig. 2 Ratio of emission-line fluxes available in public databases to the fluxes measured in this work (FluxTW), for the OSSY (green circles) and MPA-JHU (pink squares) databases, as a function of the emission-line fluxes measured in this work for the [O ii]λλ3726,3729 (top left), [O iii]λ5007 (top right), Hα (bottom left), and [N ii]λ6583 (bottom right) emission-lines. All fluxes are corrected for Galactic extinction (see Sect. 3.3 for details). |
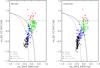 |
Fig. 3 Diagnostic diagrams to classify emission-line galaxies according to their dominant ionisation mechanism for the barred (left) and unbarred (right) galaxies of the sample. The solid and dash lines separate the region of star-forming galaxies from the region of AGN according to Kewley et al. (2001) and Kauffmann et al. (2003a), respectively. The horizontal dot-dashed line separates the AGN region into Seyfert and LINER galaxy regions (Kewley et al. 2006). |
3.3. Comparison with emission-line fluxes from other databases
We compared our emission-line flux measurements with those available in some public databases. The most popular public databases with emission-line fluxes are the MPA-JHU3 release of spectrum measurements (from SDSS DR7) and the OSSY4 database (Oh et al. 2011). As in our case, these databases also used the 7th release of the SDSS spectra. MPA-JHU line fluxes of extended sources are normalised to match the photometric fibre magnitude in the r-band. We removed this normalisation from the MPA-JHU data.
Figure 2 shows the comparison of the [O ii]λλ3727, 3729, [O iii]λ5007, Hα, and [N ii]λ6583 emission-line fluxes, measured by these databases, with our measurements from the spectra of our galaxy sample (Sect. 2). The three sets of data represented in Fig. 2 have been corrected for foreground Galactic reddening (but not for internal extinction). Our emission-line fluxes match fairly closely those from the OSSY and MPA-JHU databases. In general the fluxes match within ~20% for lines brighter than ~10-15 erg s-1 cm-2, except for [O ii]λλ3727,3729, where differences are within ~30%. For weaker lines, the scatter increases considerably, as a result of larger relative errors in the measurements.
For emission lines brighter than ≳3 × 10-15 erg s-1 cm-2, our fluxes match with the OSSY and MPA-JHU measurements to within ~4−6%, except for [N ii]λ6583 and Hα as measured by OSSY, which are, on average, ~8% higher than our measurements. Our measurements of [N ii]λ6583 and Hα are also systematically lower than those from MPA-JHU, but only by ~4% on average. For [O ii]λλ3727,3729 and [O iii]λ5007, however, our measurements are systematically ~5% higher than MPA-JHU measurements, and are a better match with the OSSY measurements (within ~2−3%). These systematic differences can, in part (but not completely), be explained by the use of different extinction laws for the correction of the foreground Galactic extinction. Our data was corrected using the Schlegel et al. (1998) maps and the Cardelli et al. (1989) extinction curve (see Cid Fernandes et al. 2005). The MPA-JHU data have been corrected using O’Donnell (1994). Differences of approximately ~3% at [O ii]λλ3727,3729 are expected for typical values of AV ~ 1−1.5 mag, given the differences in the extinction curves. The extinction curve used by OSSY authors is not specified.
In any case, differences between our observed fluxes and the ones available in the OSSY and MPA-JHU databases are small and comparable to measurement errors, even taking into account that the stellar emission subtraction, the flux measurement procedures, and the foreground Galactic reddening correction differ in the three sets of data.
4. Nuclear classification and removal of AGN
Our initial galaxy sample (see Sect. 2) includes active and normal galaxies. We used standard diagnostic diagrams based on bright emission-line ratios (also known as BPT diagrams, after Baldwin et al. 1981) to separate the galaxies where the dominant mechanism of ionisation is UV radiation from massive young stars (i.e. star-forming galaxies) from those galaxies being ionised by an active galactic nucleus (AGN). In Figs. 3a and b, we show the diagnostic diagrams based on our measured (non-extinction corrected5) ratios [O iii]λ5007/Hβ vs. [N ii]λ6584/Hα, for the barred and unbarred sub-samples of galaxies.
The solid line separates star-forming galaxies from AGN according to the predictions of the photoionisation models of Kewley et al. (2001), while the dashed line sets this separation empirically (Kauffmann et al. 2003a). Both lines do not match, and the number of AGN predicted by Kauffmann et al. (2003a) is larger than the theoretical prediction. We refer to the galaxies located between the two lines (i.e. classified as “star-forming” according to Kewley et al. 2001 and as AGN according to Kauffmann et al. 2003a) as transition objects. These are also known as composite objects and might be a population of objects where ionisation is partly produced by recent star-formation and partly due to an AGN (Kewley et al. 2006), but they might also include photoionised nuclei with high nitrogen abundance (Pérez-Montero & Contini 2009). For this reason we used the Kewley et al. (2001) criteria to remove AGN from our sample. The horizontal dot-dashed line separates the Seyfert region from the Low-Ionisation Nuclear-line Regions area (LINERs; Kewley et al. 2006).
According to this classification into star-forming, transition and AGN galaxies, the percentage of AGN in the sub-samples of barred and unbarred galaxies is 31% and 18%, respectively. In other words, there are ~1.7 times more AGN in barred than in unbarred galaxies. This factor remains when we consider the Kauffmann et al. (2003a) criteria, i.e. AGN (according to Kewley et al. 2001) plus transition objects are 1.7 times more frequent in the sub-sample of barred galaxies than in the unbarred galaxy sub-sample6. The fraction of AGN in barred galaxies increases when we consider galaxies with low-mass bulges. AGN are about twice as frequent in barred galaxies as in unbarred galaxies, if we only consider bulges with mass lower than 1010.1 M⊙.
Below, we consider all the galaxies of the sample, except those classified as AGN. We will refer to them as non-AGN galaxies, and this sample includes star-forming galaxies according to the criteria of Kauffmann et al. (2003a), transition objects, and unclassified galaxies (normally due to the non-detection of relevant emission lines involved in the BPT diagram). Our effective sample of non-AGN galaxies has 173 and 265 barred and unbarred galaxies, respectively.
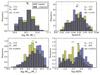 |
Fig. 4 Histograms showing the distribution of decimal logarithm of the total galaxy stellar mass, redshift, logarithm of bulge mass and logarithm of the B/D light ratio in the i band for barred (hatched yellow) and unbarred (purple) galaxies separately, for all the non-active galaxies of the sample. The number of galaxies in each sub-sample (NB and NU) is indicated, together with the two-sample Anderson-Darling test P-values (AD, expressed in %). The yellow and purple circles in the upper side of the panels indicate the median value of the barred and unbarred distributions, respectively. The horizontal error bar covers the 95% confidence interval (estimated as |

Classification of the galaxy sample.
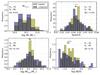 |
Fig. 5 Same as Fig. 4 but only for galaxies classified as “star-forming” according to Kauffmann et al. (2003a). NB and NU are the number of barred and unbarred galaxies, respectively, and AD is the two-sample Anderson-Darling test P-value (expressed in %). |
4.1. The characterisation of non-AGN and star-forming sub-samples
Figure 4 shows a comparison between the total galaxy stellar mass, redshift, bulge mass, and bulge-to-disc (B/D) light ratio (i-band) distributions for the sub-samples of barred and unbarred galaxies. The total stellar masses are taken from Kauffmann et al. (2003b) and are based on fitting to stellar spectral features (the 4000 Å break and the Balmer absorption line index HδA). The bulge masses come from Coelho & Gadotti (2011) (based on bulge luminosity and mass-to-light ratio in the i band) and the B/D light ratio comes from morphological decomposition performed by Gadotti (2009). The total galaxy stellar mass and redshift distributions are similar for barred and unbarred galaxies. To confirm this statistically we used the k-sample Anderson-Darling (hereinafter A-D) test (see Scholz & Stephens 1987; Stephens 1974)7. It tests the null hypothesis that the two samples are drawn from the same parent distribution. The output of the A-D test is a P-value or significance level at which the null hypothesis can be rejected. For the total stellar mass and redshift, we find P-values of ~37% and 54%, respectively. These values are much greater than the 5% threshold value normally adopted below which the result is statistically significant and the null hypothesis can be rejected. The distributions of bulge mass and B/D light ratio are, however, different between barred and unbarred galaxies when all non-AGN galaxies are considered. Median values and distribution shapes are different and the A-D tests confirms this difference, with P-values well below 0.1%. The bulges of barred galaxies are less massive than in unbarred galaxies and B/D light ratios are also lower for barred galaxies, even though both sub-samples of barred and unbarred galaxies have the same total stellar mass distributions. This has already been pointed out by Coelho & Gadotti (2011).
If we consider the sub-sample containing only galaxies classified as star-forming, Fig. 5 and the A-D test results indicate that the distributions of total stellar mass, redshift, bulge mass, and B/D light ratio are no different for barred and unbarred galaxies, since P-values are higher than 5% in all cases.
5. Internal extinction
The emission-line fluxes were corrected for internal extinction from the Balmer decrement using the Hα to Hβ emission-line flux ratio. In the absence of internal dust extinction, the Hα to Hβ line flux ratio, (FHα/FHβ)intr is equal to 2.86, for typical electron temperatures and densities in star-forming regions (Te ~ 10 000 K and ne ~100 cm-3), in the case B of the recombination theory (Osterbrock & Ferland 2006). The presence of dust in the interstellar medium increases this line ratio as a result of differential extinction. The amount of attenuation can be quantified with the parameter c(Hβ), the internal extinction at the Hβ emission line  (1)where the sub-indexes “obs” and “intr” stand for observed and intrinsic fluxes, respectively. The Hα to Hβ emission-line ratio together with an assumed extinction curve f(λ) can be used to obtain c(Hβ)
![\begin{equation} c({\rm H}\beta) = \frac{-1}{f(\ha)} \left[\log{\left(\frac{F_{\rm H\alpha}}{F_{\rm H\beta}}\right)_{\rm obs}} -\log{\left(\frac{F_{\rm H\alpha}}{F_{\rm H\beta}}\right)_{\rm intr}}\right] , \end{equation}](/articles/aa/full_html/2015/12/aa26191-15/aa26191-15-eq55.png) (2)where \begin{lxirformule}$f(\ha)$\end{lxirformule} is the reddening function at Hα normalised to Hβ (i.e. f(Hβ) = 0). We employed the Seaton (1979) reddening law with the Howarth (1983) parametrisation8, assuming RV = 3.1. With this combination of reddening law and RV, the extinction in magnitudes at Hα is AHα = 1.515 × c(Hβ). The intrinsic Hα to Hβ line flux ratio was assumed to be 2.86. We are aware that in the central regions of galaxies the metallicity might be oversolar, with Te lower than 10 000 K, and, therefore, this ratio may be higher than 2.9. Assuming an increased value of the Hα to Hβ line flux ratio would decrease all c(Hβ) values by 0.02, 0.06, and 0.1 for (FHα/FHβ)intr, equal to 2.9, 3.0, and 3.1, respectively.
(2)where \begin{lxirformule}$f(\ha)$\end{lxirformule} is the reddening function at Hα normalised to Hβ (i.e. f(Hβ) = 0). We employed the Seaton (1979) reddening law with the Howarth (1983) parametrisation8, assuming RV = 3.1. With this combination of reddening law and RV, the extinction in magnitudes at Hα is AHα = 1.515 × c(Hβ). The intrinsic Hα to Hβ line flux ratio was assumed to be 2.86. We are aware that in the central regions of galaxies the metallicity might be oversolar, with Te lower than 10 000 K, and, therefore, this ratio may be higher than 2.9. Assuming an increased value of the Hα to Hβ line flux ratio would decrease all c(Hβ) values by 0.02, 0.06, and 0.1 for (FHα/FHβ)intr, equal to 2.9, 3.0, and 3.1, respectively.
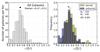 |
Fig. 6 Left: Histogram of the values of the Balmer extinction at the Hβ emission line, c(Hβ), for all galaxies of the sample with c(Hβ) > 0.0, except those classified as AGN as explained in Sect. 4. Right: same as for the left, except for barred (hatched yellow) and unbarred (purple) galaxies separately. The number of galaxies in each sub-sample, and the P-value from the A-D test for the two distributions, are shown below the figure legend. |
The histogram with the values of the Balmer extinction c(Hβ) for all galaxies of the sample (except AGN) is in the left-hand panel of Fig. 6. Values occur in the range 0−1.4, being the median value of the distribution (0.47 ± 0.03). We assign an internal extinction of zero when the observed Balmer ratio FHα/FHβ is lower than the theoretical value. These objects are not considered in Fig. 6. The distribution obtained is very similar in shape and values to that found by Stasińska et al. (2004) for 10 854 spectra from the first data release of the SDSS.
 |
Fig. 7 V-band extinction in magnitudes, AV,g, as obtained from the Hα to Hβ Balmer decrement, versus the stellar continuum V-band extinction (AV,s), as derived from the spectral synthesis-fitting with STARLIGHT for all non-AGN galaxies. The straight solid and dashed lines show the relations between AV,g and AV,s found by Calzetti et al. (2000) and Kreckel et al. (2013), respectively. |
Dust affects both the stellar continuum emission and the nebular emission. Figure 7 shows the V-band extinction in magnitudes derived from the gas emission lines (AV,g) versus the stellar continuum V-band extinction (AV,s), as derived from the spectral synthesis fitting with STARLIGHT (see Sect. 2). We should point out that the Cardelli et al. (1989) extinction curve was used in STARLIGHT, and we used Seaton (1979) for the gas component. However, both extinction curves give roughly the same extinction in the V-band (Seaton gives on average a higher extinction rate by ~0.8% in that spectral range). The dispersion is high, but it is clear from the figure that both quantities are correlated, and that the extinction derived from emission lines is typically about twice the extinction derived from the observed stellar continuum. This is in agreement with other author results, such as Calzetti et al. (2000) and Kreckel et al. (2013), who find AV,s = (0.44 ± 0.03)AV,g and AV,s = (0.470 ± 0.006)AV,g for H ii regions and starburst galaxies, respectively. These relations are overplotted in Fig. 7 and are compatible with our data in the range of extinction observed (AV,g from 0 to 3 mag).
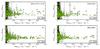 |
Fig. 8 Ratio of internal extinction corrected emission-line fluxes from the OSSY database to those measured in this work, as a function of the latter for the [O ii]λλ3726,3729 (top left), [O iii]λ5007 (top right), Hα (bottom left) and [N ii]λ6583 (bottom right) emission lines. All fluxes have been corrected for Galactic extinction and internal extinction (see Sect. 5 for details). |
All measured emission lines were corrected for internal dust extinction using the derived values for c(Hβ). The corrected emission-line fluxes have been compared with the corresponding values provided in one of the most popular public databases: OSSY (Oh et al. 2011). Figure 8 shows the comparison of extinction-corrected fluxes for some of the brightest emission lines. As can be seen, OSSY fluxes are typically larger than our extinction-corrected line fluxes by a factor of about 1.6 (~1.8 for [O ii]). Also, the OSSY colour excess tabulated values for the gas and the stellar continuum (called E(B−V)_gas and E(B−V)_star, respectively) do not maintain the relation mentioned above (Fig. 7). However, we would like to point out here that our observed (uncorrected) emission-line fluxes correspond extensively with OSSY quoted observed fluxes (see Sect. 3.3 and Fig. 2).
A table containing extinction-corrected line fluxes measured in this paper is available at the CDS. The table contains the following information: Col. 1 gives the SDSS plate used to collect the spectrum; Col. 2 the Modified Julian Date of the observation night (mjd); Col. 3 the SDSS fibre number; Cols. 4 to 25 the extinction-corrected emission-line fluxes normalised to Hβ = 100 and associated uncertainties; Cols. 26 and 28 give the Hβ flux in units of 10-17 erg s-1 cm-2 and the Balmer extinction at Hβ, respectively; and Cols. 27 and 29 give their corresponding uncertainties.
5.1. The distribution of c(Hβ) for barred and unbarred galaxies
The right-hand panel of Fig. 6 shows the distribution of c(Hβ) for barred and unbarred galaxies separately. The median value of c(Hβ) is only marginally larger in barred galaxies (0.50 ± 0.04) than in unbarred (0.44 ± 0.03), but the A-D test indicates that the two distributions differ, with a P-value of 0.8%, which is well below 5%. We find the same result when we only consider star-forming galaxies (see Table 2).
Previous work on the Balmer extinction at Hβ on large SDSS data samples (e.g. Stasińska et al. 2004) shows that c(Hβ) decreases from early- to late-type galaxies. Additionally, c(Hβ) also depends on total galaxy luminosity, being higher for the most luminous galaxies (and probably more massive). Our sub-sample of barred non-AGN galaxies is similar to the unbarred sub-sample in terms of total stellar mass (Fig. 4), but it is biased towards lower bulge mass and lower B/D light ratios compared with the sub-sample of unbarred galaxies. If we assume that the results obtained by Stasińska et al. (2004) for integrated spectral properties of galaxies are applicable to the inner kiloparsec of galaxies, we would predict a lower average of c(Hβ) in barred than in unbarred galaxies. However we find just the opposite, although differences in median values are only marginal (within error bars).
The sub-samples of barred and unbarred star-forming galaxies (Fig. 5) are equivalent in B/D light ratios, and bulge mass and their distributions of c(Hβ) are also different (P-value 0.6%), being larger in barred than in unbarred galaxies by ~0.07 dex, approximately the same difference as between the non-AGN barred and unbarred sub-samples. A larger central dust extinction might be related to a larger dust mass surface density (Kreckel et al. 2013) and, therefore, the observed difference in c(Hβ), although marginal, could be due to different central dust mass concentrations possibly resulting from the transfer of material towards the galaxy centres, induced by the bars.
Statistics for barred and unbarred non-AGN and star-forming galaxies.
6. Central oxygen abundance and N/O abundance ratio
The faint auroral emission lines are not generally detected in our optical spectra and, consequently, the electron temperature (Te) cannot be calculated. Therefore, it is not possible to determine abundances from the Te-based or direct method and the oxygen abundance can only be inferred through empirical or theoretical calibrations of nebular strong-line flux ratios, the strong-line methods (see Pérez-Montero & Díaz 2005; López-Sánchez et al. 2012, for in-depth discussions on different methods). We have used two of the most widely used tracers of gas oxygen abundance, R23 ≡ ([O iii]λλ4959,5007+[O ii]λλ3727)/Hβ, and N2 ≡log ([N ii]λ6583/Hα). The R23 parameter was first proposed by Pagel et al. (1979), but there are many different empirical and theoretical calibrations of this parameter (e.g. Pilyugin 2001; Pilyugin & Thuan 2005; McGaugh 1991; Kewley & Dopita 2002; Kobulnicky & Kewley 2004). The N2 was first proposed by Storchi-Bergmann et al. (1994) and has been extensively used, especially for intermediate and high redshift studies. This is because the lines involved are readily observable using the current generation of telescopes, and the line ratio is insensitive to reddening corrections due to the small wavelength separation between the two involved lines. Some of the most common calibrations of N2 include Denicoló et al. (2002), Pettini & Pagel (2004), Nagao et al. (2006) or Pérez-Montero & Contini (2009).
Our aim is to investigate potential differences between barred and unbarred galaxies, and therefore what follows only compares strong-line oxygen abundance indicators, without applying any of the existing calibrations. Figure 9 shows the comparison of the distribution of values for the R23 and N2 parameters for barred and unbarred non-AGN galaxies. Barred and unbarred galaxies seem to be indistinguishable in terms of the median value and distribution of the R23 parameter. There is, however, a striking difference in N2 where barred galaxies have enhanced log([N ii]λ6583/Hα) compared with unbarred galaxies by 0.10 dex (see Table 2), with both displaying significantly different distributions according to the A-D test (P-value below 0.001%). The two distributions of N2 are also different if we only consider star-forming galaxies (P-value 0.002%), and barred galaxies also have a larger average N2 than unbarred galaxies. However, the barred and unbarred difference in median values shortens to ~0.06 dex in the star-forming sub-sample, which is, in any case, much larger than the uncertainties in the median values.
It is well known that there is a positive mass-metallicity relation for spirals (e.g. Tremonti et al. 2004, Bothwell et al. 2013). We will analyse in detail the dependence of N2 and R23 with total stellar mass in Sect. 10. However, it should be noted that the mass distributions of our barred and unbarred sub-samples are identical and therefore the observed difference in N2 might indicate a real and strong physical difference in the centres of barred galaxies compared with unbarred galaxies.
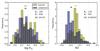 |
Fig. 9 Histograms of the values of the oxygen abundance indicators R23 = ([O iii]+[O ii])/Hβ (left) and N2 = log([N ii]λ6583/Hα) (right) for all non-AGN barred and unbarred galaxies in the sample. The number of objects in each sub-sample and the P-values from the A-D test are shown in each panel. |
Given that there are no differences between barred and unbarred galaxies in terms of the R23 parameter, any empirical calibration of this parameter yields no difference in oxygen abundance between barred and unbarred galaxies. The opposite happens with calibrations that make use of N2, except for the N2 empirical calibration by Pérez-Montero & Contini (2009), which includes a correction to account for the N/O ratio. We have estimated log (N/O) from the empirical calibration of the N2S2 ratio (=log ([N ii]λ6583/[S ii]λλ6717,6731) from the same authors. Afterwards, 12 + log (O/H) is calculated. We have also estimated log (N/O), 12 +log (O/H) and the ionisation parameter9, U, from the new grids of photoionisation models by Pérez-Montero (2014). The results are shown in Table 2 and in Fig. 10. The barred and unbarred sub-samples of galaxies have the same average oxygen abundance within errors, 12+log (O/H) = 8.69±0.01, and the distributions are indistinguishable from each other: we obtain A-D P-values of 4.3% and 7.4% when we consider non-AGN or star-forming galaxies, respectively. This agrees with recent results from Cacho et al. (2014) for a similar sample of barred and unbarred nearby disc galaxies from the Nair & Abraham (2010) catalogue. However, our result apparently conflicts with Ellison et al. (2011), who report a larger oxygen abundance (by ~0.06 dex) in barred galaxies compared to unbarred galaxies, in relation to a galaxy sample also extracted from Nair & Abraham (2010). In Sect. 12 we discuss these results and try to explain the possible sources of discrepancy between their results and ours.
However, as expected from the N2 values, we find a statistically significant and interesting difference in the central N/O abundance ratio found in barred and unbarred galaxies. The median log (N/O) is 0.09 dex larger in barred than in unbarred galaxies, for both the non-AGN and the star-forming samples. This difference is three times larger than the uncertainties in the median values (~0.03 dex). The A-D test confirms that the barred and unbarred distributions are different (mid-panel in Fig. 10), with P-values of 0.01% and 0.03% for the non-AGN and the star-forming samples, respectively. To our knowledge, this is the most obvious and largest difference in physical properties of the gas so far observed between barred and unbarred galaxies.
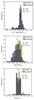 |
Fig. 10 Histograms of the oxygen abundance (top), N/O ratio (middle) and ionisation parameter (U, bottom), as calculated with the Pérez-Montero (2014) method for all non-AGN barred and unbarred galaxies in the sample. The number of objects in each sub-sample and the P-values from the A-D test are shown below the legend. Only non-AGN galaxies are considered. |
7. Star formation rate
We have estimated the star formation rate (SFR) in the galaxy centres from the Hα extinction-corrected emission within the 3′′ SDSS fibres and the Kennicutt (1998) conversion factor10. The distances to the galaxies have been estimated from the redshift given by SDSS and a Hubble constant of 72 km s-1 Mpc-1.
Given the redshift range of the galaxy sample, the SDSS 3′′ diameter fibre corresponds to a projected size ranging from ~1.2 to 4.2 kpc. Although the redshift range is small and the redshift distributions of barred and unbarred galaxies are similar, we have derived star formation rates per unit area, ΣSFR, to average out possible dependencies on galaxy distance.
The distributions of the logarithm ΣSFR for barred and unbarred galaxies are shown in Fig. 11. Both distributions are different according to the A-D test (P-value <0.1%), with barred galaxies showing marginally larger star formation rate per unit area. This difference is slightly larger when considering only star-forming galaxies, where barred galaxies show a median log ΣSFR which is ~0.3 dex larger than unbarred galaxies. A larger SFR in the centres of barred galaxies was also reported by Ellison et al. (2011) for galaxies of similar total stellar mass in a similar study, and by other authors (see e.g. Hummel et al. 1990; Ho et al. 1997b; Wang et al. 2012; Oh et al. 2012; Zhou et al. 2015).
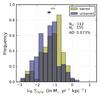 |
Fig. 11 Comparative histograms of star formation rate per unit area for all non-AGN barred (yellow hatched) and unbarred (purple) galaxies of the sample. |
8. Electron density
The [S ii]λ6717/[S ii]λ6731 line ratio is sensitive to the electron density (Ne). Nearly 8% of all galaxies in our sample have a [S ii]λ6717/[S ii]λ6731 line ratio which is above the low-density theoretical limit (=1.43, implying Ne ~ 1 cm-3, for Te = 10 000 K; Shaw & Dufour 1994). Most of these targets have the largest [S ii]λ6717/[S ii]λ6731 relative errors (~20−40%). Here, we only consider galaxies where their [S ii]λ6717/[S ii]λ6731 line ratio value is still compatible with being below the low-density theoretical limit, taking into account their corresponding error bars (López-Hernández et al. 2013). The median value of this line ratio in the centres of the non-AGN galaxy sample is 1.29±0.02 (1.30±0.02 for pure SF galaxies), which corresponds to Ne ~ 100−150 cm-3. This is in agreement with typical values found in centres of galaxies measured previously by Kennicutt et al. (1989) and Ho et al. (1997a). In Fig. 12 we compare the distributions [S ii]λ6717/[S ii]λ6731 for barred and unbarred non-AGN galaxies. The median value is marginally lower for barred (1.25±0.03) than for unbarred galaxies (1.31±0.03), indicating that, on average, barred galaxies tend to posses a larger central electron density than unbarred galaxies. The A-D test yields a very low P-value (0.05%), which indicates that both distributions are different. Distributions are also different in the sub-sample of pure star-forming galaxies (P-value of 0.7%, see Table 2).
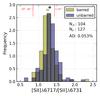 |
Fig. 12 Comparative histograms of values of the [S ii]λ6717/ [S ii]λ6731 line ratio for barred (yellow hatched) and unbarred (purple) galaxies separately. Only non-AGN galaxies are considered. |
9. Dependence of central differences on Hubble type
The amount of gas driven by a bar towards the galaxy centre might depend upon, amongst others, the availability of gas in galaxy disc and on the gravitational torque created by the bar-like mass distribution. Gas content varies across the Hubble sequence, but also bars in early-type galaxies tend to be longer and stronger than in late-type spirals (Erwin 2005; Chapelon et al. 1999). Our sub-samples of non-AGN galaxies are not similar in terms of B/D flux ratio and bulge mass (Fig. 4), which might indicate that both sub-samples are different in the relative population of morphological types. We next explore whether any of the differences between barred and unbarred galaxies found in previous sections could be due to a bias towards earlier types in the sub-sample of barred galaxies.
The fact that most of the differences between barred and unbarred galaxies of the non-AGN sub-sample are also observed in the pure star-forming sub-sample, where the distribution of bulge mass and bulge-to-disc flux ratio are equivalent for barred and unbarred galaxies (Fig. 5), seems to indicate that, even if a bias were present, bars tend to produce higher dust concentrations, larger N/O ratios, star formation, and electron densities in the centre of galaxies. A deeper analysis is, in any case, necessary to clarify the nature of these differences.
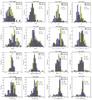 |
Fig. 13 Comparative histograms of (from top to bottom and from left to right): the Balmer extinction at the Hβ emission line, c(Hβ), N2, log R23, decimal logarithm of the SFR per unit area, [S ii]λ6717/[S ii]λ6731 line ratio, logarithm of the ionisation parameter, N/O abundance ratio and oxygen abundance for barred (yellow, hatched) and unbarred (purple) galaxies separately for early- and late-type galaxies. The separation between early- and late-type galaxies was carried out using the B/D luminosity ratio as described in Sect. 9 for the non-AGN sub-sample of galaxies. |
Statistics for the sub-samples of early- and late-type barred and unbarred galaxies.
Morphological classification is only available for ~46% of the total galaxy sample, i.e. 245 galaxies, of which 113 are barred and 132 unbarred. This classification comes from the Nair & Abraham (2010) catalogue. However, morphological decomposition of the galaxy sample has already been performed using the code BUDDA v2.111 (de Souza et al. 2004; Gadotti 2008, 2009) that is able to fit up to four different galactic components (a bulge with a Sèrsic profile, a single or double exponential disc, a Sèrsic bar, and a Moffat central component) to a galaxy image. The morphological decomposition of the galaxies from this sample was performed over SDSS g, r, and i-band images (Gadotti 2009) and the B/D flux ratios for the three photometric bands were therefore obtained.
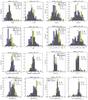 |
Fig. 14 Comparative histograms of (from top to bottom and from left to right): the Balmer extinction at the Hβ emission line, c(Hβ), R23, N2, logarithm of the ionisation parameter, logarithm of the SFR per unit area, the [S ii]λ6717/[S ii]λ6731 line ratio, logarithm of the ionisation parameter, N/O abundance ratio, and oxygen abundance for barred (yellow, hatched) and unbarred (purple) galaxies separately for non-AGN galaxies with bulge mass lower than 109.7 M⊙ and for galaxies with heavier bulges (≳109.7 M⊙). |
The behaviour of the B/D flux ratio along the Hubble sequence is well known. However, this relation has a high dispersion and varies significantly, depending on the function used to fit the bulge (R1/4 vs. Sèrsic R1 /n) on the photometric band or on the galaxy inclination and dust-extinction (see Graham & Worley 2008, and references therein). We have analysed the dependence of the logarithm of the g, r, and i-band B/D light ratios obtained with BUDDA (Gadotti 2009) with the T-type by Nair & Abraham (2010) for the galaxies in common between both samples. From these relations and additional information from the Galaxy Zoo 212 catalogue (Willett et al. 2013), we have separated all galaxies in our sample into early- (T-type < 2) and late-types (T-type  ). For more information on this separation, please see Appendix A.
The bulge stellar light and, therefore, its mass has been claimed as a key parameter that might distinguish galaxies across the Hubble sequence (e.g. Meisels & Ostriker 1984; Graham & Worley 2008, and references therein). In addition to the B/D light ratios we have also used the bulge mass (Coelho & Gadotti 2011) to explore whether the observed differences between barred and unbarred galaxies are dependent on Hubble types. We have separated all non-AGN galaxies into two groups according to their bulge mass. The dividing bulge mass (109.7 M⊙) has been selected to ensure that the total stellar galaxy mass distributions for barred and unbarred galaxies are equivalent in both bulge mass bins (with A-D P-values greater than 10%).
Figure 13 and Table 3 show a comparison of central properties between barred and unbarred galaxies separately for early- and late-type disc galaxies (using B/D light ratios, as explained above). The same comparison is made in Fig. 14 and Table 4 for galaxies with bulge mass below 109.7 M⊙ and bulge mass larger than or equal to 109.7 M⊙. It can be seen that for galaxies with later types (or less massive bulges), the distributions of all parameters except log R23 are different between barred and unbarred galaxies, with A-D P-values lower than 4% in all cases. For earlier type galaxies results depend on whether we split galaxies attending to B/D light ratios or bulge mass. Barred and unbarred earlier-type galaxies (according to B/D) only show different distributions for N2 and the [S ii]λ6717/[S ii]λ6731 emission-line ratio, while for galaxies with bulge mass above 109.7 M⊙, in addition to those parameters, we also find different distributions for ΣSFR and log (N/O).
Barred galaxies tend to have, on average, larger central Balmer Hβ extinction, larger values of the N2 metallicity indicator, SFR per unit area, electron densities and N/O abundance ratio than unbarred galaxies in all sub-samples. However, taking into account the uncertainties in the median values, we cannot claim real differences in average values between these parameters in barred and unbarred galaxies, apart from the N2 parameter and the N/O abundance ratio. N2 is clearly larger in barred late-type (by ~0.12 dex) and lower bulge-mass (by ~0.13 dex) galaxies compared with unbarred galaxies, while this difference is smaller (~0.07 dex), but still significant, in the early-type and higher bulge mass sub-sample. These differences between barred and unbarred galaxies in N2 translate into a larger N/O abundance ratio in barred galaxies by ~0.12 dex in low bulge-mass galaxies, and ~0.09 dex, in early-type, late-type and higher bulge-mass sub-samples.
Finally, if we restrict our comparative analysis of barred and unbarred galaxies to pure star-forming galaxies, we find the same result as with the non-AGN galaxies, i.e. late-type galaxies differ in central properties, depending on whether they have a bar or not, with barred galaxies exhibiting larger ΣSFR, c(Hβ), N2, log (N/O) and log U, and lower [S ii]λ6717/[S ii]λ6731 than unbarred galaxies. Also, similar to the non-AGN sample, the distribution of 12 +log (O/H) is different in barred and unbarred late-type galaxies and those with smaller bulge mass, with a marginally larger oxygen abundance in unbarred compared to barred galaxies. The results for late-type galaxies in both the pure star-forming and non-AGN samples, only differ for log R23. This shows a different distribution for barred and unbarred galaxies in the SF sample (although with identical median values). However, in the non-AGN sample, the distributions are identical in barred and unbarred galaxies (P-value 58%). The number statistics are poorer for SF galaxies, but this reveals that the inclusion of the transition objects does not determine our main results. We will comment further on this in Sect. 12.
In summary, we observe statistically significant differences in the distributions of parameters for barred and unbarred galaxies in our later-type galaxy sub-sample, regardless of whether we select them according to their predicted T-type (from their B/D light ratio) or their bulge mass. These differences appear in all parameters except in the metallicity tracer R23. Median values are only marginally different in most parameters (except in N2 and log (N/O)), but they point towards a larger ΣSFR, c(Hβ), N2, log (N/O) and log U, and lower [S ii]λ6717/[S ii]λ6731 in barred galaxies. Results for earlier-type galaxies depend on whether we select them according to B/D light ratio or bulge mass. However, with both criteria for dividing, the distributions of N2 and [S ii]λ6717/[S ii]λ6731 are significantly different between barred and unbarred galaxies. The difference in the median value of N2 for barred and unbarred galaxies is slightly smaller than in later-type galaxies but is still significant.
10. Barred versus unbarred difference trends with bulge and total stellar mass
Previous authors find observational evidence that massive barred galaxies have a higher current central-star-formation rate than unbarred galaxies of the same stellar mass (Ellison et al. 2011). However, we see above that the effect of bars in galaxy centres seems to be stronger or more visible in galaxies with lower bulge mass, even when the barred and unbarred sub-samples have been created to have indistinguishable total stellar mass distributions.
To better understand our own and previous authors’ results, we created a series of boxplots that show the variation of all parameters as a function of bulge and total stellar mass. Boxplots are a useful representation in our case, as sample sizes are not big enough to explore parameter dependences using histograms. Figure 16 shows boxplots for c(Hβ), N2, log R23, ΣSFR, [S ii]λ6717/[S ii]λ6731, log U, N/O, and oxygen abundance as a function of total galaxy stellar mass (see caption for a description on basic boxplots features). It is clear from these plots that, for the most massive galaxies, there is only a significant difference between barred and unbarred galaxies for the N/O abundance ratio. The most massive galaxies are also the galaxies with more massive bulges, and this result simply confirms the results from Sect. 9. For less massive galaxies (M⋆ ≲ 1010.8 M⊙), N2 and ΣSFR are clearly higher for barred than for unbarred galaxies, with non-overlapping box-notches between barred and unbarred galaxies in the two lowest mass intervals. Our results are, therefore, only partially in agreement with Ellison et al. (2011). We do find a larger fibre SFR in barred galaxies above 1010 M⊙, but we do not see differences in SFR between barred and unbarred galaxies above ~1010.8 M⊙.
The differences between barred and unbarred galaxies are undoubtedly better correlated with bulge stellar mass (see Fig. 17). All properties (except R23, log U and 12+log (O/H)) are significantly different between barred and unbarred galaxies for bulge masses ≲1010.0 M⊙, but differences normally increase towards lower bulge masses, except for c(Hβ) in the lowest mass bin, where the median values are similar within errors for both types of galaxies. The observed differences always suggest that barred galaxies present larger dust extinction, star formation rate per unit area, [N ii]/Hα line ratio, lower [S ii]λ6717/[S ii]λ6731 (indicating a higher electron density), and larger log (N/O) and log U in their centres.
We also note that the SFR per unit area is also larger on average for barred galaxies in the highest bulge mass bin. However, as mentioned above, we do not see differences in ΣSFR between barred and unbarred galaxies in the most massive galaxies (Fig. 16). This is probably because bulge masses of barred galaxies are lower than in unbarred galaxies for the most massive galaxies (Fig. 15), as already pointed out by Coelho & Gadotti (2011).
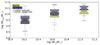 |
Fig. 15 Boxplot showing median values of bulge stellar mass for three different bins in total galaxy stellar mass. |
More massive bulges are typically classical bulges, with Sèrsic indexes higher than ~2.5, in contrast with the so called pseudo-bulges, whose surface brightness profile is better fitted with lower Sèrsic indexes and which are typically less massive than classical bulges (Gadotti 2009). We have also analysed the barred and unbarred galaxy central properties as a function of Sèrsic index. Barred and unbarred galaxies with large values of the Sèrsic index (n ≳ 3.1) do not differ in their central ionised gas properties, apart from the SFR, which seems to be enhanced in barred galaxies, in agreement with the result found for barred galaxies with the most massive bulges. However the global parameter dependences with the Sèrsic index and the differences between barred and unbarred galaxies are not as clear as with bulge mass or even total stellar mass.
11. Dependence on bar parameters
Previous sections show clear differences in the central ionised gas properties between barred and unbarred galaxies. These differences imply that the gas flows induced by bars are able to modify gas properties, especially in lower mass or lower bulge mass galaxies. Simulations predict a dependency between the gas inflow rate and the bar strength, with stronger bars supplying gas towards the centre at a higher rate (Athanassoula 1992; Regan & Teuben 2004). Thus, it is natural to wonder whether these observational enhancements are related to dynamical or structural bar parameters.
Morphological decomposition of the galaxy sample was performed by Gadotti (2009) and a number of structural parameters for discs, bulges and bars (in the case of barred galaxies) are thus available. This allows for a comparison between parameters such as bar ellipticity (as a proxy for bar strength) and bar length with central ionised gas properties. Our results are presented and compared with previous work below. The SFR per unit area (ΣSFR) shows a weak tendency to increase with the effective radius of the bar, the bar semi-major axis normalised to the galaxy disc scale length, and the bar ellipticity. However, the dispersion in these relations is high and the Spearman rank correlation coefficients (ρS) are 0.28, 0.20, and 0.12, respectively. For other parameters, such as the bar’s Sérsic index (which might be related to the bar’s age; Kim et al. 2015) ρS is lower than 0.1. This agrees with previous works on central SFRs from infrared emission (e.g. Pompea & Rieke 1990; Roussel et al. 2001), which did not find evidence that stronger bars could produce a larger enhancement in SFRs. Ellison et al. (2011) in turn, did not find a correlation between bar length and fibre SFR in the central region of galaxies from SDSS optical spectra. However, other authors have reported a positive relation between central star formation and bar parameters, but their results are, in some cases, conflicting: Oh et al. (2012) report a higher effect of bars on central SF but only for the reddest galaxies where the effects are more pronounced with increasing bar length. In contrast, other authors (Wang et al. 2012) find that only strong bars can enhance central SF, but the degree of enhancement depends solely on bar ellipticity, and not on bar size or bar mass. This matches with Zhou et al. (2015), who find a weak positive trend between SFR in bulges and an ellipticity-based bar strength parameter.
Several studies have also tried to confirm observationally the effect of bars on the central oxygen abundance and on the radial oxygen abundance gradient (e.g. Florido et al. 2012, and references therein), but results are also conflicting. For example, there is disagreement on whether bars produce a larger oxygen abundance in galaxy centres (e.g. Ellison et al. 2011), equal to that found in unbarred galaxies (e.g. Chapelon et al. 1999; Cacho et al. 2014) or whether O/H is lower in barred galaxies than in galaxies without a stellar bar (Considère et al. 2000; Dutil & Roy 1999). However there seems to be a consensus that neither central nor the O/H abundance gradient depends on bar strength (Chapelon et al. 1999; Considère et al. 2000; Cacho et al. 2014; Ellison et al. 2011). Our results agree with previous studies, since we also find no clear trend between 12+log(O/H) and bar parameters (effective radius, normalised length, ellipticity) with correlation coefficients ρS lower than 0.2, with a slightly better correlation with the bar boxiness (ρS = 0.32).
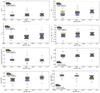 |
Fig. 16 Boxplots showing the distribution in c(Hβ), N2 = log([N ii]6583/Hα), R23, SFR per unit area and [S ii]λ6717/[S ii]λ6731 line ratio, decimal logarithm of the ionisation parameter, N/O abundance ratio and oxygen abundance, as a function of the total galaxy stellar mass (M⋆) for barred (yellow boxes) and unbarred (purple) galaxies. Each box represents the data distribution for galaxies in a 0.42 dex interval of logarithm in stellar mass centred at the abscissa axis values of the box position. Inside each box, the central horizontal black straight line marks the median value. The lower and upper quartiles are represented by the outer edges of the boxes, i.e. the box length is equal to the inter-quartile range, and therefore the box encloses 50% of the data points. The notches mark the 95% confidence interval for the median value. The whiskers extend to the most extreme data point within 1.5 times the inter-quartile range. Galaxies that do not fall within the reach of the whiskers are considered as outliers (yellow and purple circles for barred and unbarred galaxies, respectively). The number of galaxies in each box, in order or increasing stellar mass, ranges from 35 to 39, 55 to 59, and 13 to 14 for barred galaxies, and from 57 to 64, 58 to 70, and 15 to 21, for unbarred galaxies. |
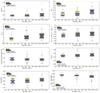 |
Fig. 17 Same as Fig. 16 but as a function of the bulge mass. Each box represents the data distribution for galaxies in a 0.85 dex interval of logarithm in bulge stellar mass centred at the abscissas values of the box position. The number of galaxies in each box, in order of increasing stellar bulge mass, ranges from 9 to 10, 66 to 71, and 28 to 32 for barred galaxies, and from 18 to 22, 70 to 81, and 28 to 32, for unbarred galaxies. |
We also find no correlation between the N/O abundance ratio and any bar parameter, with ρS lower than 0.1 in all cases, with the exception of a weak trend for the N/O to increase with the bar effective radius (ρS = 0.15). The c(Hβ) and the [S ii]λ6717/[S ii]λ6731 emission-line ratio do not show any clear dependence on bar parameters either (ρS ≲ 0.2).
12. Discussion
In this paper we perform a comparative analysis of the properties of the ionised gas in the centres of disc galaxies that possess a stellar bar, with those without a bar structure. Our analysis is based on SDSS spectra.
The SDSS fibre size (3′′) and our face-on galaxy sample redshift range (0.02  0.07) implies that, in this work, we are analysing emission of the ionised gas located within galactocentric radii of between approximately 0.6 and 2.1 kpc. The ionised gas-emitting regions located at these galactocentric distances are usually termed as “nuclear H ii regions” or “H ii region nucleus” when they are located in the immediate neighbourhood of a galactic centre, and “hotspots” or “circumnuclear H ii regions” when these regions surround the galaxy centre, frequently arranged in a ring or pseudo-ring shape (see e.g. Kennicutt et al. 1989; Ho et al. 1997a; Díaz et al. 2007). The spectroscopic studies of nuclear and circumnuclear spatially resolved H ii regions are still limited to a small number of targets. These have been the focus of previous in-depth spectroscopic studies, mainly with the aim of comparing the physical and stellar content properties to those of normal disc H ii regions (e.g. Kennicutt et al. 1989; Ho et al. 1997a; Bresolin & Kennicutt 2002), studying differences in properties with the Hubble-type of the host galaxy (Ho et al. 1997a) and/or deriving chemical abundances. These nuclear and circumnuclear H ii regions are expected to be those with the highest metal content because of their location in the inner parts of spiral discs (Díaz et al. 2007; Dors et al. 2011). To our knowledge no published work so far exists that compares the properties of resolved nuclear and circumnuclear H ii regions in barred and unbarred galaxies for a large number of galaxies in a systematic way.
Our derived values for internal Balmer extinction, [S ii]λ6717/[S ii]λ6731 ratio, oxygen abundance, and N/O ratio are within the values quoted by authors analysing individual, resolved nuclear, and circumnuclear H ii regions (e.g. Kennicutt et al. 1989; Bresolin & Kennicutt 2002; Díaz et al. 2007; Dors et al. 2008). Our finding, that the current SFR and electron density (as traced by [S ii]λ6717/[S ii]λ6731) are also larger in barred systems, is also in agreement with Ho et al. (1997b), who made a spectroscopic survey of the nuclei (using a 2′′×4′′ aperture) of nearly 500 nearby galaxies. In particular, they only found a larger SFR in barred galaxies earlier than Sbc, compared with unbarred counterparts, with no difference between barred and unbarred late-type spirals. We also find a larger average SFR per unit area in barred galaxies in our early-type sub-sample (see Fig. 13) but the distributions for barred and unbarred galaxies are only slightly different, while the difference in both distributions is statistically different for the late-type galaxies, according to the A-D test. We note that the most significant differences between barred and unbarred galaxies (in all gas properties) are obtained for lower bulge or total stellar mass galaxies (i.e. later-type galaxies). The total stellar galaxy or bulge mass distribution for the galaxy sample of Ho et al. (1997b) is not shown and we cannot go any further in comparing both results.
12.1. Enhanced [N II]λ6583/Hα in centres of barred galaxies
The most striking difference between barred and unbarred galaxies obtained in this work comes from the observed [N ii]λ6583/Hα emission-line ratio. An enhanced [N ii]λ6583/Hα emission-line ratio in the galaxy centres was first found by Stauffer (1982) and later by different authors (see, for example Kennicutt et al. 1989; Ho et al. 1997a; Sánchez et al. 2015). Ho et al. (1997a) analysed the integrated spectra of a sample of 206 galaxy nuclei. They reported that early-type galaxies had the largest [N ii]λ6583/Hα. According to these authors, it might be an indication that nitrogen is selectively enriched in the centres of bulge-dominated galaxies. This agrees with the general trend found in this work (without distinction between barred and unbarred systems), since early-type galaxies are also, on average, more massive, and they host bulges with a greater mass than late-type galaxies (see Figs. 16 and 17). In this work we go a step further and show that this line ratio is larger in the centres of barred galaxies and that the bar effect, in enhancing this line ratio, is more important in galaxies with less massive bulges.
A number of effects can enhance the [N ii]λ6583 to Hα emission-line ratio, namely the nitrogen excitation by a source other than photoionisation (i.e. AGN or shocks) that enhances the [N ii] emission, compared with emission from recombination lines, and a larger abundance of nitrogen atoms compared with oxygen.
We now analyse these cases separately. We have used the criteria of Kewley et al. (2001), based on the [O iii]λ5007/Hβ vs. [N ii]λ6583/Hα, to remove AGN from the galaxy sample. This separation criteria allows for objects of the composite area to be included, which may add a number of galaxies in which shocks or an AGN can enhance the [N ii]λ6583 emission, but also pure photoionised objects with high N/O ratio (Pérez-Montero & Contini 2009). We note that pure SF galaxies also show a significant difference in [N ii]λ6583/Hα between barred and unbarred galaxies (see Table 2). However, to check whether the use of Kewley et al. (2001) criteria includes a high number of shock-ionised barred galaxies, and enhances the observed differences (e.g. in the right-hand panel of Fig. 9) between barred and unbarred galaxies, we created Fig. 18. This figure shows [N ii]λ6583/Hα as a function of the shock and AGN sensitive [O i]λ6300/Hα line ratio. We can see that galaxies with large log([O i]λ6300/Hα) in their centres (≳–1) are also galaxies with high [N ii]λ6583/Hα and, according to the [O iii]λ5007/Hβ vs. [O i]λ6300/Hα BPT diagram, those galaxies would be classified as AGN (Kewley et al. 2006, circled in blue). However, there is roughly the same number of barred (11) and unbarred (10) galaxies in this area of the plot. Of those galaxies, only three barred galaxies and two unbarred galaxies would have been classified as AGN with the [O iii]λ5007/Hβ vs. [S ii]λλ6717, 6731/Hα diagram and the separation line given by Kewley et al. (2006), circled in green. The plot clearly shows that even by removing those galaxies, the average [N ii]λ6583/Hα is larger in barred than in unbarred galaxies.
In addition, if shocks or AGN excitation were responsible for a larger [N ii]λ6583/Hα in barred galaxies, we would also expect to see, on average, larger values in other AGN and shock-sensitive emission-line ratios, such as [O i]λ6300/Hα or [S ii]λλ6717, 6731/Hα, in barred galaxies when compared to their unbarred counterparts. The distributions of the three emission-line ratios are shown in Fig. 19. It is clear that the distributions are only significantly different in the case of [N ii]λ6583/Hα, while, in the case of [O i]λ6300/Hα and [S ii]λλ6717, 6731/Hα, the mean values for barred and unbarred galaxies are identical, and that the distributions are not statistically different, with A-D test P-values greater than 30%, compared to 0.0009% for [N ii]λ6583/Hα.
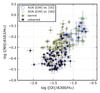 |
Fig. 18 Comparison of shock- and AGN-sensitive emission-line ratios [N ii]λ6583/Hα and [O i]λ6300/Hα for barred and unbarred galaxies. Galaxies that would be considered as AGN according to the [O iii]/Hβ vs. [O i]/Hα or [O iii]/Hβ vs. [S ii]/Hα diagrams and the Kewley et al. (2006) separation line are marked with blue and green circles, respectively. |
A difference in N/O abundance ratio in the centres of barred and unbarred galaxies is thus the most probable explanation for the observed enhancement in the [N ii]λ6583/Hα emission-line ratio in barred galaxies. But what is responsible for an over-abundance of nitrogen compared with oxygen in barred galaxies?
The N/O abundance ratio is a useful parameter to understand chemical evolution of galaxies (see e.g. Vila Costas & Edmunds 1993, Pérez-Montero & Contini 2009), as both elements are produced by different mechanisms and by stars of different masses. While oxygen is always primary and created in massive stars, nitrogen is synthesised via the CNO and CN cycles in H burning stars, and is mostly secondary (the seed C and O were already present in the placental cloud when the star formed) for metallicity higher than 12+log (O/H) = 8.3, while for low metallicity very little secondary N is produced. Also, N can be produced in stars of all masses, but mainly in intermediate mass (between 4 and 8 M⊙) stars (Henry et al. 2000). Consequently, in a single burst of star formation, we expect that most of the N will be released to the ISM after O, with a time-delay roughly equal to the stellar lifetime of the main producers of N (intermediate mass stars), i.e. from ~100 to 500 Myr after the oxygen was released. Star formation in spiral galaxies might be a continuous process (e.g. Gavazzi & Scodeggio 1996) which complicates this scenario. In addition, gas flows (within the galaxy and from outside) can also, in theory, alter the initial abundance ratios.
Both chemical evolution models (Mollá & Gavilán 2010) and observational works (Mallery et al. 2007) show that the N/O abundance ratio depends on the star formation history. In simple terms this means that, in a closed-box model and at a fixed metallicity, all that is required for a galaxy or region to increase its N/O is for its current SFR to be less than its past average SFR, so that comparatively fewer high mass stars are now formed. Thus, although newly synthesised oxygen is being released into the ISM from any massive stars that are currently forming, intermediate-mass stars from previous generations (when SFR was higher) have had time to evolve and a larger amount of N has been released into the ISM, increasing the N/O abundance ratio. However, metal-poor gas flows have a relatively small effect on the N/O abundance ratio according to some models (e.g. Edmunds 1990). While the oxygen abundance is significantly decreased during infall, as a result of dilution of the present gas, the N/O ratio is much less sensitive. The mass infall must be much larger than the galaxy mass (or bulge mass in our case) and the infall rate must be higher than the SFR to have any large deviations from the expected closed-box behaviour (Köppen & Hensler 2005).
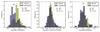 |
Fig. 19 Histograms showing the distribution of AGN and shock-sensitive emission-line ratios (from left to right: [N ii]λ6583/Hα, [S ii]λλ6717, 6731/Hα, and [O i]λ6300/Hα) for barred and unbarred galaxies separately. All galaxies classified as non-AGN are included (see Sect. 4). The barred/unbarred distributions are only different for [N ii]λ6583/Hα, and therefore the source of the differences in that line ratio must originate from something other than shock ionisation and/or AGN contamination alone. |
A different history of SF in the centre of barred galaxies compared with unbarred galaxies is expected from numerical simulations and can, at least, qualitatively explain the higher N/O abundance ratio observed in bulges less massive than ~ 109.7−1010 M⊙. Estimating the efficiency of the bar in transporting material to the centre, using numerical simulations, is not easy because the inflow rate strongly depends on the simulation and the chosen parameters (e.g. Kim et al. 2015). However, it is expected that the efficiency of the bar, in driving material to the galaxy centre will depend on the bar strength (e.g Martin & Friedli 1999; Regan & Teuben 2004). The gas flow in the bar gravitational potential will form shocks along the bar’s leading edges, giving way to gas flows towards the centre (e.g. Athanassoula 1992). The availability of gas in the disc will also alter the amount of gas accreted into the bulge region and, as the bar evolves and the gas reservoir diminishes, the inflow rate will also decrease (Athanassoula et al. 2005). Therefore strong gas flows can be expected soon after the bar forms, which presumably leads to SF in the inner parts (e.g. Cole et al. 2014). Later on, the bar weakens and gas flows continue to transport material towards the central regions, where it can form stars, but at a lower rate. Thus, according to chemical evolution models, this could explain the high N/O in barred galaxies compared with unbarred galaxies. Apart from bars, other mechanisms can produce gas flows towards the centre of the galaxies (holding or not a bar), for example tidal forces by an interacting companion (e.g. Cox et al. 2008) or asymmetric structures like spiral arms (e.g. Kormendy & Kennicutt 2004), but these might be more sporadic, and not produce a continuous flow, as in the case of barred galaxies.
Given that a considerably strong bar is present, late-type galaxies have a large reservoir of gas and can, therefore, supply a large amount of gas towards the centre. This is not the case for bulge-dominated galaxies and this might be, at least partially, one of the reasons why differences between barred and unbarred galaxies are smaller or non-existent in galaxies with massive bulges (≳1010 M⊙). The fact that we do not find differences in central N/O abundance ratio in the most massive bulges could indicate that bar effects on central gas properties are either negligible (maybe because there is not much gas in the disc to feed the inner parts) or invisible. This may be because there is another, more important and dominant, mechanism that masks the expected bar effects.
In any case, for massive bulges (which are also the ones with larger N/O abundance ratio, see Fig. 17) it would be more complicated to detect an increase in N/O in barred galaxies. The reason being that, given this time-delay scenario in the ejection of N, at high abundances the increase in the N/O abundance ratio is smaller (Coziol et al. 1999). However, the fact that we do not see differences in other properties (c(Hβ), 12+log (O/H), log U), or that these differences are smaller (as with ΣSFR or [S ii]λ6717/[S ii]λ6731) in the high bulge mass range, points towards a different bulge origin, formation, or evolutionary process, that is dependent on bulge mass (or total galaxy stellar mass).
Bulges are usually classified as two different types: disc-like bulges or pseudo-bulges, and classical bulges. The former are generally less massive than classical bulges and are more common among late-type galaxies. The formation of classical bulges is thought to be faster and normally externally driven, by means of gravitational collapse or hierarchical merging of smaller objects (see e.g. Gadotti 2009 or Athanassoula 2005, for details on the formation mechanisms of the different types), while disc-like bulges are thought to be formed by internal secular processes, predominantly driven by bars (e.g. Kormendy & Kennicutt 2004; Athanassoula 2005).
There is observational evidence for a delay in the bar formation for less massive galaxies (Sheth et al. 2012). Therefore, both bars and bulges in massive galaxies, as mentioned above, form at earlier times. These bulges might be classical as they form in more violent environments, with more gas and larger merger rates. Moreover, recent numerical simulations (Kraljic et al. 2012) show that the formation of bulges in spiral galaxies is influenced by the bar presence. They find an over abundance of star formation in the bulge for barred galaxies after the bar forms. It is thus possible that the difference observed in the central stellar metallicities of massive galaxies (Coelho & Gadotti 2011) is set at the time when the bar forms, and consumes and redistributes most of the gas. This would be compatible with the frequent co-existence of both type of bulges in the centres of galaxies as observed in previous works (Peletier et al. 2007; Méndez-Abreu et al. 2014; Erwin et al. 2015). In this scenario, low mass systems do not develop a massive classical bulge, and the bar will form at later times. Furthermore, the central gas accretion lasts longer, secularly forming disc-like bulges in barred galaxies. This would generate a difference in the ionised gas properties between barred and unbarred low-mass systems as observed in the present work.
Therefore, our result, that central properties of ionised gas vary predominantly in galaxies with lower mass bulges, gives strength to a different origin or evolutionary process for less and more massive bulges, with the gaseous phase of the former currently having a closer relation with bars.
12.2. Comparison with recent works
Several works have tried to find observational evidence for the effect of gas flows by analysing the gas content, SFRs and/or metallicities in galaxy centres (e.g. Ho et al. 1997b; Martin & Friedli 1999) but their results were inconclusive. This was, in part, because these works were carried out with small data samples and sample selections may have introduced biased results caused by, now well-known, relations between the analysed gas properties with Hubble type and/or total stellar mass. In an effort to side-step these problems, more recently Ellison et al. (2011) and Cacho et al. (2014) have comparatively analysed gaseous-phase metallicities and SFRs in the centres of barred and unbarred galaxies in large samples (from ~900 to 1500 galaxies, respectively) by using SDSS spectra. In both cases the galaxy samples have been taken from the catalogue of Nair & Abraham (2010)13, requiring axial ratios  (i.e.
(i.e.  °, compared to 26° in our sample) and redshift range
  and z< 0.1 in Ellison et al. (2011) and Cacho et al. (2014), respectively. Special care was taken by the authors to avoid biases due to differences in inclination, redshift and stellar mass between their barred and unbarred galaxy samples. However, and in spite of the similarity in their samples and in the data analysis, they arrive at differing results. While Ellison et al. (2011) find that the SFR and the oxygen abundance in the galaxy centres are considerably larger in barred galaxies more massive than 1010 M⊙ compared with unbarred galaxies of the same mass, Cacho et al. (2014) do not find statistically significant differences between barred and unbarred galaxies, only a trend (which decreases with increasing mass) in their early-type sub-sample, for barred galaxies to exhibit a larger 12+log (O/H) than unbarred galaxies.
The study presented here is in apparent disagreement with both Ellison et al. (2011) and Cacho et al. (2014), as we have found significant differences between barred and unbarred galaxies, but we did not see differences in the oxygen abundance between barred and unbarred galaxies. However, our results can explain, to a large extent, the disagreement of Ellison et al. (2011) and Cacho et al. (2014) results, both with each others’ and with ours. This mostly arises from the way in which star-forming galaxies are selected, and from the empirical calibration used to obtain oxygen abundances. Cacho et al. (2014) use Kauffmann et al. (2003a) to separate star-forming dominated galaxies from active galaxies, which rejects galaxies from the transition area, where pure star-forming galaxies with high nitrogen abundance are expected to be located (e.g. Pérez-Montero & Contini 2009). Ellison et al. (2011) and the present study use Kewley et al. (2001) and, therefore, include transition objects in our analysis. Our samples are thus expected to contain more nitrogen-rich galaxy centres. In addition, Ellison et al. (2011) use the [N ii]/[O ii] empirical calibration (Kewley & Dopita 2002) to obtain 12+log (O/H), which depends on the N/O abundance. We believe their reported larger 12+log (O/H) in barred galaxies might indicate a larger N/O abundance ratio in barred galaxies compared to unbarred galaxies. Cacho et al. (2014) use the R23 parameter to obtain oxygen abundances, but later on, in an effort to explain the differences with Ellison’s results, they apply the same empirical calibration as Ellison et al. (2011), [N ii]/[O ii]. With this calibration they also find larger 12+log (O/H) in barred galaxies compared to unbarred galaxies, but the difference is not as significant as in Ellison et al. (2011) because their sample lacks a significant number of nitrogen-rich galaxies, as explained above. We also get larger 12+log (O/H) in barred galaxies when using empirical calibrations involving [N ii]λ6584, such as the ones given by Pettini & Pagel (2004), Kewley & Dopita (2002) or Bresolin (2007), but no difference when R23 or the Pérez-Montero (2014) method is used, as described in Sect. 6.
Finally, we would like to mention the fact that Ellison et al. (2011) only find differences in the most massive galaxies of their sample (M⋆ ≳ 1010 M⊙) does not contradict our results, since our galaxy sample contains only galaxies more massive than 1010 M⊙. Our results do not match in that we do not find differences between barred and unbarred galaxies more massive than ~1010.8 M⊙, while Ellison et al. (2011) find larger SFRs and 12+log (O/H) up to their upper limit mass (~1011.2 M⊙).
We believe that the results presented here show the footprints of bar-induced secular evolution of galaxies in the central gaseous component, which seems to be either more efficient or more relevant in galaxies with less massive bulges (i.e. later-type galaxies), at least regarding the current central properties of the gas.
13. Summary and conclusions
We analysed the properties of the ionised gas in the centre of a sample containing 251 and 324 barred and unbarred face-on galaxies, respectively (173 and 265 after removing AGN, Kewley et al. 2001) of total stellar masses between 1010 and 1011.2 M⊙, where both sub-samples have the same total galaxy stellar mass and redshift distributions. We compared the distributions of internal extinction at Hβ, SFR per unit area (ΣSFR), [S ii]λλ6717, 6731 emission-line ratio, empirical tracers of oxygen abundance (R23 and N2 = [N ii]λ6854/Hα), oxygen abundance, N/O abundance ratio, and ionisation parameters, for barred and unbarred galaxies separately. Our main conclusions are summarised below.
-
The whole non-AGN barred galaxy sample has statistically significant different distributions of c(Hβ), ΣSFR, [S ii]λλ6717, 6731, N2, and log(N/O) in their centres compared with unbarred galaxies. The differences are remarkably evident in N2 and log(N/O), which are ~0.1 dex larger in barred than in unbarred galaxies. Barred galaxies also tend to have larger central internal extinction, ΣSFR, and electron density than unbarred galaxies, but in these cases the differences in median values between both distributions are within errors. We do not find differences between barred and unbarred galaxies, neither in the central value of the R23 parameter, nor in 12+log (O/H), as determined from the grids of photoionisation models by Pérez-Montero (2014).
When we split our sample into earlier and later types (according to their B/D light ratio or their bulge mass), the differences increase towards later-type galaxies. Especially significant is the difference in N2 that is ~0.13 dex larger in late-type barred galaxies compared to unbarred galaxies, against a difference of ~0.07 dex between barred and unbarred galaxies in the earlier-type sub-sample. This difference in N2 translates into a difference in N/O abundance ratio of 0.09–0.12 dex from photoionisation models. With this separation into earlier and later types, the oxygen abundance distribution appears to differ in barred and unbarred late-type galaxies, with a slightly larger median value for unbarred galaxies. There is no difference in 12+log (O/H) between barred and unbarred galaxies in the early-type sub-sample. In addition to 12+log (O/H), barred and unbarred early-type galaxies seem to have similar central c(Hβ), R23 and log U. The distributions of ΣSFR and N/O are different in barred and unbarred early-type galaxies (indicating larger median values in barred galaxies) depending on the way we separate early- from late-type galaxies.
-
The parameter differences between barred and unbarred galaxies increase for galaxies with lower mass systems and seem to correlate better with bulge mass, except for the SFR per unit area, which seems to have a stronger dependence on total galaxy stellar mass.
-
We find no clear relation between the central ionised gas properties in barred galaxies and the bar structural parameters (effective radius, bar length, ellipticity or bar Sèrsic index), but we do find weak trends for the central ΣSFR to increase with bar effective length.
-
The differences observed between barred and unbarred galaxies can be explained qualitatively with current knowledge of bar evolution simulations and chemical evolution models.
This work presents some of the clearest observational evidence so far for the effects of bars in galaxy centres. It also emphasises (1) the usefulness of the N/O abundance ratio, which gives important clues on star formation history of galaxy centres; and (2) the risk of using certain empirical calibrations for oxygen abundance estimations, which can mask a high N/O under a false high O abundance.
Online material
Appendix A: Bulge-to-disc flux ratios for different galaxy morphological types
The decrease of the B/D flux ratio along the Hubble sequence from early- to late-type galaxies is well known, but this ratio, among others, depends on the structural component-fitting procedure of the galaxy, on inclination, and on dust-extinction (see Graham & Worley 2008, and references therein). Morphological classification is only available from the largest catalogue so far (Nair & Abraham 2010) for less than 50% of our galaxy sample. Our aim here is to use the B/D flux ratios (Gadotti 2009) and the morphological classification in T-types for our sub-sample of galaxies included in the Nair & Abraham (2010) catalogue, to separate our galaxies into early- and late-types, according to their B/D flux ratios.
Figure A.1 shows the dependence of the logarithm of the g-, r-, and i-band B/D light ratios (from BUDDA, Gadotti 2009), with the corresponding T-type (Nair & Abraham 2010) for barred and unbarred galaxies occurring in both samples simultaneously. The top and bottom left-hand panels show this relation for the three different photometric bands, with small crosses for unbarred galaxies and small, filled circles for barred galaxies. The large crosses and big empty circles indicate the median log (B/D) value for each T-type value for unbarred and barred galaxies, respectively. As can be seen, there are no clear
differences between barred and unbarred galaxies. The bottom right-hand panel shows the median log (B/D) values, for barred and unbarred galaxies together, for each T-type for all photometric bands. The differences in the median B/D light ratio between the different bands are, in general, smaller than the error bars.
Our median values correspond well (within errors) to those from Graham & Worley (2008, their Fig. 6) in the T-type range in common (between T-type 0 and 5), except for T = 0, where we obtain a marginally larger B/D ratio in the r and i bands. These differences could arise from poor statistics at T = 0 in Graham & Worley (2008) (only three galaxies versus 30 in our sub-sample of galaxies are included in the Nair & Abraham (2010) catalogue).
We point out that a number of unbarred galaxies in our sample (~15), supposed to be disc galaxies, are classified with T-type ≤−3 by Nair & Abraham (2010), i.e. as ellipticals (see Figs. A.1 or A.2). These galaxies are very difficult to classify, since a face-on disc without spiral arms or a bar looks just like a round elliptical. Gadotti (2009) classified galaxies after looking at isophotal contours and the profile very carefully, but as stated in the cited paper, the estimated misclassification frequency is ~5−10%. With these uncertainties in mind, we have opted to keep these galaxies in our sample, and to consider them as S0 disc galaxies.
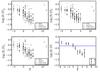 |
Fig. A.1 Logarithm of the B/D flux ratio in the g, r, and i-band versus morphological type (expressed as T-type) for the galaxies of the sample contained in the Nair & Abraham (2010) catalogue. Big crosses and big empty circles mark the median log (B/D) for each T-type value for unbarred and barred galaxies, respectively. The bottom right-hand panel shows the median log (B/D) in each band for each T-type value. Error bars represent the 95% confidence level of the median value for the distribution of B/D values at each T-type value. The blue solid straight line marks B/D = 0.5, that we have used to separate early from late-type galaxies. |
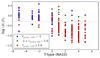 |
Fig. A.2 Decimal logarithm of the bulge-to-disc flux ratio in the i-band as a function of the morphological T-type, as given in the Nair & Abraham (2010) catalogue for the galaxies of our sample included in this catalogue. The colours represent different values of the predicted T-type Galaxy Zoo 2 parameter Willett et al. (2013). |
The B/D flux ratios decrease towards late-type spirals as expected. We have used this trend to create sub-samples dominated by early- or late-type spirals. In our sub-sample of galaxies included in the Nair & Abraham (2010) catalogue, a value of log (B/D) =−0.30 (or B/D = 0.5) more or less separates galaxies with T-type < 2 (earlier than Sa) from those later or equal to T-type =2 (Sab), but the contamination from late-types (with the previous definition) in the early-type sub-sample and vice versa is approximately 12% and 30%, respectively. The predicted T-type, as given in the Galaxy Zoo 214 catalogue (hereinafter GZ2 Willett et al. 2013), allows us to improve this separation. We then consider early-type galaxies as those galaxies of the sample with either B/D 0.5, or those having simultaneously B/D < 0.5 and T-type, as predicted by GZ2, lower than −1. Similarly, we consider as late-type galaxies those with B/D < 0.5 and a T-type as predicted by GZ2, larger than or equal to one. In this way we are able to include ~70% and 90% of the early (T-type < 2) and late types (T-type
  2) in the sub-samples of early- and late-type galaxies, respectively, and the contamination from late (early-types) in the early (late-type) sub-sample is ~10% (25%). These numbers are the same in all three bands. However, we have used the i-band, as the B/D flux ratio is available for all sample galaxies in this filter.
At this stage, we only considered as true detections those features having simultaneously: (a) a maximum central wavelength shift from the expected rest-frame wavelength smaller than 4.5 Å, and (b) either a FWHM within a factor or two, the FWHM of the [O ii]λλ3727, 3729 doublet, when the doublet was detected, or a FWHM between 2 and 45 Å when [O ii]λλ3727, 3729 was not detected.
Coelho & Gadotti (2011) used the AGN catalogue from Kauffmann et al. (2003a)http://www.mpa-garching.mpg.de/SDSS/DR4/Data/agncatalogue.html, to separate AGN galaxies from the whole sample. Their figures differ from the ones used in this work, in which classification comes from our emission-line measurements. However, in both cases AGN are ~1.7 times more frequent in barred than in unbarred galaxies.
The k-sample Anderson-Darling test is based on the Anderson-Darling rank statistics (Anderson & Darling 1954) for testing homogeneity of samples with possibly different sample sizes and unspecified distributions. The Anderson-Darling test is, in turn, a modification of the Kolmogorov-Smirnov test. The k-sample version of the test is more recommended than k-sample Kolmogorov-Smirnov for small sample sizes (e.g. Hou et al. 2009). See also discussion at https://asaip.psu.edu/Articles/beware-the-kolmogorov-smirnov-test
The relation of f(λ) with the function X(x) of the Howarth (1983) parametrisation is  , where x = 1 /λ (λ in microns), with xHβ the corresponding value for the Hβ spectral line. In this parametrisation, the extinction in magnitudes at a given wavelength λ is Aλ = X(x) E(B−V).
Regarding the ionisation parameter values derived from the grid of photoionisation models from Pérez-Montero (2014), it is important to stress that, in absence of emission-line ratios sensitive to the electron temperature, an empirical law between log U and 12 +log (O/H) is assumed (i.e. lower U for higher O/H). Nevertheless, in the grid a certain range of variation in log U is allowed for each O/H value that exceeds the expected and reported log U variations in our sample of studied objects. As such, we think that the resulting log U values give an accurate idea of the variations.
Bars are visually classified in the Nair & Abraham (2010) catalogue.
Acknowledgments
We thank the anonymous referee for his/her constructive comments which improved the paper. We acknowledge Joerg Dietrich for kindly sharing with us his python script to perform the k-sample Anderson-Darling test and William Schoenell for help in understanding STARLIGHT output spectra. This work has been supported by MICINN of Spain via grants AYA2011-24728, AYA2014-53506-P (EF, IP and AZ), FPA2010-16802 (EF) and AYA2010-21887-C04-01 (EPM), and from the “Junta de Andalucía” local government through the FQM-108 project (AZ, IP and EF).
References
- Anderson, T. W., & Darling, D. A. 1954, J. Am. Statist. Assoc., 49, 765 [Google Scholar]
- Athanassoula, E. 1992, MNRAS, 259, 345 [NASA ADS] [CrossRef] [Google Scholar]
- Athanassoula, E. 2003, MNRAS, 341, 1179 [NASA ADS] [CrossRef] [Google Scholar]
- Athanassoula, E. 2005, MNRAS, 358, 1477 [NASA ADS] [CrossRef] [Google Scholar]
- Athanassoula, E., Lambert, J. C., & Dehnen, W. 2005, MNRAS, 363, 496 [NASA ADS] [CrossRef] [Google Scholar]
- Athanassoula, E., Machado, R. E. G., & Rodionov, S. A. 2013, MNRAS, 429, 1949 [NASA ADS] [CrossRef] [Google Scholar]
- Baldwin, J. A., Phillips, M. M., & Terlevich, R. 1981, PASP, 93, 5 [NASA ADS] [CrossRef] [EDP Sciences] [Google Scholar]
- Barnes, J. E., & Hernquist, L. 1992, ARA&A, 30, 705 [NASA ADS] [CrossRef] [Google Scholar]
- Bothwell, M. S., Maiolino, R., Kennicutt, R., et al. 2013, MNRAS, 433, 1425 [NASA ADS] [CrossRef] [Google Scholar]
- Bournaud, F., & Combes, F. 2002, A&A, 392, 83 [NASA ADS] [CrossRef] [EDP Sciences] [Google Scholar]
- Bresolin, F. 2007, ApJ, 656, 186 [NASA ADS] [CrossRef] [Google Scholar]
- Bresolin, F., & Kennicutt, Jr., R. C. 2002, ApJ, 572, 838 [NASA ADS] [CrossRef] [Google Scholar]
- Cacho, R., Sánchez-Blázquez, P., Gorgas, J., & Pérez, I. 2014, MNRAS, 442, 2496 [NASA ADS] [CrossRef] [Google Scholar]
- Calzetti, D., Armus, L., Bohlin, R. C., et al. 2000, ApJ, 533, 682 [NASA ADS] [CrossRef] [Google Scholar]
- Cardelli, J. A., Clayton, G. C., & Mathis, J. S. 1989, ApJ, 345, 245 [NASA ADS] [CrossRef] [Google Scholar]
- Chapelon, S., Contini, T., & Davoust, E. 1999, A&A, 345, 81 [NASA ADS] [Google Scholar]
- Cheung, E., Athanassoula, E., Masters, K. L., et al. 2013, ApJ, 779, 162 [NASA ADS] [CrossRef] [Google Scholar]
- Cid Fernandes, R., Mateus, A., Sodré, L., Stasińska, G., & Gomes, J. M. 2005, MNRAS, 358, 363 [NASA ADS] [CrossRef] [Google Scholar]
- Coelho, P., & Gadotti, D. A. 2011, ApJ, 743, L13 [NASA ADS] [CrossRef] [Google Scholar]
- Cole, D. R., Debattista, V. P., Erwin, P., Earp, S. W. F., & Roškar, R. 2014, MNRAS, 445, 3352 [NASA ADS] [CrossRef] [Google Scholar]
- Considère, S., Coziol, R., Contini, T., & Davoust, E. 2000, A&A, 356, 89 [NASA ADS] [Google Scholar]
- Coziol, R., Reyes, R. E. C., Considère, S., Davoust, E., & Contini, T. 1999, A&A, 345, 733 [NASA ADS] [Google Scholar]
- de Souza, R. E., Gadotti, D. A., & dos Anjos, S. 2004, ApJS, 153, 411 [NASA ADS] [CrossRef] [Google Scholar]
- Denicoló, G., Terlevich, R., & Terlevich, E. 2002, MNRAS, 330, 69 [NASA ADS] [CrossRef] [Google Scholar]
- Díaz, Á. I., Terlevich, E., Castellanos, M., & Hägele, G. F. 2007, MNRAS, 382, 251 [NASA ADS] [CrossRef] [Google Scholar]
- Dors, Jr., O. L., Storchi-Bergmann, T., Riffel, R. A., & Schimdt, A. A. 2008, A&A, 482, 59 [NASA ADS] [CrossRef] [EDP Sciences] [Google Scholar]
- Dors, Jr., O. L., Krabbe, A., Hägele, G. F., & Pérez-Montero, E. 2011, MNRAS, 415, 3616 [NASA ADS] [CrossRef] [Google Scholar]
- Dutil, Y., & Roy, J.-R. 1999, ApJ, 516, 62 [NASA ADS] [CrossRef] [Google Scholar]
- Edmunds, M. G. 1990, MNRAS, 246, 678 [NASA ADS] [Google Scholar]
- Edmunds, M. G., & Pagel, B. E. J. 1978, MNRAS, 185, 77P [NASA ADS] [CrossRef] [Google Scholar]
- Ellison, S. L., Nair, P., Patton, D. R., et al. 2011, MNRAS, 416, 2182 [NASA ADS] [CrossRef] [Google Scholar]
- Erwin, P. 2005, MNRAS, 364, 283 [NASA ADS] [CrossRef] [Google Scholar]
- Erwin, P., Saglia, R. P., Fabricius, M., et al. 2015, MNRAS, 446, 4039 [NASA ADS] [CrossRef] [Google Scholar]
- Florido, E., Pérez, I., Zurita, A., & Sánchez-Blázquez, P. 2012, A&A, 543, A150 [NASA ADS] [CrossRef] [EDP Sciences] [Google Scholar]
- Friedli, D., & Benz, W. 1993, A&A, 268, 65 [NASA ADS] [Google Scholar]
- Friedli, D., Benz, W., & Kennicutt, R. 1994, ApJ, 430, L105 [NASA ADS] [CrossRef] [Google Scholar]
- Gadotti, D. A. 2008, MNRAS, 384, 420 [NASA ADS] [CrossRef] [Google Scholar]
- Gadotti, D. A. 2009, MNRAS, 393, 1531 [NASA ADS] [CrossRef] [Google Scholar]
- Gavazzi, G., & Scodeggio, M. 1996, A&A, 312, L29 [NASA ADS] [Google Scholar]
- Graham, A. W., & Worley, C. C. 2008, MNRAS, 388, 1708 [NASA ADS] [CrossRef] [Google Scholar]
- Henry, R. B. C., Edmunds, M. G., & Köppen, J. 2000, ApJ, 541, 660 [NASA ADS] [CrossRef] [Google Scholar]
- Ho, L. C., Filippenko, A. V., & Sargent, W. L. W. 1997a, ApJ, 487, 579 [NASA ADS] [CrossRef] [Google Scholar]
- Ho, L. C., Filippenko, A. V., & Sargent, W. L. W. 1997b, ApJ, 487, 591 [NASA ADS] [CrossRef] [Google Scholar]
- Hou, A., Parker, L. C., Harris, W. E., & Wilman, D. J. 2009, ApJ, 702, 1199 [NASA ADS] [CrossRef] [Google Scholar]
- Howarth, I. D. 1983, MNRAS, 203, 301 [NASA ADS] [CrossRef] [Google Scholar]
- Hummel, E., van der Hulst, J. M., Kennicutt, R. C., & Keel, W. C. 1990, A&A, 236, 333 [NASA ADS] [Google Scholar]
- Kauffmann, G., Heckman, T. M., Tremonti, C., et al. 2003a, MNRAS, 346, 1055 [Google Scholar]
- Kauffmann, G., Heckman, T. M., White, S. D. M., et al. 2003b, MNRAS, 341, 33 [NASA ADS] [CrossRef] [Google Scholar]
- Kennicutt, Jr., R. C. 1998, ApJ, 498, 541 [NASA ADS] [CrossRef] [Google Scholar]
- Kennicutt, Jr., R. C., Keel, W. C., & Blaha, C. A. 1989, AJ, 97, 1022 [NASA ADS] [CrossRef] [Google Scholar]
- Kewley, L. J., & Dopita, M. A. 2002, ApJS, 142, 35 [NASA ADS] [CrossRef] [Google Scholar]
- Kewley, L. J., Dopita, M. A., Sutherland, R. S., Heisler, C. A., & Trevena, J. 2001, ApJ, 556, 121 [Google Scholar]
- Kewley, L. J., Groves, B., Kauffmann, G., & Heckman, T. 2006, MNRAS, 372, 961 [NASA ADS] [CrossRef] [Google Scholar]
- Kim, T., Sheth, K., Gadotti, D. A., et al. 2015, ApJ, 799, 99 [NASA ADS] [CrossRef] [Google Scholar]
- Kobulnicky, H. A., & Kewley, L. J. 2004, ApJ, 617, 240 [NASA ADS] [CrossRef] [Google Scholar]
- Köppen, J., & Hensler, G. 2005, A&A, 434, 531 [NASA ADS] [CrossRef] [EDP Sciences] [Google Scholar]
- Kormendy, J., & Kennicutt, Jr., R. C. 2004, ARA&A, 42, 603 [NASA ADS] [CrossRef] [Google Scholar]
- Kraljic, K., Bournaud, F., & Martig, M. 2012, ApJ, 757, 60 [NASA ADS] [CrossRef] [Google Scholar]
- Kreckel, K., Groves, B., Schinnerer, E., et al. 2013, ApJ, 771, 62 [NASA ADS] [CrossRef] [Google Scholar]
- López-Hernández, J., Terlevich, E., Terlevich, R., et al. 2013, MNRAS, 430, 472 [NASA ADS] [CrossRef] [Google Scholar]
- López-Sánchez, Á. R., Dopita, M. A., Kewley, L. J., et al. 2012, MNRAS, 426, 2630 [NASA ADS] [CrossRef] [Google Scholar]
- Mallery, R. P., Kewley, L., Rich, R. M., et al. 2007, ApJS, 173, 482 [NASA ADS] [CrossRef] [Google Scholar]
- Martel, H., Kawata, D., & Ellison, S. L. 2013, MNRAS, 431, 2560 [NASA ADS] [CrossRef] [Google Scholar]
- Martin, P., & Friedli, D. 1999, A&A, 346, 769 [NASA ADS] [Google Scholar]
- Martinet, L., & Friedli, D. 1997, A&A, 323, 363 [NASA ADS] [Google Scholar]
- McGaugh, S. S. 1991, ApJ, 380, 140 [NASA ADS] [CrossRef] [Google Scholar]
- Meisels, A., & Ostriker, J. P. 1984, AJ, 89, 1451 [NASA ADS] [CrossRef] [Google Scholar]
- Méndez-Abreu, J., Debattista, V. P., Corsini, E. M., & Aguerri, J. A. L. 2014, A&A, 572, A25 [NASA ADS] [CrossRef] [EDP Sciences] [Google Scholar]
- Mollá, M., & Gavilán, M. 2010, Mem. Soc. Astron. It., 81, 992 [NASA ADS] [Google Scholar]
- Nagao, T., Maiolino, R., & Marconi, A. 2006, A&A, 459, 85 [NASA ADS] [CrossRef] [EDP Sciences] [Google Scholar]
- Nair, P. B., & Abraham, R. G. 2010, ApJS, 186, 427 [NASA ADS] [CrossRef] [Google Scholar]
- O’Donnell, J. E. 1994, ApJ, 422, 158 [NASA ADS] [CrossRef] [Google Scholar]
- Oh, K., Sarzi, M., Schawinski, K., & Yi, S. K. 2011, ApJS, 195, 13 [NASA ADS] [CrossRef] [Google Scholar]
- Oh, S., Oh, K., & Yi, S. K. 2012, ApJS, 198, 4 [Google Scholar]
- Osterbrock, D. E., & Ferland, G. J. 2006, Astrophysics of gaseous nebulae and active galactic nuclei (University Science Books) [Google Scholar]
- Pagel, B. E. J., Edmunds, M. G., Blackwell, D. E., Chun, M. S., & Smith, G. 1979, MNRAS, 189, 95 [NASA ADS] [CrossRef] [Google Scholar]
- Peletier, R. F., Falcón-Barroso, J., Bacon, R., et al. 2007, MNRAS, 379, 445 [NASA ADS] [CrossRef] [Google Scholar]
- Pérez-Montero, E. 2014, MNRAS, 441, 2663 [NASA ADS] [CrossRef] [Google Scholar]
- Pérez-Montero, E., & Contini, T. 2009, MNRAS, 398, 949 [NASA ADS] [CrossRef] [Google Scholar]
- Pérez-Montero, E., & Díaz, A. I. 2005, MNRAS, 361, 1063 [NASA ADS] [CrossRef] [Google Scholar]
- Pettini, M., & Pagel, B. E. J. 2004, MNRAS, 348, L59 [NASA ADS] [CrossRef] [Google Scholar]
- Pfenniger, D., & Norman, C. 1990, ApJ, 363, 391 [NASA ADS] [CrossRef] [Google Scholar]
- Pilyugin, L. S. 2001, A&A, 369, 594 [NASA ADS] [CrossRef] [EDP Sciences] [Google Scholar]
- Pilyugin, L. S., & Thuan, T. X. 2005, ApJ, 631, 231 [NASA ADS] [CrossRef] [MathSciNet] [Google Scholar]
- Pompea, S. M., & Rieke, G. H. 1990, ApJ, 356, 416 [NASA ADS] [CrossRef] [Google Scholar]
- Regan, M. W., & Teuben, P. J. 2004, ApJ, 600, 595 [NASA ADS] [CrossRef] [Google Scholar]
- Regan, M. W., Vogel, S. N., & Teuben, P. J. 1997, ApJ, 482, L143 [NASA ADS] [CrossRef] [Google Scholar]
- Roussel, H., Sauvage, M., Vigroux, L., et al. 2001, A&A, 372, 406 [NASA ADS] [CrossRef] [EDP Sciences] [Google Scholar]
- Sakamoto, K., Okumura, S. K., Ishizuki, S., & Scoville, N. Z. 1999, ApJ, 525, 691 [NASA ADS] [CrossRef] [Google Scholar]
- Sánchez, S. F., Pérez, E., Rosales-Ortega, F. F., et al. 2015, A&A, 574, A47 [NASA ADS] [CrossRef] [EDP Sciences] [Google Scholar]
- Schlegel, D. J., Finkbeiner, D. P., & Davis, M. 1998, ApJ, 500, 525 [NASA ADS] [CrossRef] [Google Scholar]
- Scholz, F. W., & Stephens, M. A. 1987, J. Am. Statist. Assoc., 82, 918 [Google Scholar]
- Seaton, M. J. 1979, MNRAS, 187, 73P [NASA ADS] [CrossRef] [Google Scholar]
- Sellwood, J. A., & Wilkinson, A. 1993, Rep. Progr. Phys., 56, 173 [Google Scholar]
- Shaw, R. A., & Dufour, R. J. 1994, in Astronomical Data Analysis Software and Systems III, eds. D. R. Crabtree, R. J. Hanisch, & J. Barnes, ASP Conf. Ser., 61, 327 [Google Scholar]
- Shen, J., & Sellwood, J. A. 2004, ApJ, 604, 614 [NASA ADS] [CrossRef] [Google Scholar]
- Sheth, K., Vogel, S. N., Regan, M. W., Thornley, M. D., & Teuben, P. J. 2005, ApJ, 632, 217 [NASA ADS] [CrossRef] [Google Scholar]
- Sheth, K., Melbourne, J., Elmegreen, D. M., et al. 2012, ApJ, 758, 136 [NASA ADS] [CrossRef] [Google Scholar]
- Shlosman, I., Frank, J., & Begelman, M. C. 1989, Nature, 338, 45 [NASA ADS] [CrossRef] [Google Scholar]
- Stasińska, G., Mateus, Jr., A., Sodré, Jr., L., & Szczerba, R. 2004, A&A, 420, 475 [NASA ADS] [CrossRef] [EDP Sciences] [Google Scholar]
- Stauffer, J. R. 1982, ApJ, 262, 66 [NASA ADS] [CrossRef] [Google Scholar]
- Stephens, M. A. 1974, J. Am. Statist. Assoc., 347, 730 [Google Scholar]
- Storchi-Bergmann, T., Calzetti, D., & Kinney, A. L. 1994, ApJ, 429, 572 [NASA ADS] [CrossRef] [Google Scholar]
- Tremonti, C. A., Heckman, T. M., Kauffmann, G., et al. 2004, ApJ, 613, 898 [NASA ADS] [CrossRef] [Google Scholar]
- Vazdekis, A., Sánchez-Blázquez, P., Falcón-Barroso, J., et al. 2010, MNRAS, 404, 1639 [NASA ADS] [Google Scholar]
- Vila Costas, M. B., & Edmunds, M. G. 1993, MNRAS, 265, 199 [NASA ADS] [CrossRef] [Google Scholar]
- Wang, J., Kauffmann, G., Overzier, R., et al. 2012, MNRAS, 423, 3486 [NASA ADS] [CrossRef] [Google Scholar]
- Willett, K. W., Lintott, C. J., Bamford, S. P., et al. 2013, MNRAS, 435, 2835 [NASA ADS] [CrossRef] [Google Scholar]
- Zhou, Z.-M., Cao, C., & Wu, H. 2015, AJ, 149, 1 [NASA ADS] [CrossRef] [Google Scholar]
- Zurita, A., Relaño, M., Beckman, J. E., & Knapen, J. H. 2004, A&A, 413, 73 [NASA ADS] [CrossRef] [EDP Sciences] [Google Scholar]
All Tables
Statistics for the sub-samples of early- and late-type barred and unbarred galaxies.
All Figures
|
Fig. 1 Comparison of the measured emission-line fluxes of the two lines in doublets [N ii]λλ6548, 6584 (left) and [O iii]λλ4959, 5007 (right) normalised to the Hβ emission-line flux. Purple points indicate galaxies classified as AGN (Sect. 4). The dashed green line shows the best linear fit to the data, which yields a slope of 0.37 ± 0.02 and 0.34 ± 0.01 for [N ii]λ6548/Hβ vs. [N ii]λ6584/Hβ, and [O iii]λ4959/Hβ vs. [O iii]λ5007/Hβ, respectively (see text in Sect. 3.2 for details). |
| In the text | |
|
Fig. 2 Ratio of emission-line fluxes available in public databases to the fluxes measured in this work (FluxTW), for the OSSY (green circles) and MPA-JHU (pink squares) databases, as a function of the emission-line fluxes measured in this work for the [O ii]λλ3726,3729 (top left), [O iii]λ5007 (top right), Hα (bottom left), and [N ii]λ6583 (bottom right) emission-lines. All fluxes are corrected for Galactic extinction (see Sect. 3.3 for details). |
| In the text | |
|
Fig. 3 Diagnostic diagrams to classify emission-line galaxies according to their dominant ionisation mechanism for the barred (left) and unbarred (right) galaxies of the sample. The solid and dash lines separate the region of star-forming galaxies from the region of AGN according to Kewley et al. (2001) and Kauffmann et al. (2003a), respectively. The horizontal dot-dashed line separates the AGN region into Seyfert and LINER galaxy regions (Kewley et al. 2006). |
| In the text | |
|
Fig. 4 Histograms showing the distribution of decimal logarithm of the total galaxy stellar mass, redshift, logarithm of bulge mass and logarithm of the B/D light ratio in the i band for barred (hatched yellow) and unbarred (purple) galaxies separately, for all the non-active galaxies of the sample. The number of galaxies in each sub-sample (NB and NU) is indicated, together with the two-sample Anderson-Darling test P-values (AD, expressed in %). The yellow and purple circles in the upper side of the panels indicate the median value of the barred and unbarred distributions, respectively. The horizontal error bar covers the 95% confidence interval (estimated as |
| In the text | |
|
Fig. 5 Same as Fig. 4 but only for galaxies classified as “star-forming” according to Kauffmann et al. (2003a). NB and NU are the number of barred and unbarred galaxies, respectively, and AD is the two-sample Anderson-Darling test P-value (expressed in %). |
| In the text | |
|
Fig. 6 Left: Histogram of the values of the Balmer extinction at the Hβ emission line, c(Hβ), for all galaxies of the sample with c(Hβ) > 0.0, except those classified as AGN as explained in Sect. 4. Right: same as for the left, except for barred (hatched yellow) and unbarred (purple) galaxies separately. The number of galaxies in each sub-sample, and the P-value from the A-D test for the two distributions, are shown below the figure legend. |
| In the text | |
|
Fig. 7 V-band extinction in magnitudes, AV,g, as obtained from the Hα to Hβ Balmer decrement, versus the stellar continuum V-band extinction (AV,s), as derived from the spectral synthesis-fitting with STARLIGHT for all non-AGN galaxies. The straight solid and dashed lines show the relations between AV,g and AV,s found by Calzetti et al. (2000) and Kreckel et al. (2013), respectively. |
| In the text | |
|
Fig. 8 Ratio of internal extinction corrected emission-line fluxes from the OSSY database to those measured in this work, as a function of the latter for the [O ii]λλ3726,3729 (top left), [O iii]λ5007 (top right), Hα (bottom left) and [N ii]λ6583 (bottom right) emission lines. All fluxes have been corrected for Galactic extinction and internal extinction (see Sect. 5 for details). |
| In the text | |
|
Fig. 9 Histograms of the values of the oxygen abundance indicators R23 = ([O iii]+[O ii])/Hβ (left) and N2 = log([N ii]λ6583/Hα) (right) for all non-AGN barred and unbarred galaxies in the sample. The number of objects in each sub-sample and the P-values from the A-D test are shown in each panel. |
| In the text | |
|
Fig. 10 Histograms of the oxygen abundance (top), N/O ratio (middle) and ionisation parameter (U, bottom), as calculated with the Pérez-Montero (2014) method for all non-AGN barred and unbarred galaxies in the sample. The number of objects in each sub-sample and the P-values from the A-D test are shown below the legend. Only non-AGN galaxies are considered. |
| In the text | |
|
Fig. 11 Comparative histograms of star formation rate per unit area for all non-AGN barred (yellow hatched) and unbarred (purple) galaxies of the sample. |
| In the text | |
|
Fig. 12 Comparative histograms of values of the [S ii]λ6717/ [S ii]λ6731 line ratio for barred (yellow hatched) and unbarred (purple) galaxies separately. Only non-AGN galaxies are considered. |
| In the text | |
|
Fig. 13 Comparative histograms of (from top to bottom and from left to right): the Balmer extinction at the Hβ emission line, c(Hβ), N2, log R23, decimal logarithm of the SFR per unit area, [S ii]λ6717/[S ii]λ6731 line ratio, logarithm of the ionisation parameter, N/O abundance ratio and oxygen abundance for barred (yellow, hatched) and unbarred (purple) galaxies separately for early- and late-type galaxies. The separation between early- and late-type galaxies was carried out using the B/D luminosity ratio as described in Sect. 9 for the non-AGN sub-sample of galaxies. |
| In the text | |
|
Fig. 14 Comparative histograms of (from top to bottom and from left to right): the Balmer extinction at the Hβ emission line, c(Hβ), R23, N2, logarithm of the ionisation parameter, logarithm of the SFR per unit area, the [S ii]λ6717/[S ii]λ6731 line ratio, logarithm of the ionisation parameter, N/O abundance ratio, and oxygen abundance for barred (yellow, hatched) and unbarred (purple) galaxies separately for non-AGN galaxies with bulge mass lower than 109.7 M⊙ and for galaxies with heavier bulges (≳109.7 M⊙). |
| In the text | |
|
Fig. 15 Boxplot showing median values of bulge stellar mass for three different bins in total galaxy stellar mass. |
| In the text | |
|
Fig. 16 Boxplots showing the distribution in c(Hβ), N2 = log([N ii]6583/Hα), R23, SFR per unit area and [S ii]λ6717/[S ii]λ6731 line ratio, decimal logarithm of the ionisation parameter, N/O abundance ratio and oxygen abundance, as a function of the total galaxy stellar mass (M⋆) for barred (yellow boxes) and unbarred (purple) galaxies. Each box represents the data distribution for galaxies in a 0.42 dex interval of logarithm in stellar mass centred at the abscissa axis values of the box position. Inside each box, the central horizontal black straight line marks the median value. The lower and upper quartiles are represented by the outer edges of the boxes, i.e. the box length is equal to the inter-quartile range, and therefore the box encloses 50% of the data points. The notches mark the 95% confidence interval for the median value. The whiskers extend to the most extreme data point within 1.5 times the inter-quartile range. Galaxies that do not fall within the reach of the whiskers are considered as outliers (yellow and purple circles for barred and unbarred galaxies, respectively). The number of galaxies in each box, in order or increasing stellar mass, ranges from 35 to 39, 55 to 59, and 13 to 14 for barred galaxies, and from 57 to 64, 58 to 70, and 15 to 21, for unbarred galaxies. |
| In the text | |
|
Fig. 17 Same as Fig. 16 but as a function of the bulge mass. Each box represents the data distribution for galaxies in a 0.85 dex interval of logarithm in bulge stellar mass centred at the abscissas values of the box position. The number of galaxies in each box, in order of increasing stellar bulge mass, ranges from 9 to 10, 66 to 71, and 28 to 32 for barred galaxies, and from 18 to 22, 70 to 81, and 28 to 32, for unbarred galaxies. |
| In the text | |
|
Fig. 18 Comparison of shock- and AGN-sensitive emission-line ratios [N ii]λ6583/Hα and [O i]λ6300/Hα for barred and unbarred galaxies. Galaxies that would be considered as AGN according to the [O iii]/Hβ vs. [O i]/Hα or [O iii]/Hβ vs. [S ii]/Hα diagrams and the Kewley et al. (2006) separation line are marked with blue and green circles, respectively. |
| In the text | |
|
Fig. 19 Histograms showing the distribution of AGN and shock-sensitive emission-line ratios (from left to right: [N ii]λ6583/Hα, [S ii]λλ6717, 6731/Hα, and [O i]λ6300/Hα) for barred and unbarred galaxies separately. All galaxies classified as non-AGN are included (see Sect. 4). The barred/unbarred distributions are only different for [N ii]λ6583/Hα, and therefore the source of the differences in that line ratio must originate from something other than shock ionisation and/or AGN contamination alone. |
| In the text | |
|
Fig. A.1 Logarithm of the B/D flux ratio in the g, r, and i-band versus morphological type (expressed as T-type) for the galaxies of the sample contained in the Nair & Abraham (2010) catalogue. Big crosses and big empty circles mark the median log (B/D) for each T-type value for unbarred and barred galaxies, respectively. The bottom right-hand panel shows the median log (B/D) in each band for each T-type value. Error bars represent the 95% confidence level of the median value for the distribution of B/D values at each T-type value. The blue solid straight line marks B/D = 0.5, that we have used to separate early from late-type galaxies. |
| In the text | |
|
Fig. A.2 Decimal logarithm of the bulge-to-disc flux ratio in the i-band as a function of the morphological T-type, as given in the Nair & Abraham (2010) catalogue for the galaxies of our sample included in this catalogue. The colours represent different values of the predicted T-type Galaxy Zoo 2 parameter Willett et al. (2013). |
| In the text | |
Current usage metrics show cumulative count of Article Views (full-text article views including HTML views, PDF and ePub downloads, according to the available data) and Abstracts Views on Vision4Press platform.
Data correspond to usage on the plateform after 2015. The current usage metrics is available 48-96 hours after online publication and is updated daily on week days.
Initial download of the metrics may take a while.