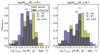
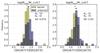
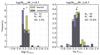
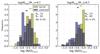
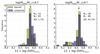
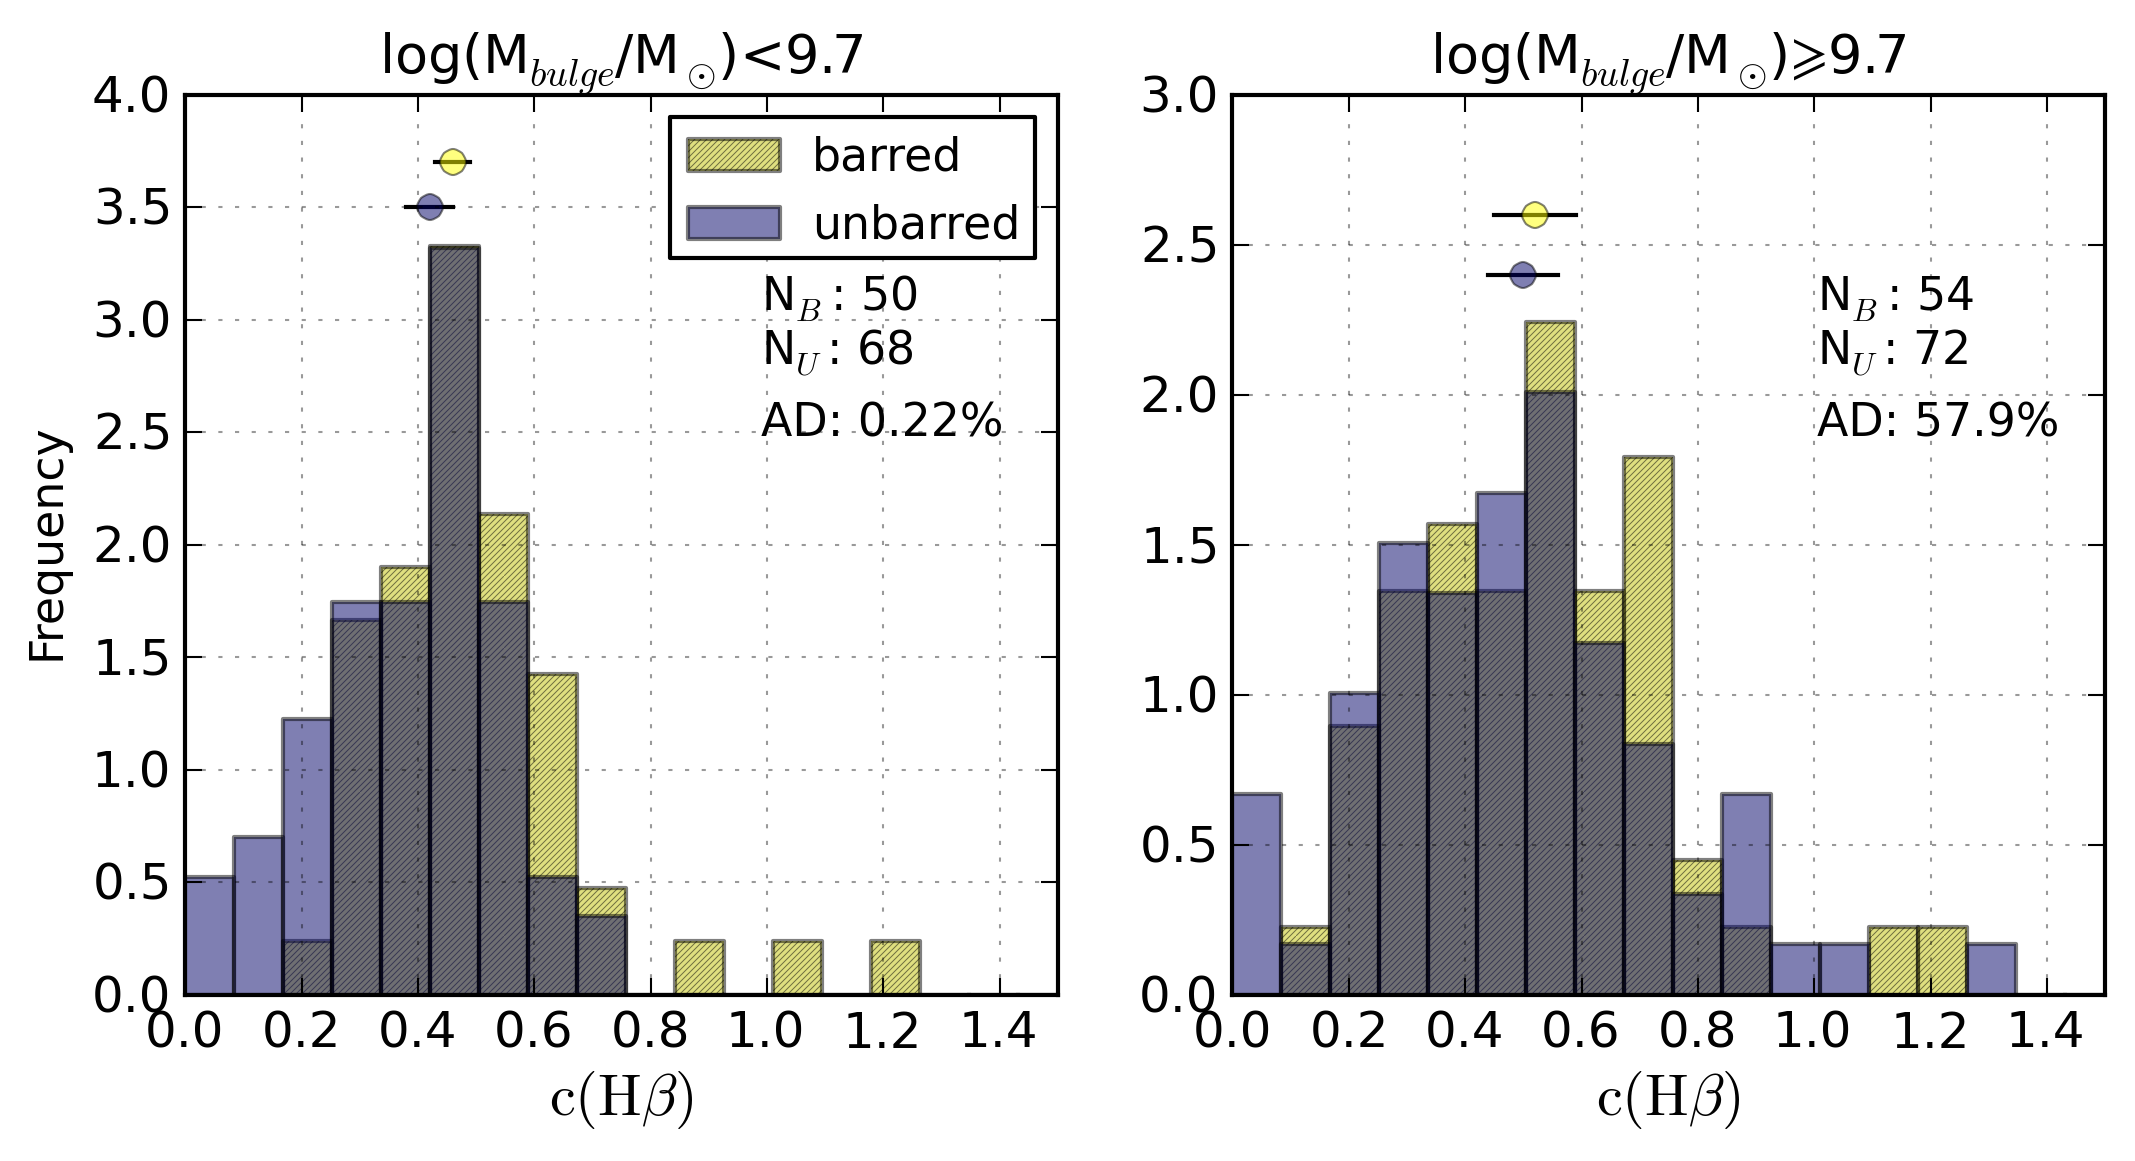
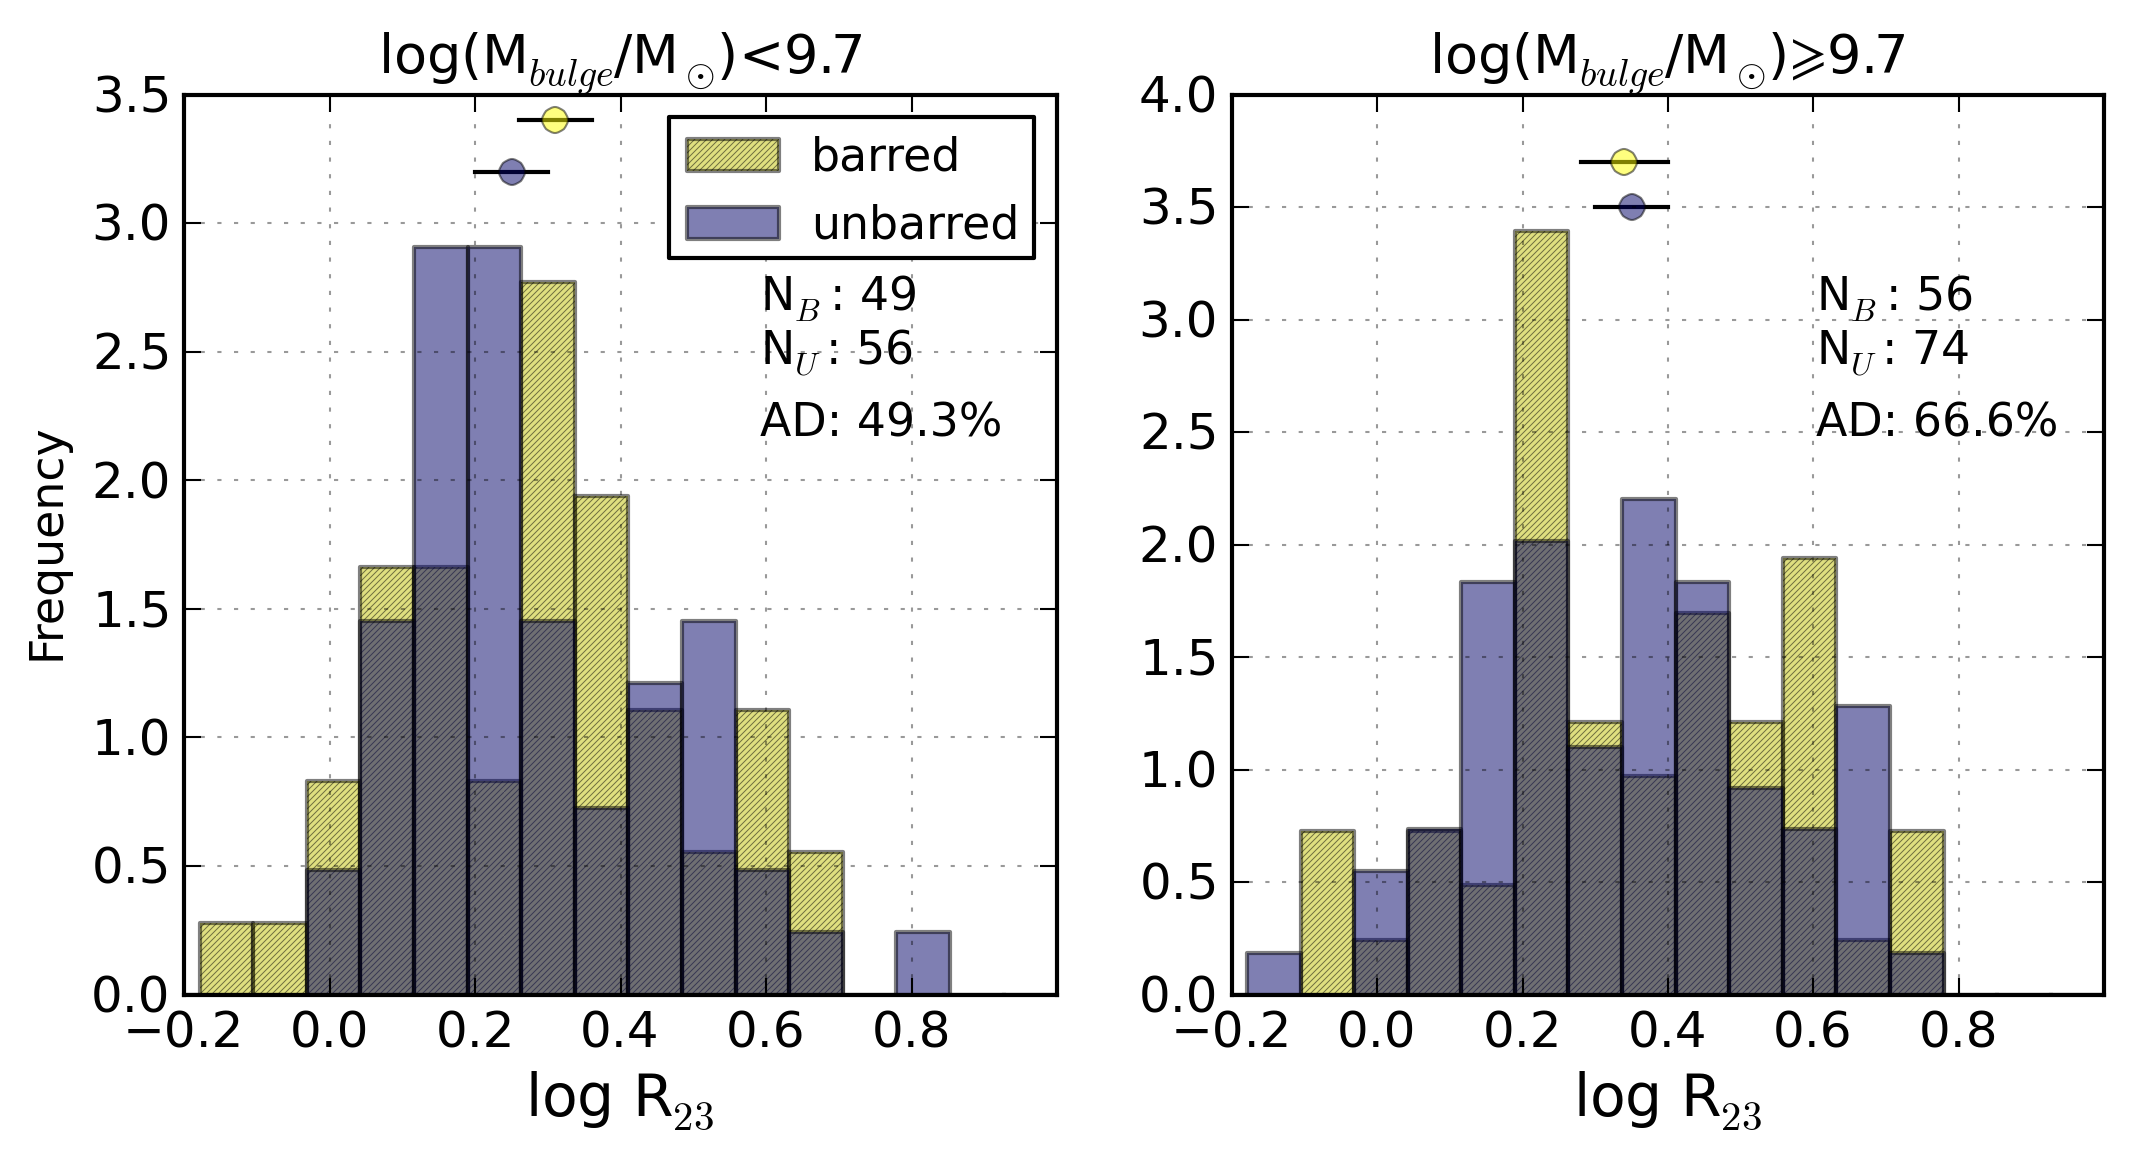
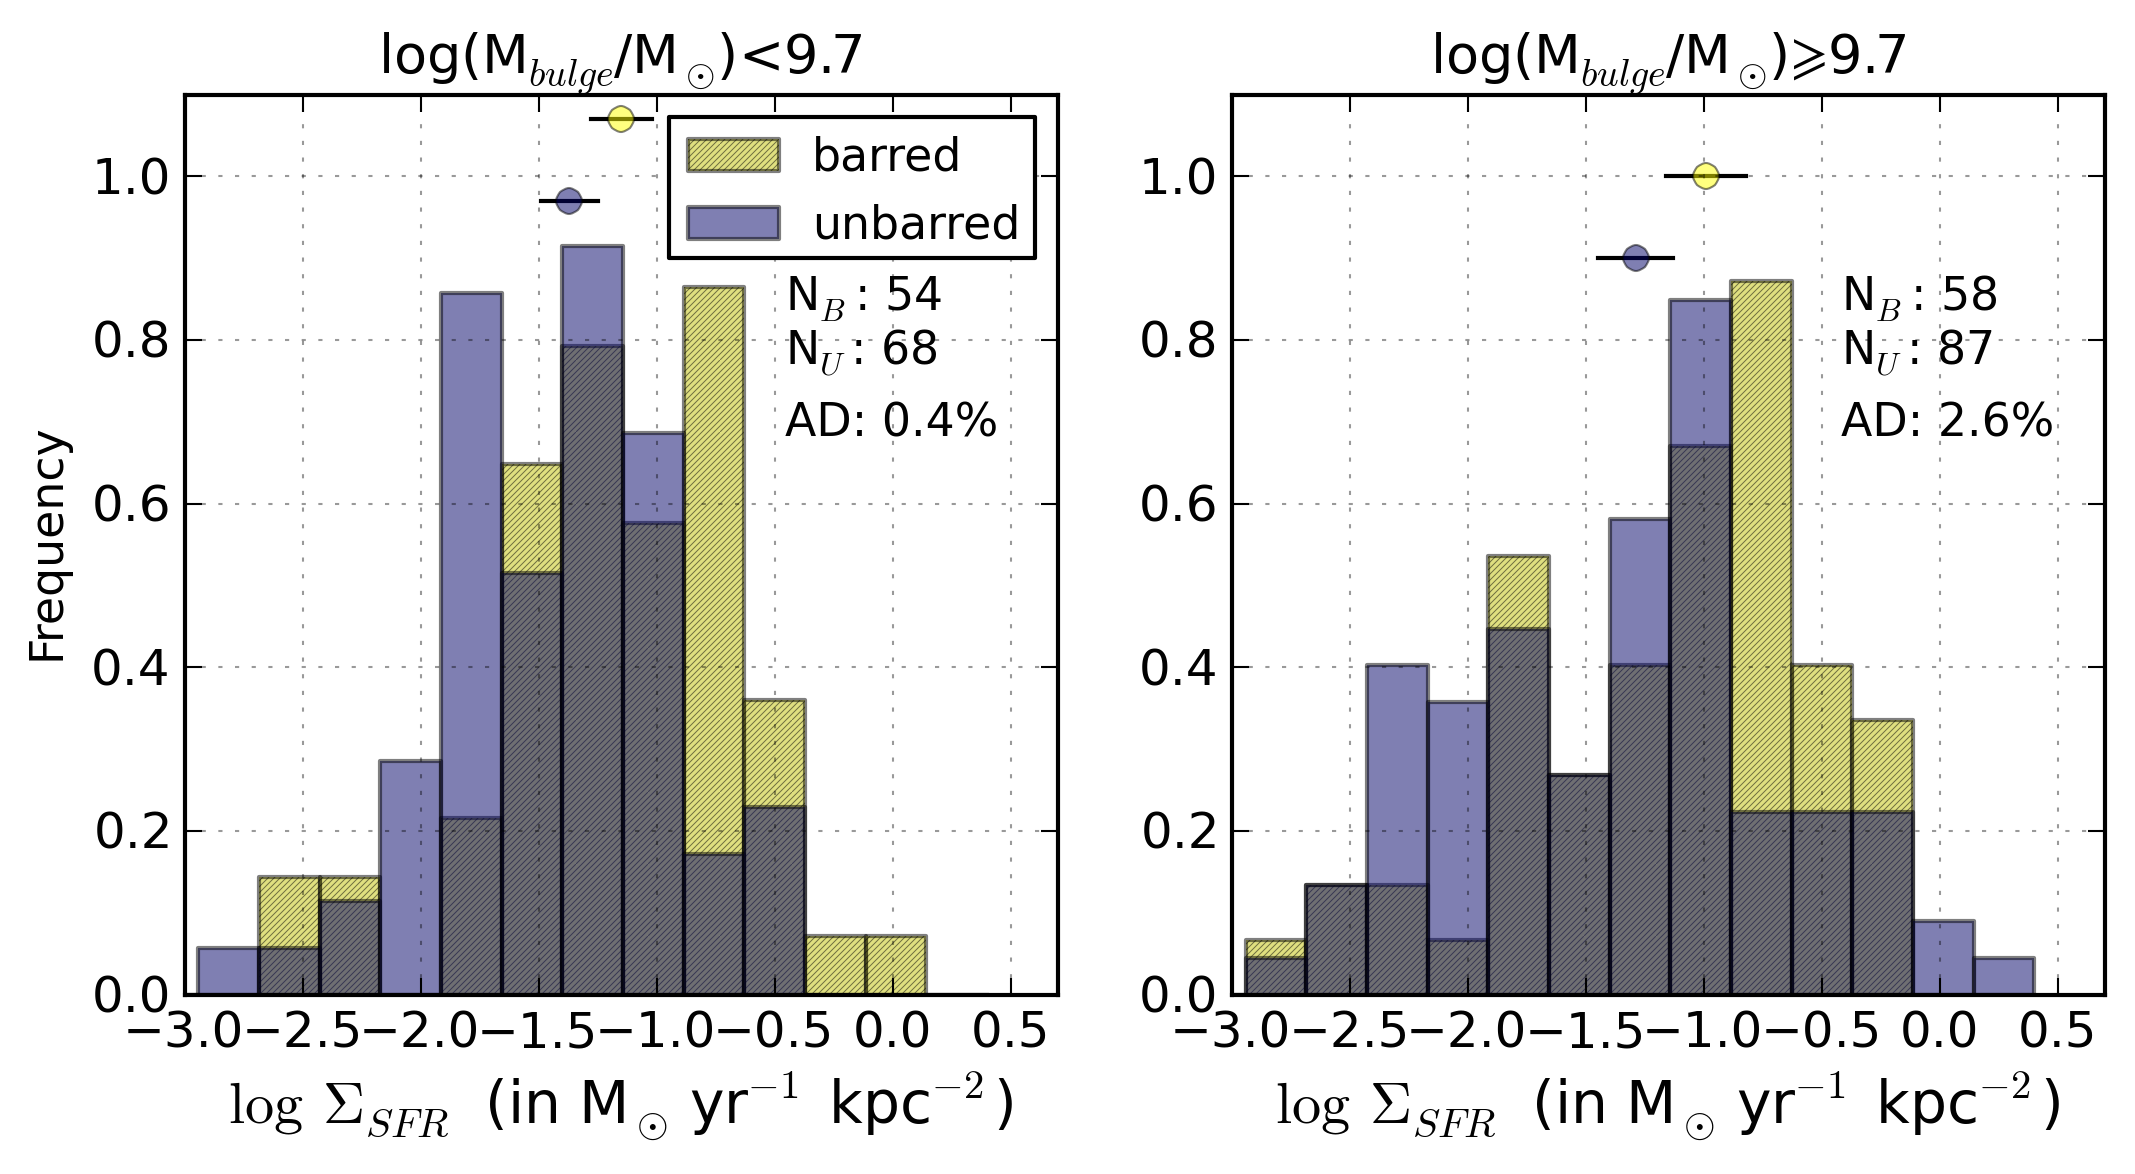
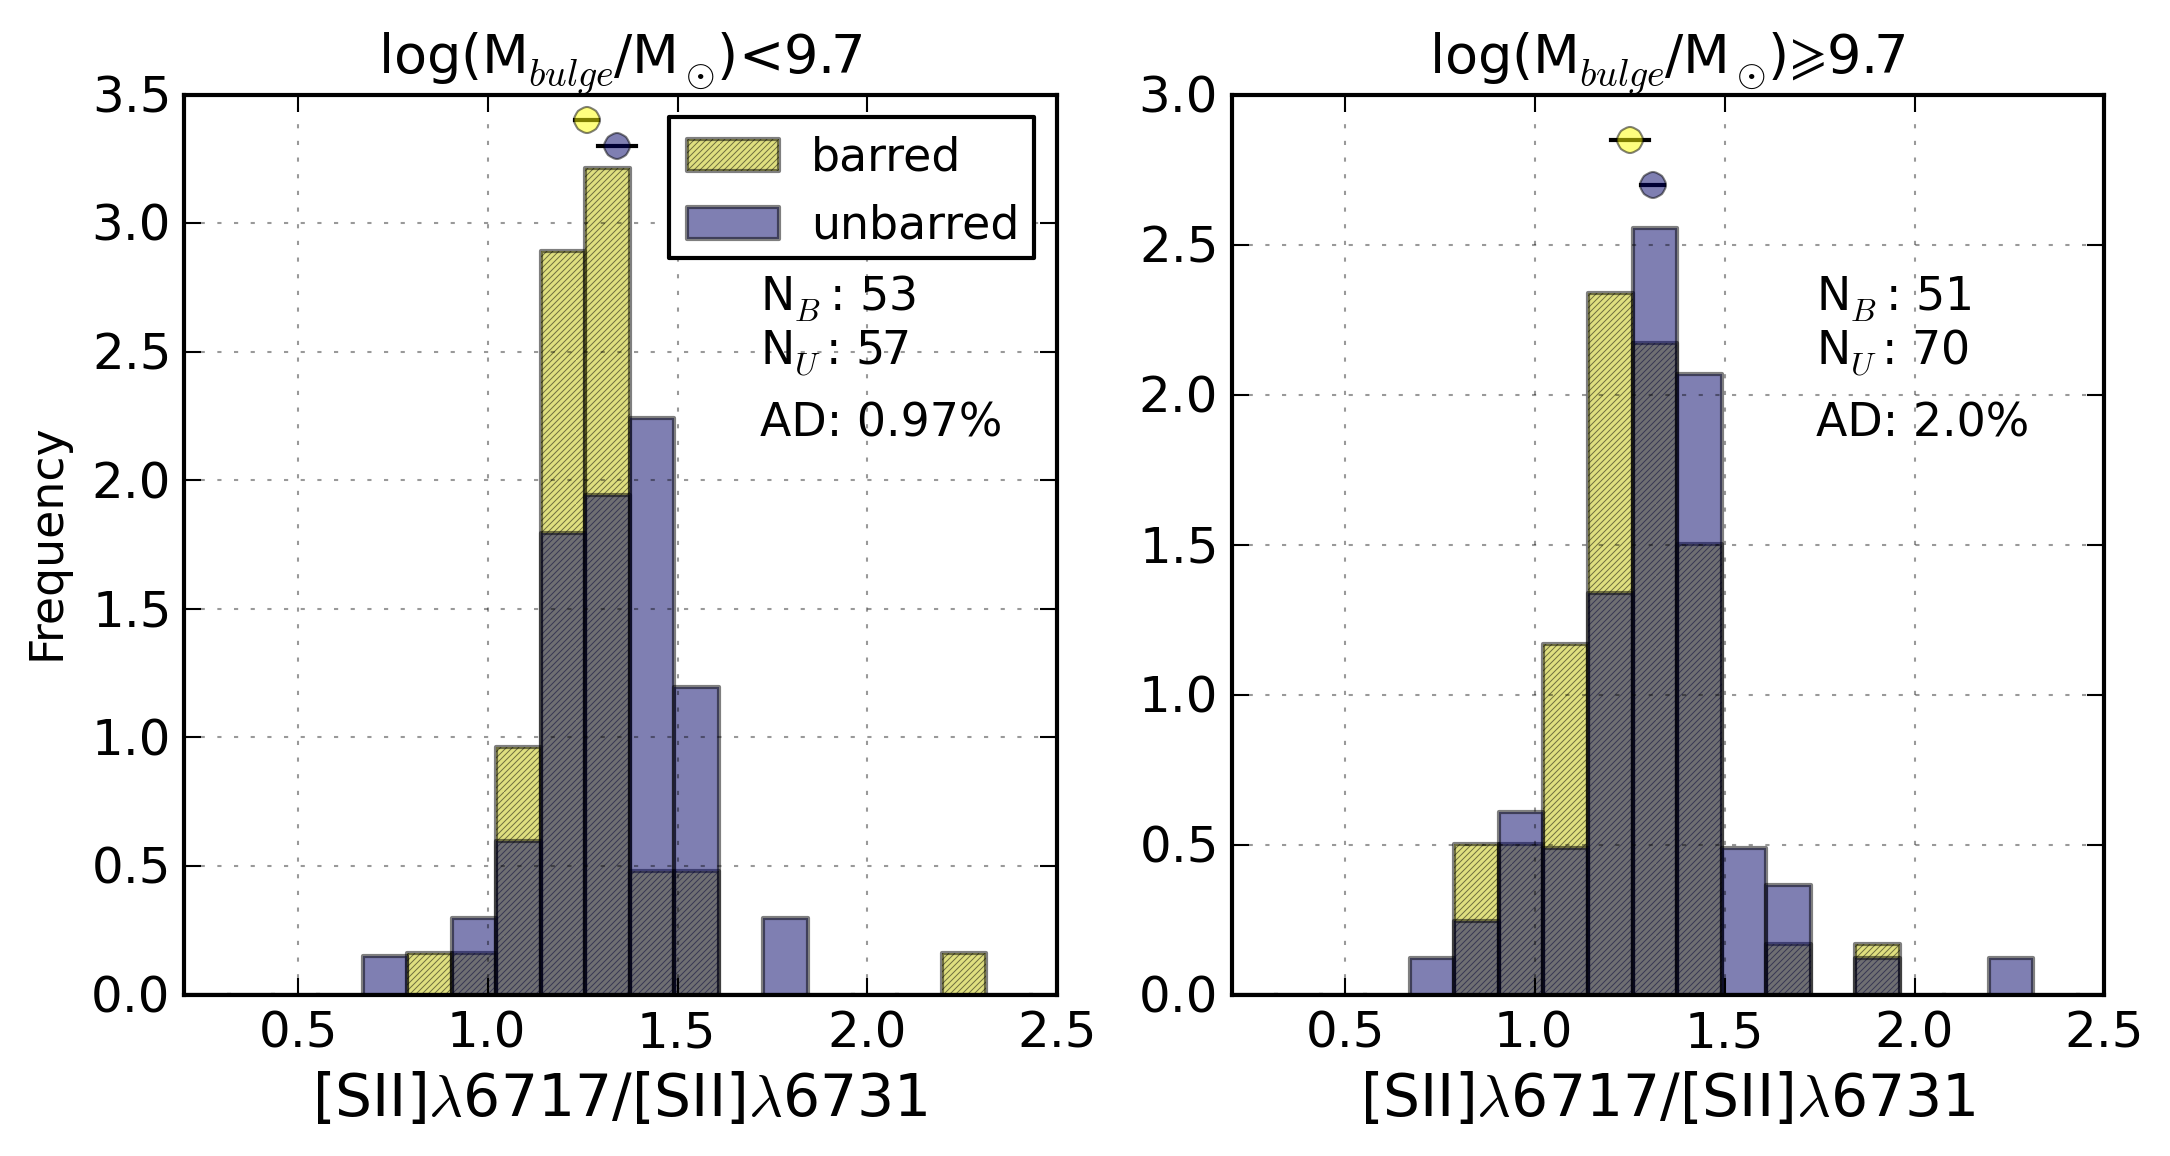
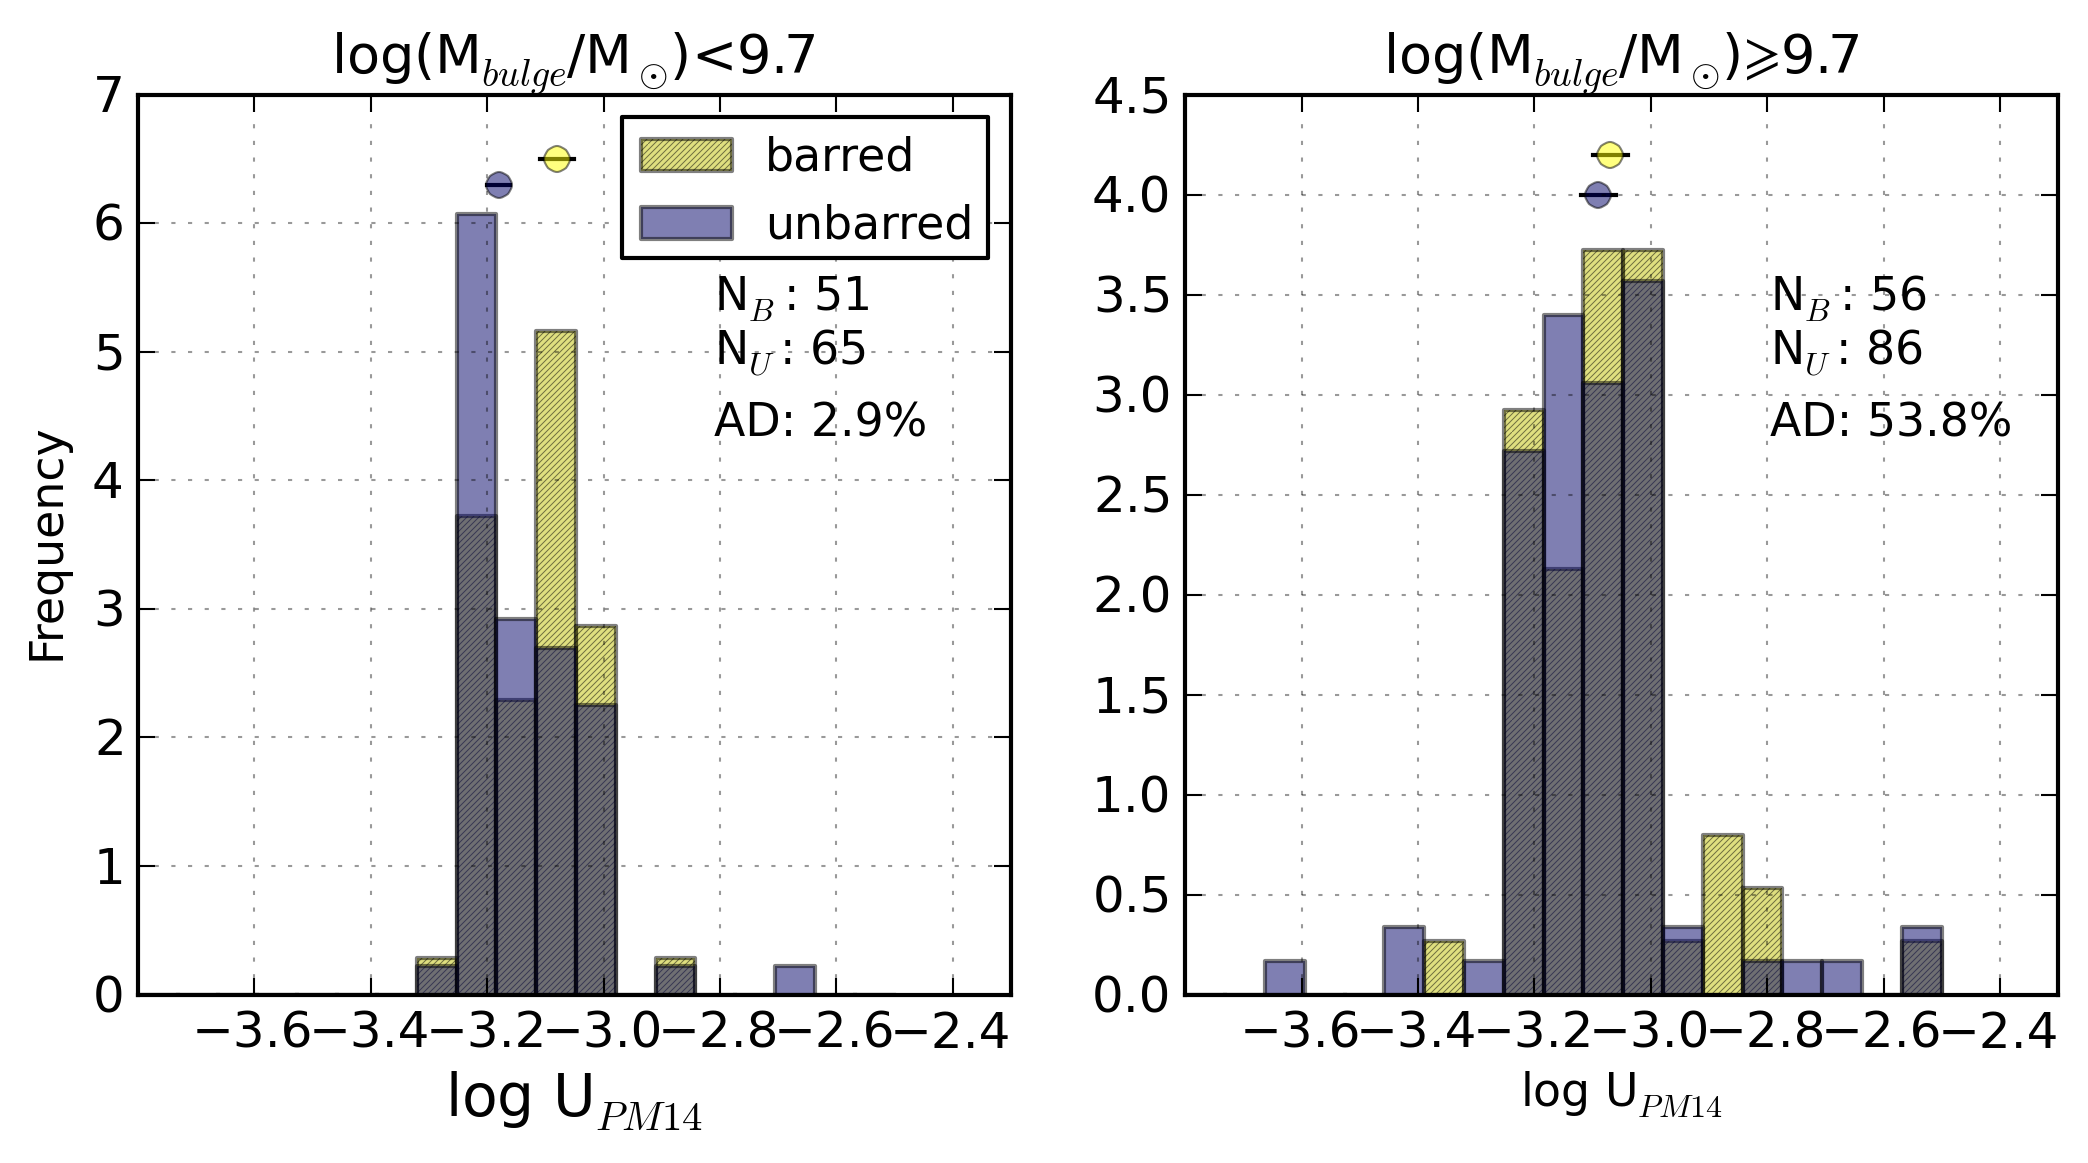
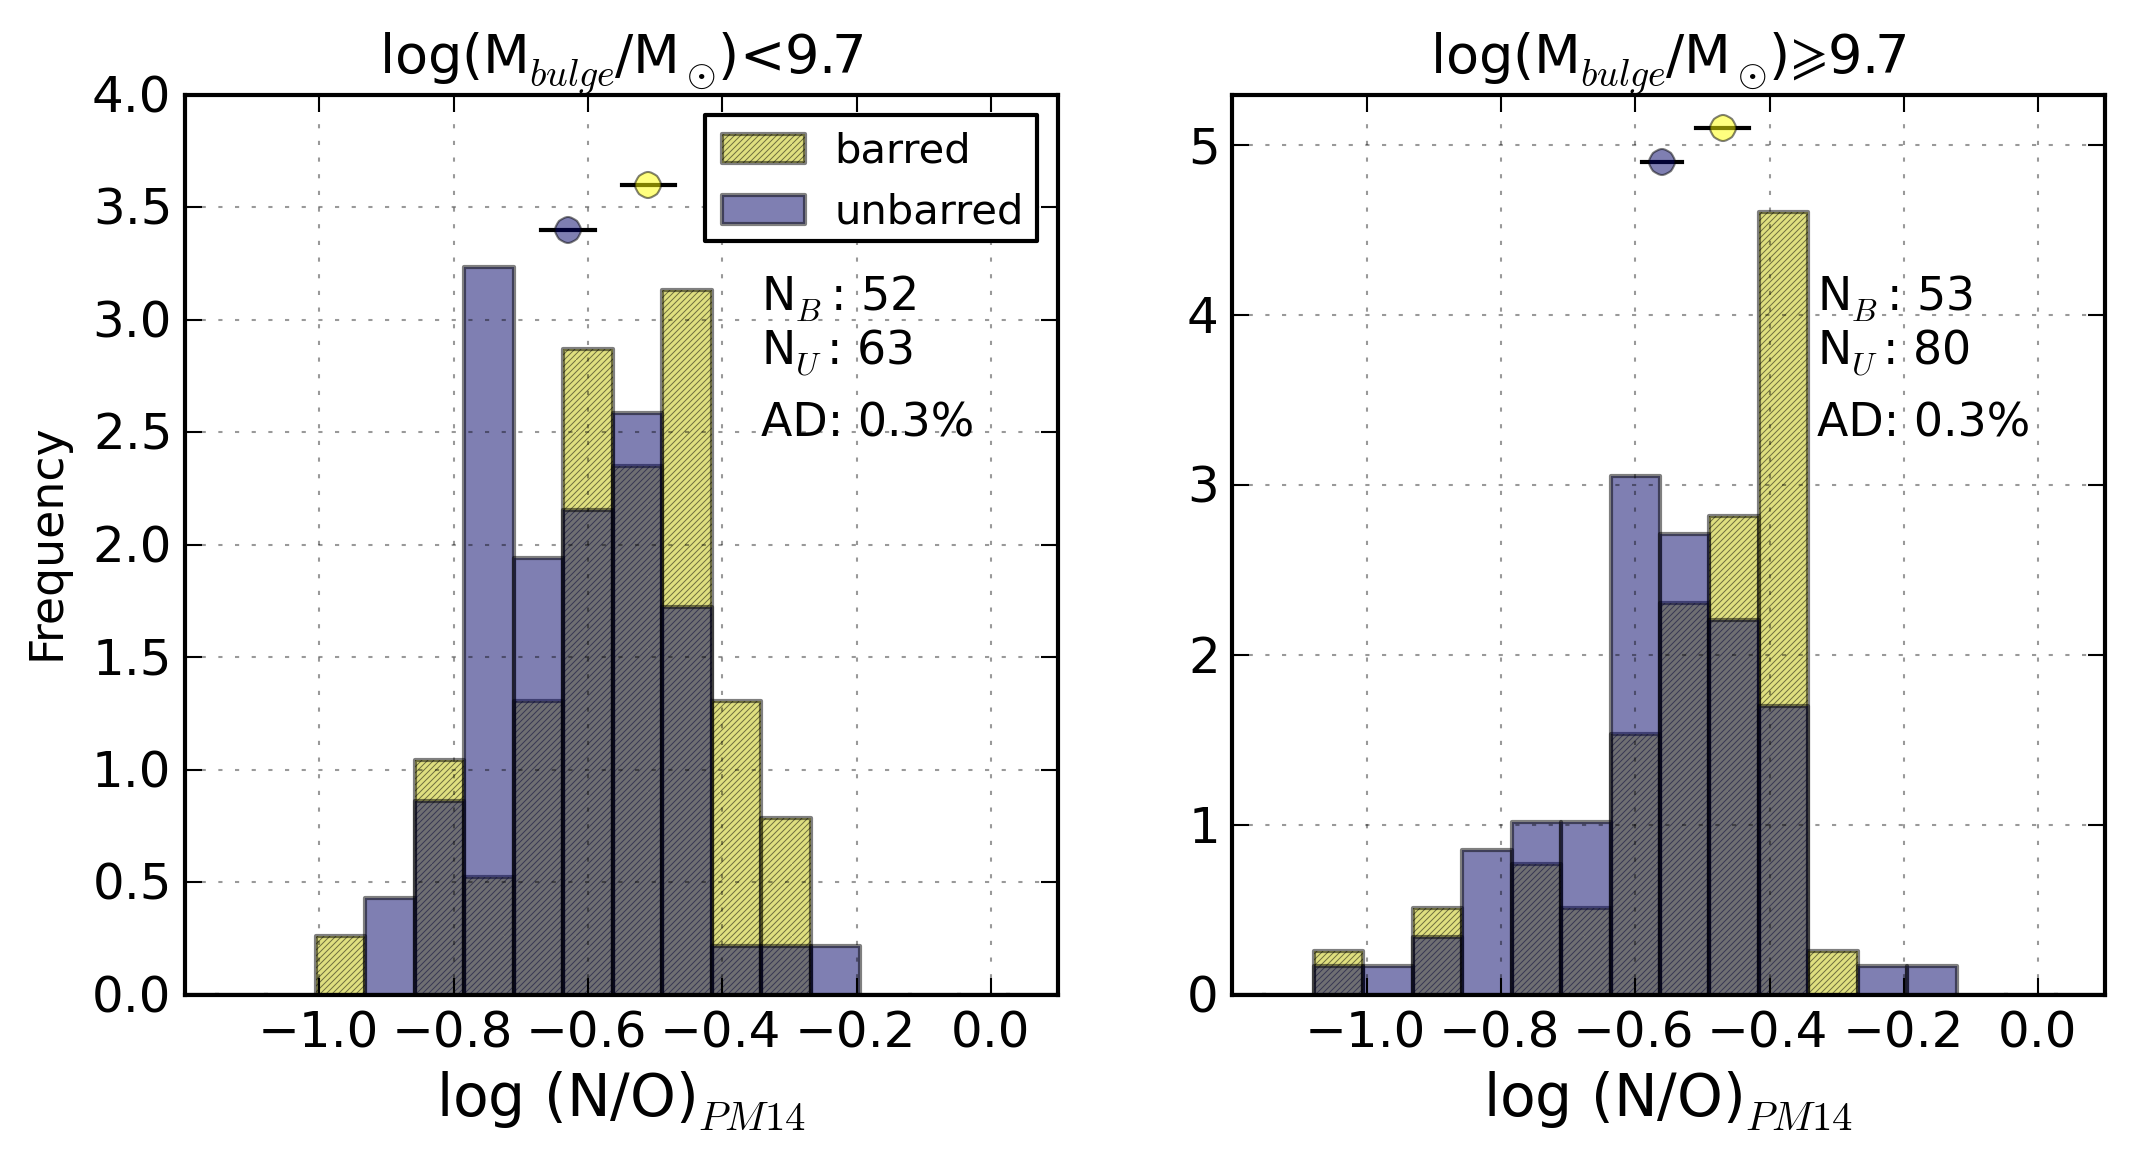
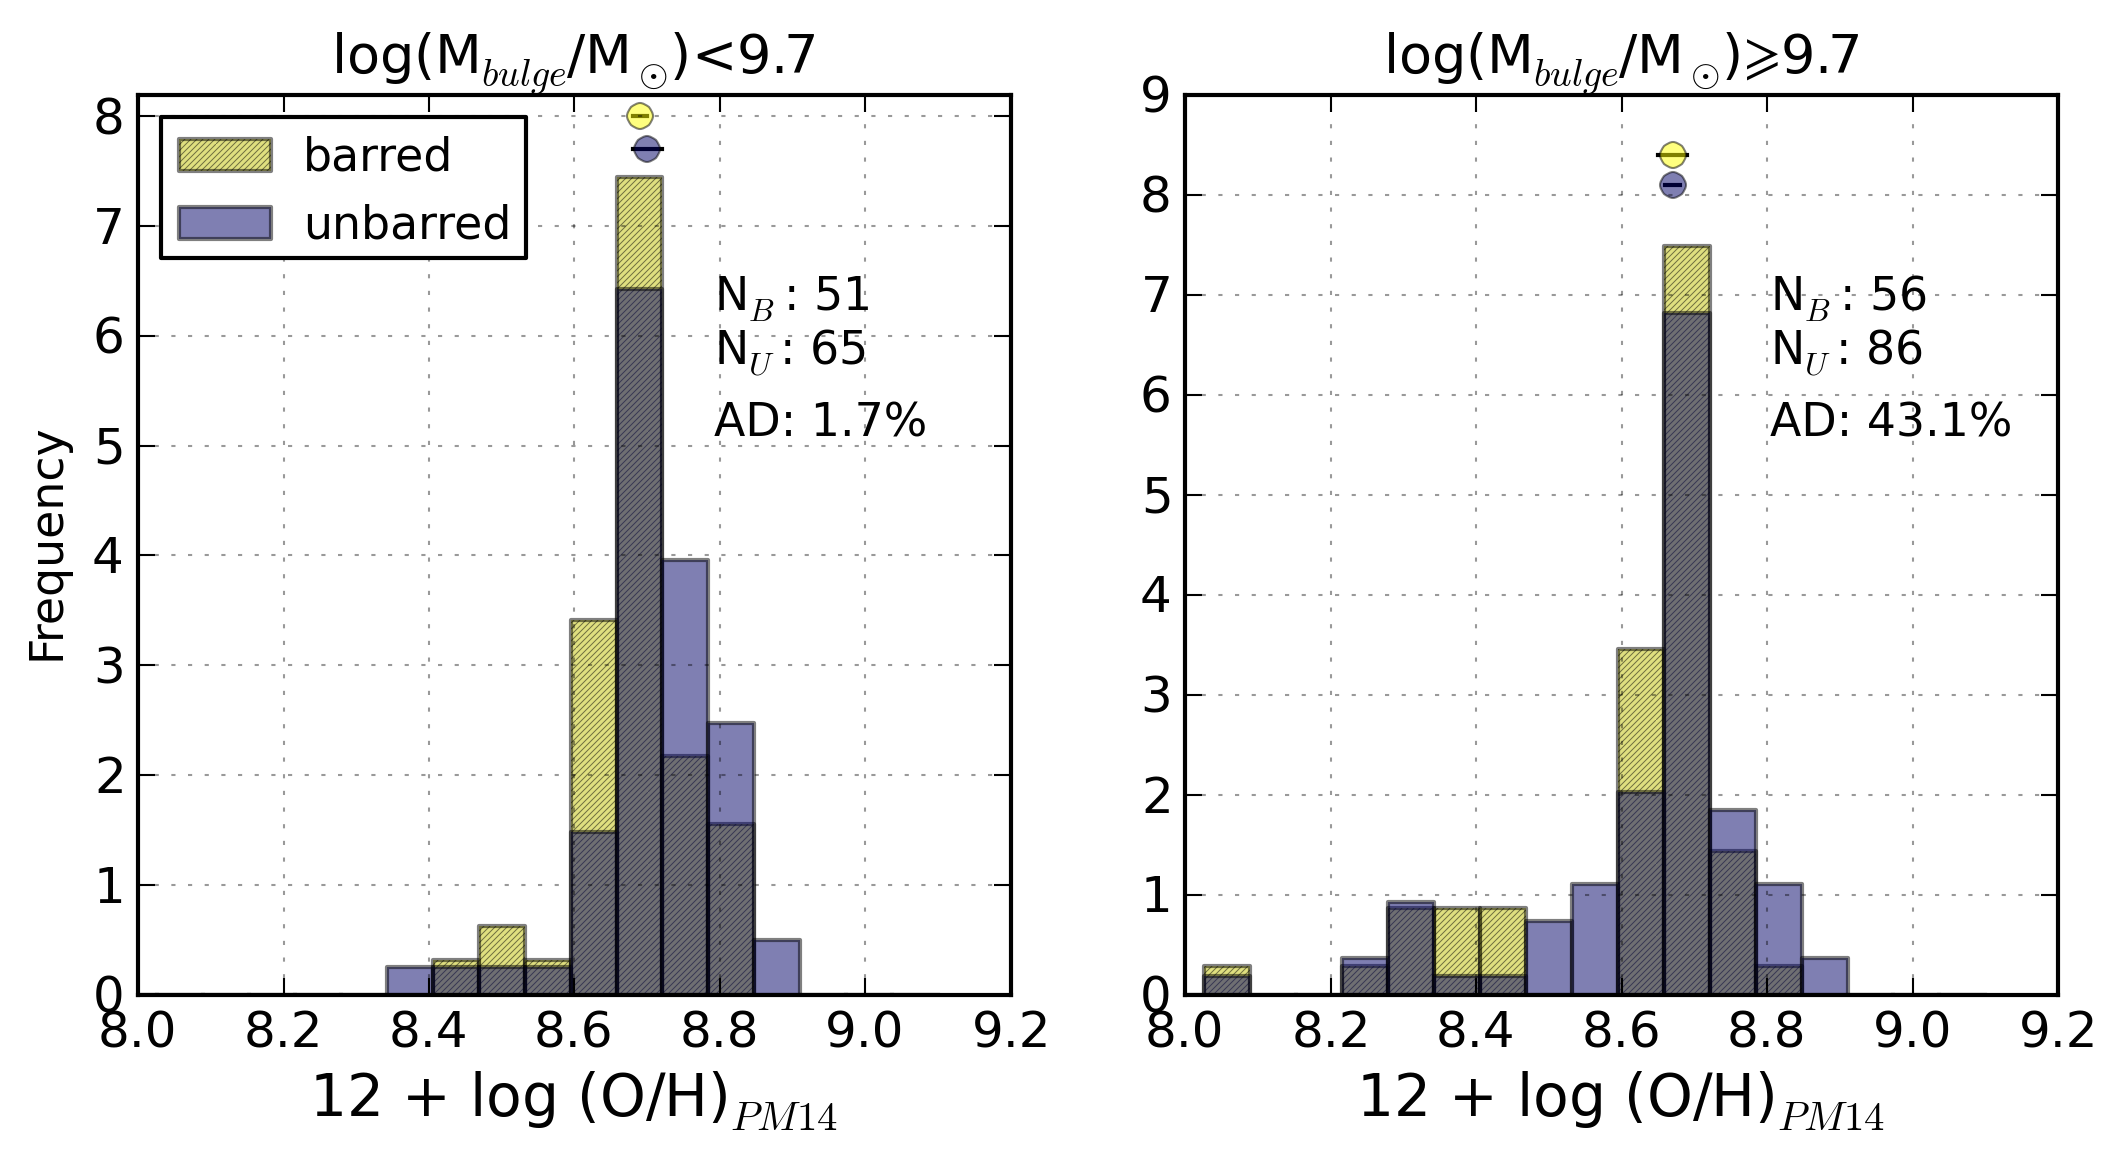
Fig. 14
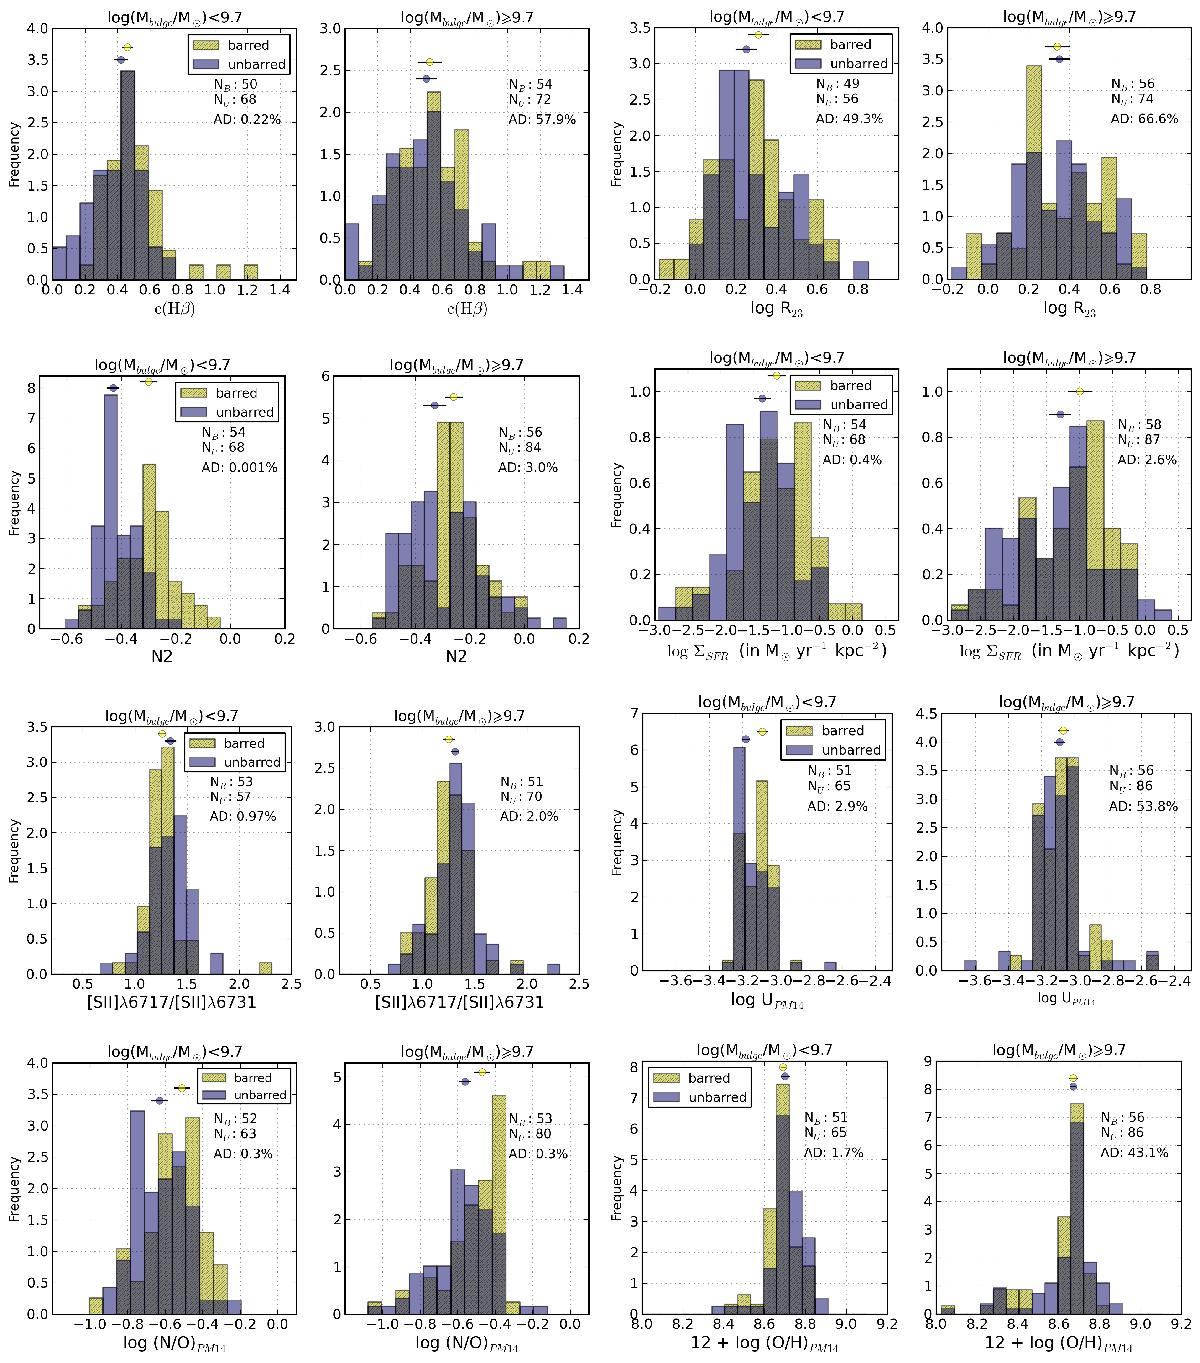
Comparative histograms of (from top to bottom and from left to right): the Balmer extinction at the Hβ emission line, c(Hβ), R23, N2, logarithm of the ionisation parameter, logarithm of the SFR per unit area, the [S ii]λ6717/[S ii]λ6731 line ratio, logarithm of the ionisation parameter, N/O abundance ratio, and oxygen abundance for barred (yellow, hatched) and unbarred (purple) galaxies separately for non-AGN galaxies with bulge mass lower than 109.7 M⊙ and for galaxies with heavier bulges (≳109.7 M⊙).
Current usage metrics show cumulative count of Article Views (full-text article views including HTML views, PDF and ePub downloads, according to the available data) and Abstracts Views on Vision4Press platform.
Data correspond to usage on the plateform after 2015. The current usage metrics is available 48-96 hours after online publication and is updated daily on week days.
Initial download of the metrics may take a while.