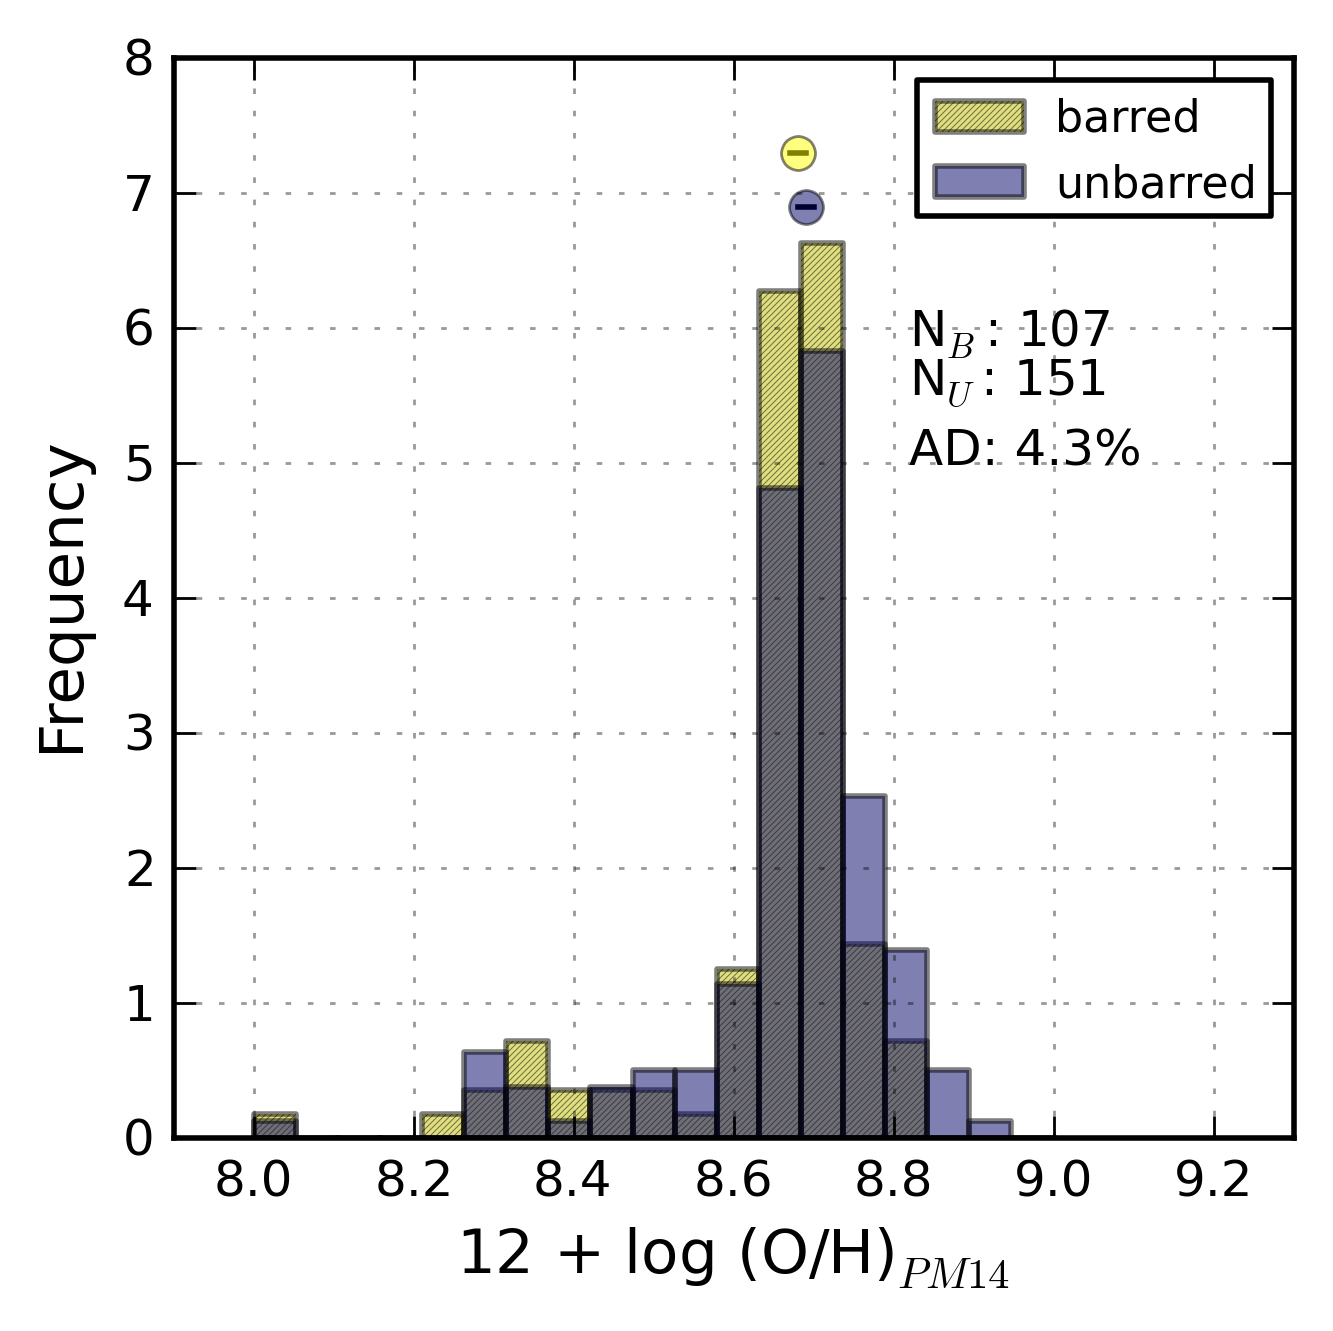
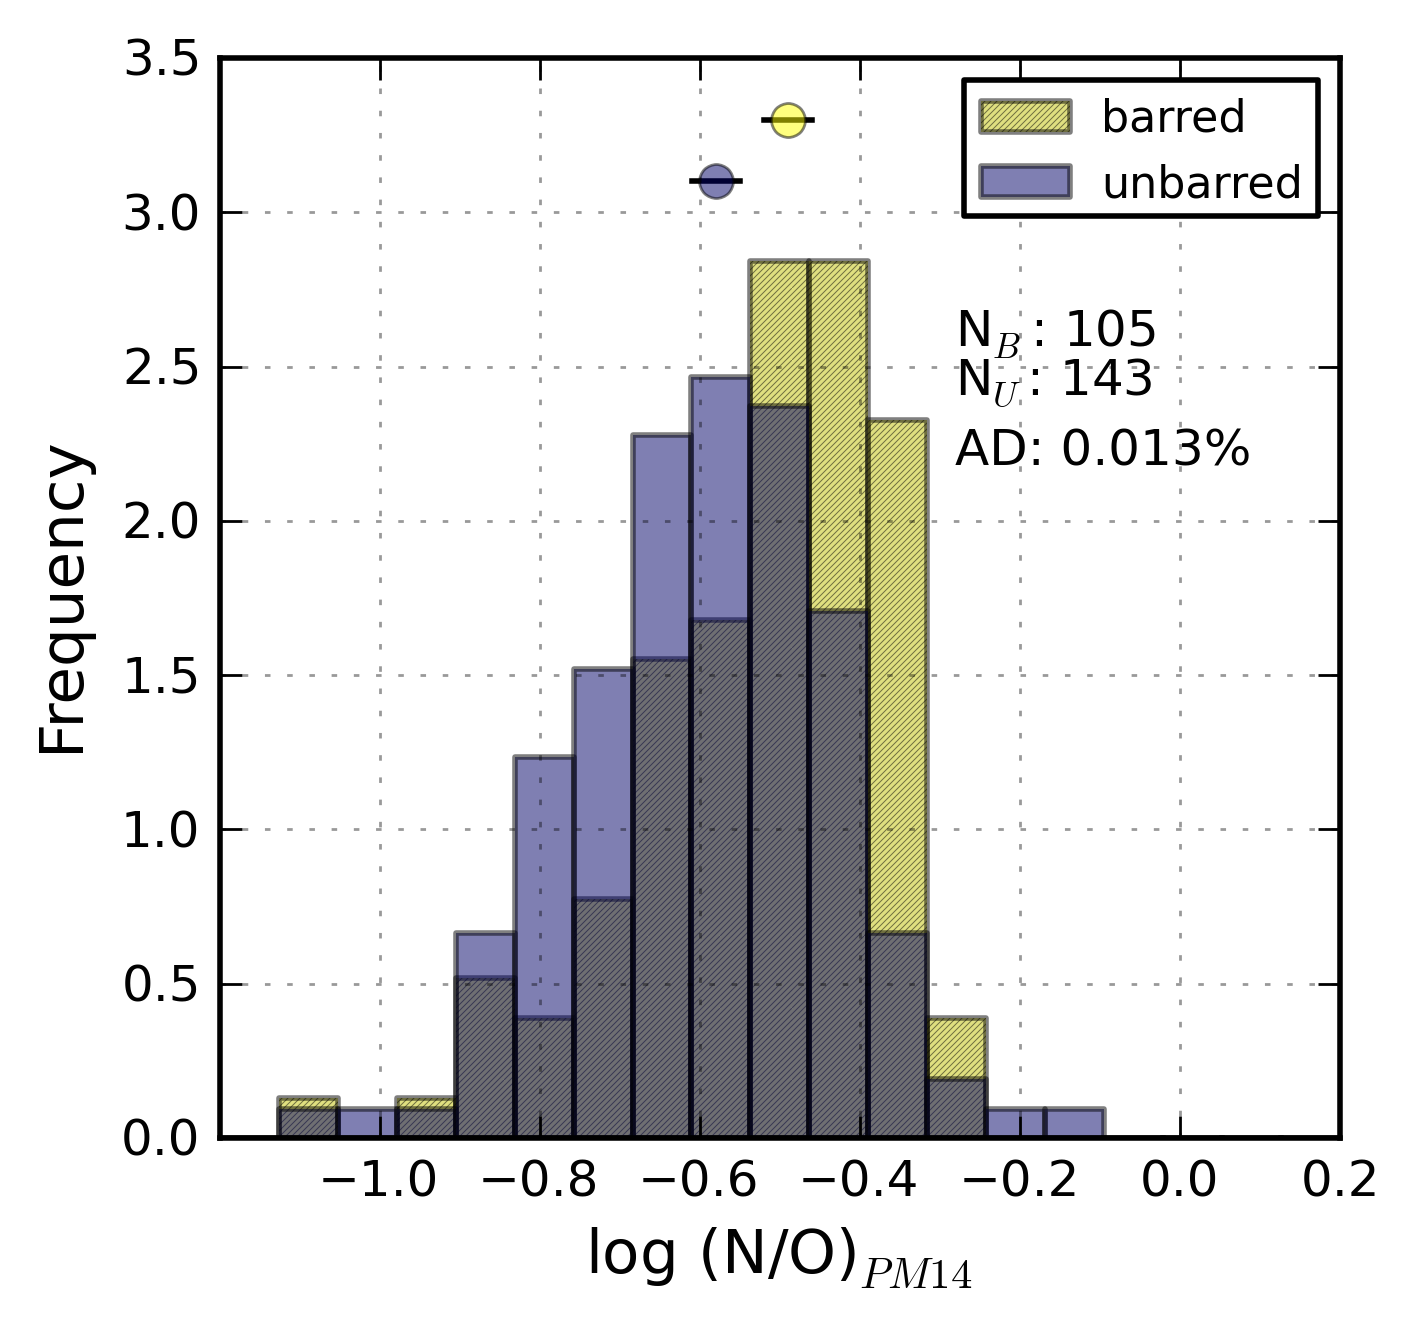
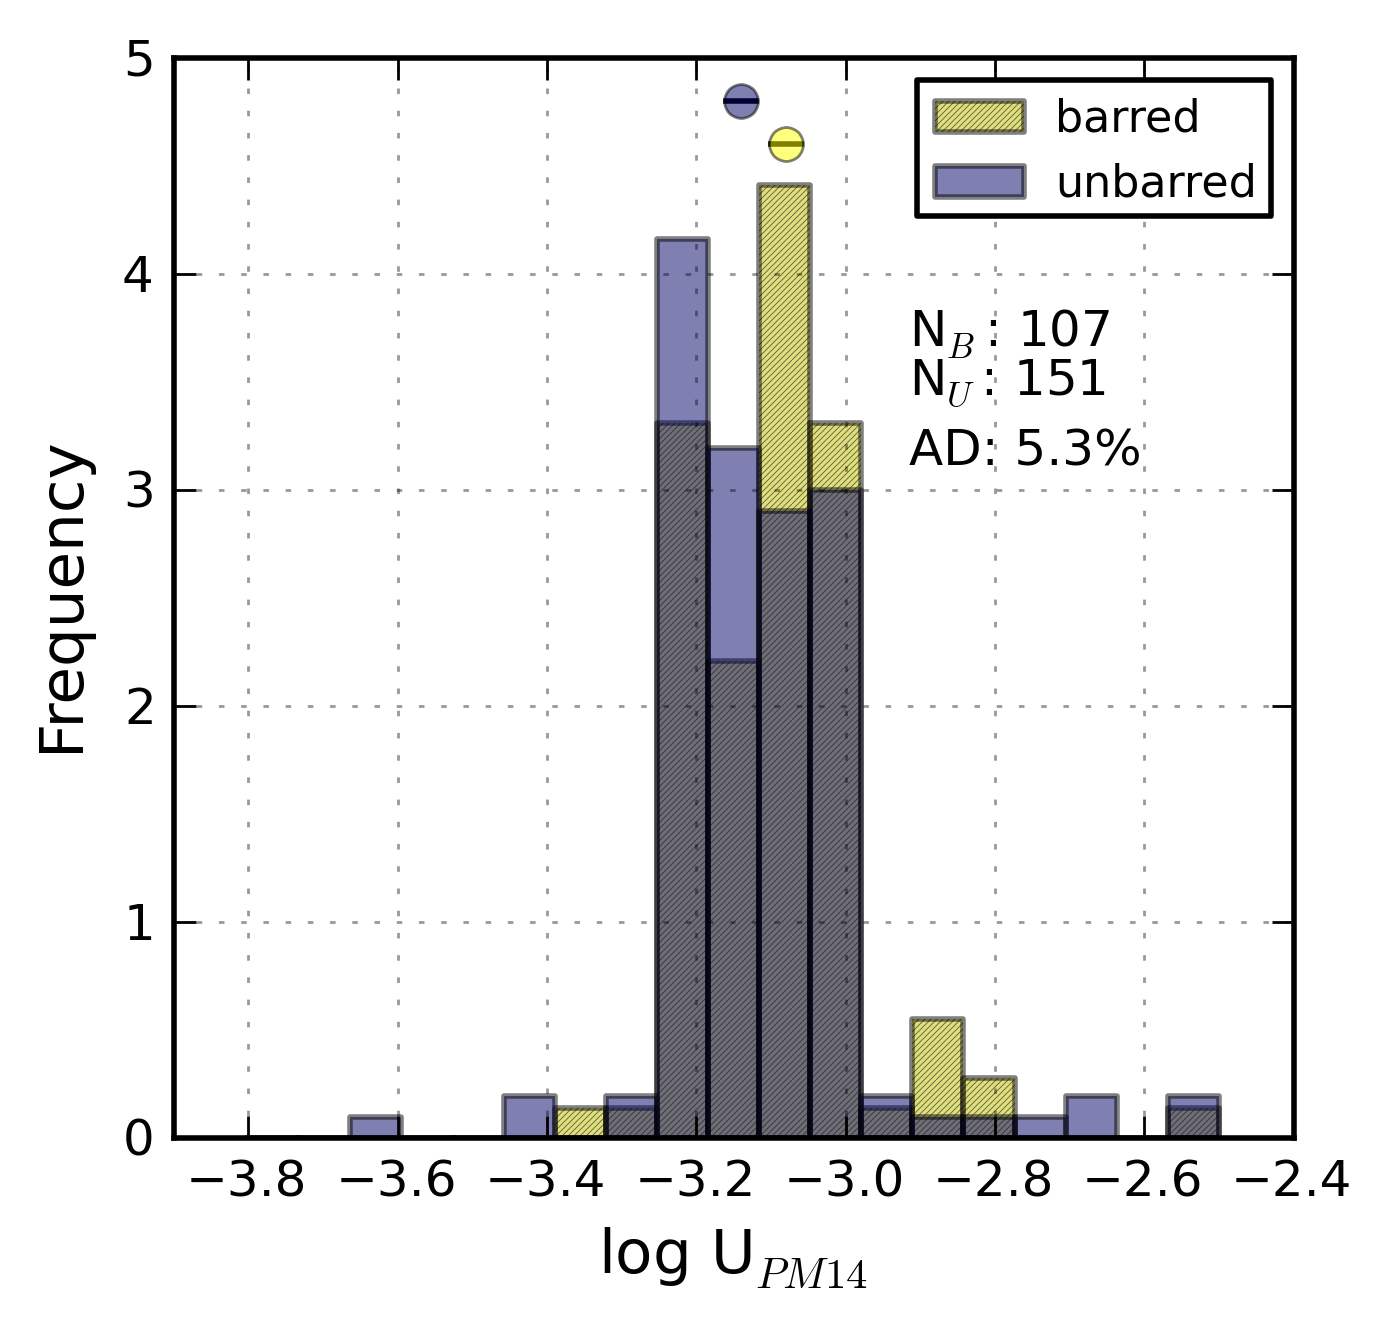
Fig. 10
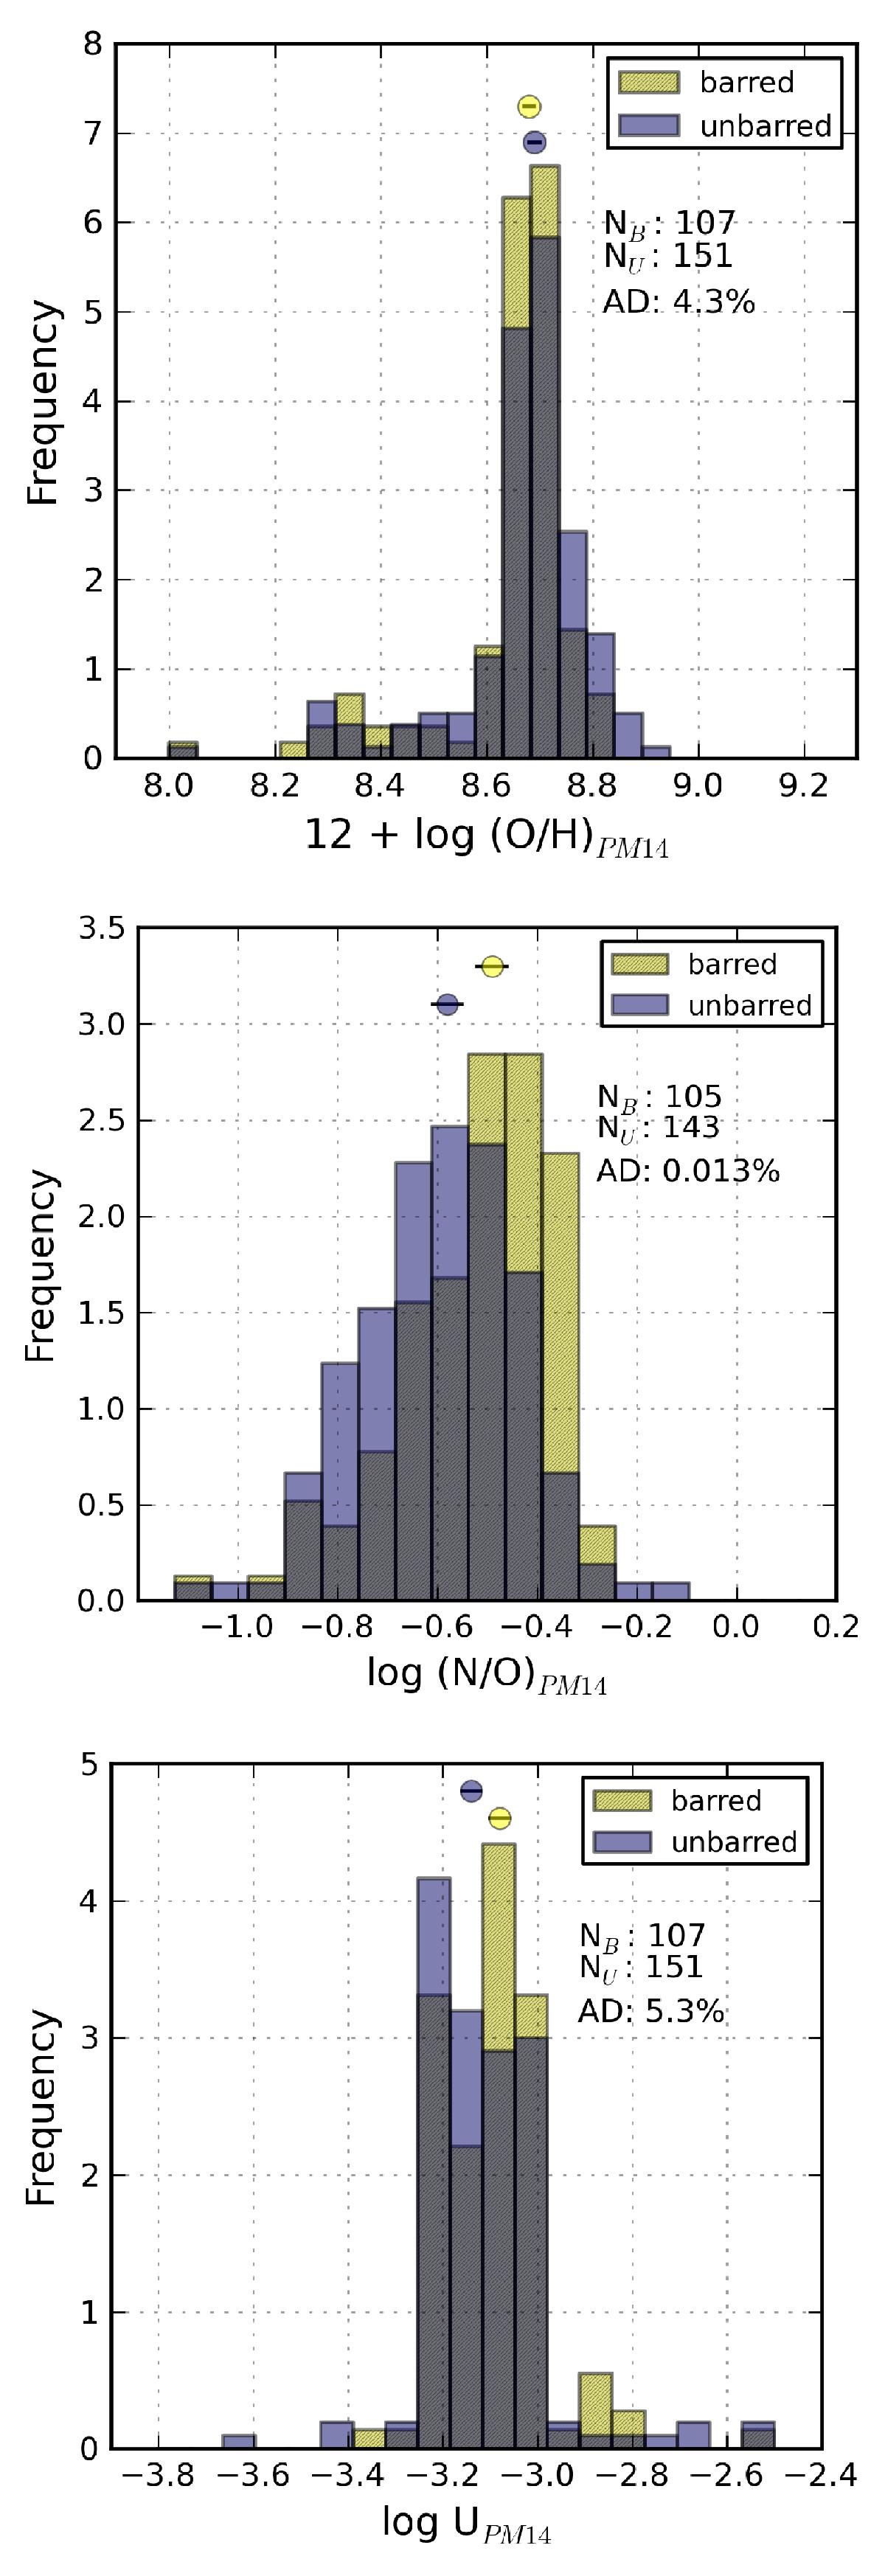
Histograms of the oxygen abundance (top), N/O ratio (middle) and ionisation parameter (U, bottom), as calculated with the Pérez-Montero (2014) method for all non-AGN barred and unbarred galaxies in the sample. The number of objects in each sub-sample and the P-values from the A-D test are shown below the legend. Only non-AGN galaxies are considered.

Current usage metrics show cumulative count of Article Views (full-text article views including HTML views, PDF and ePub downloads, according to the available data) and Abstracts Views on Vision4Press platform.
Data correspond to usage on the plateform after 2015. The current usage metrics is available 48-96 hours after online publication and is updated daily on week days.
Initial download of the metrics may take a while.