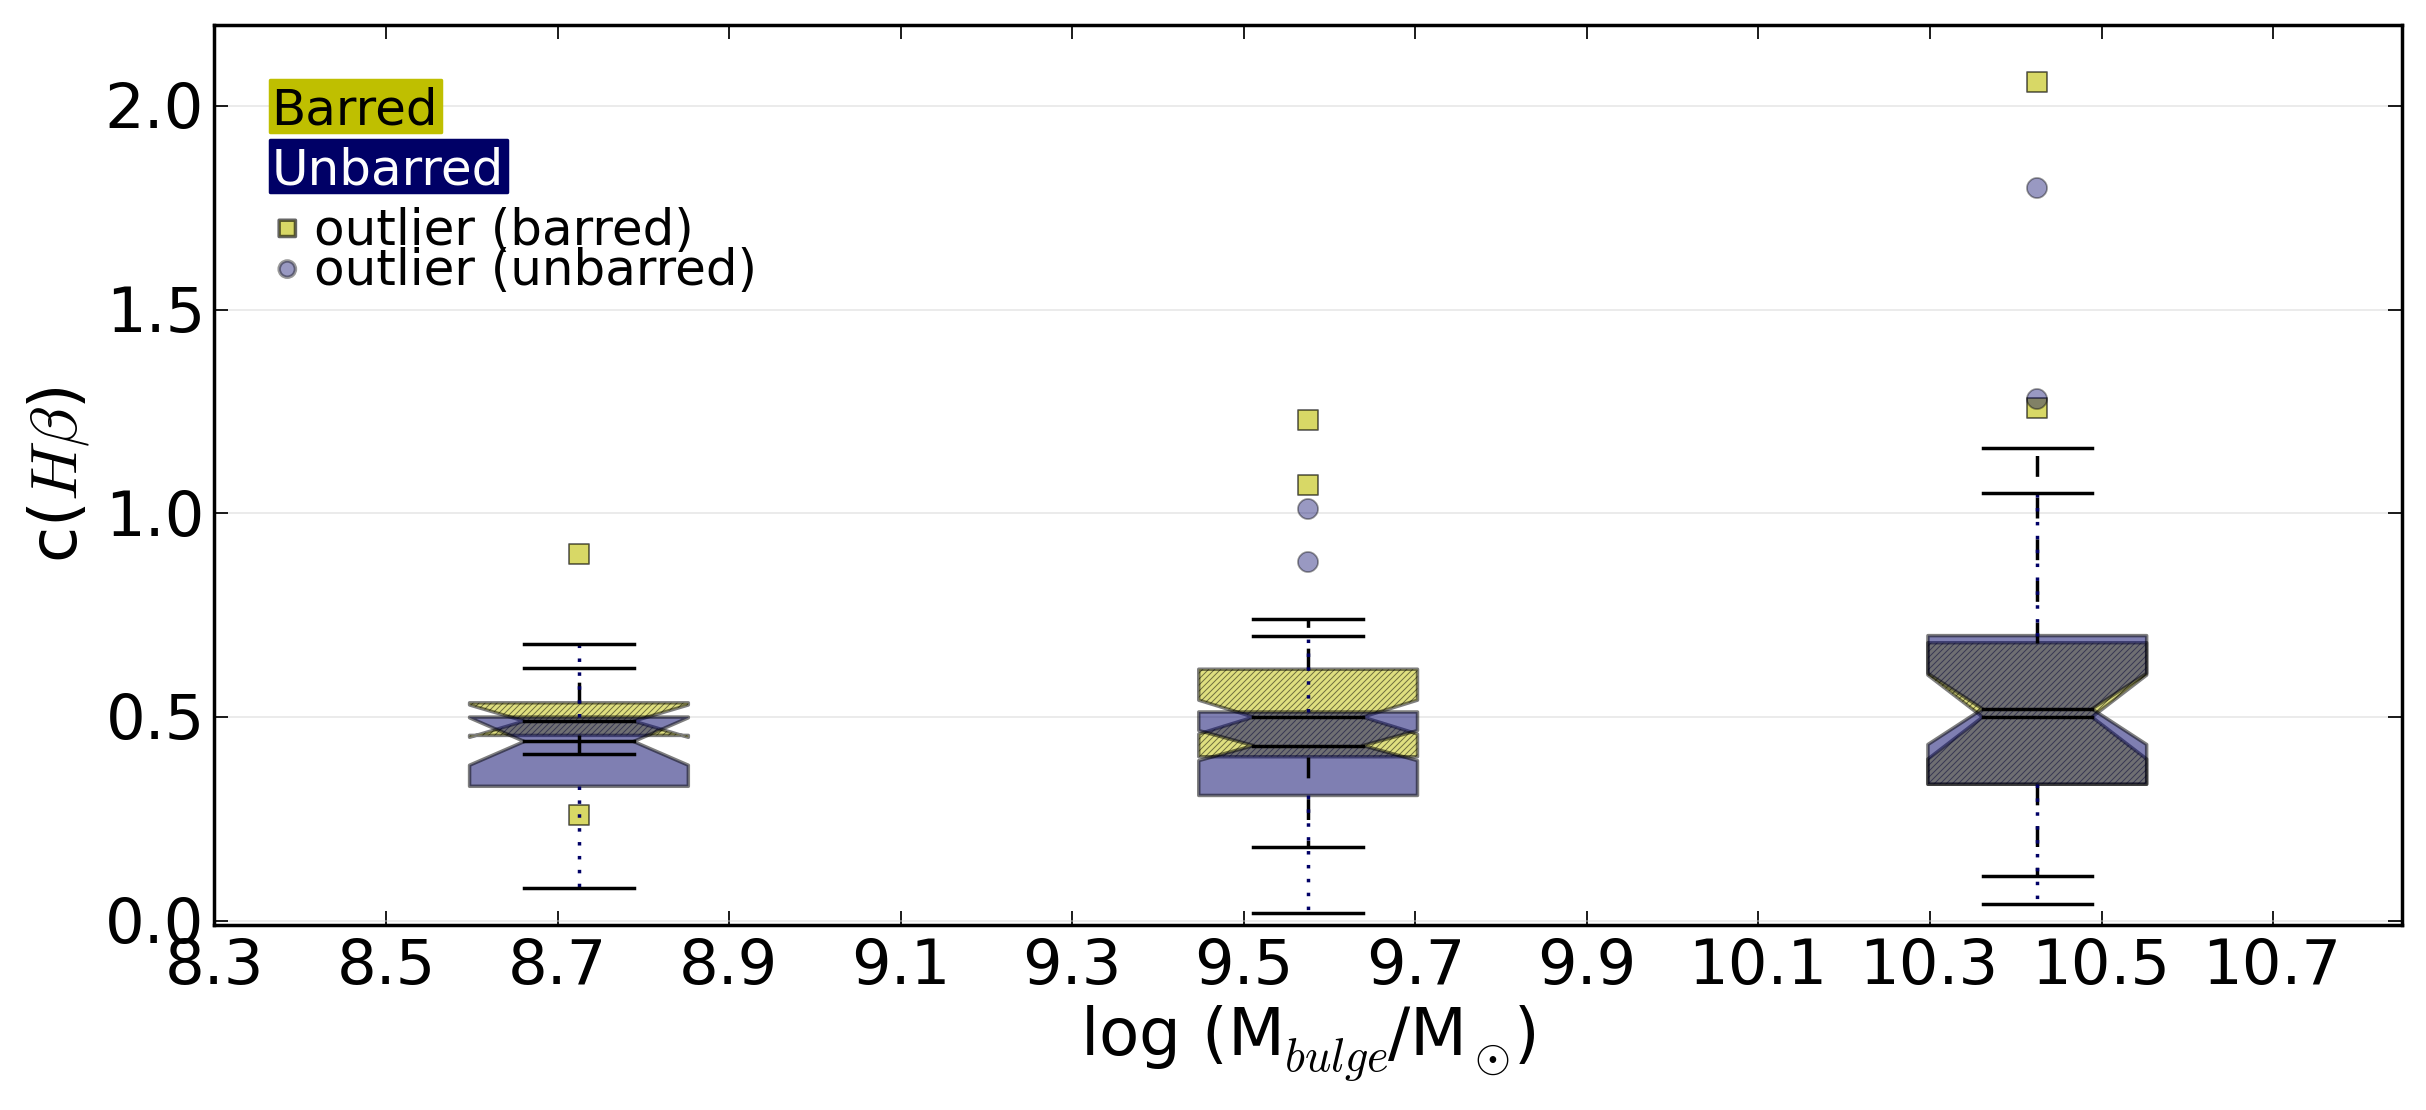
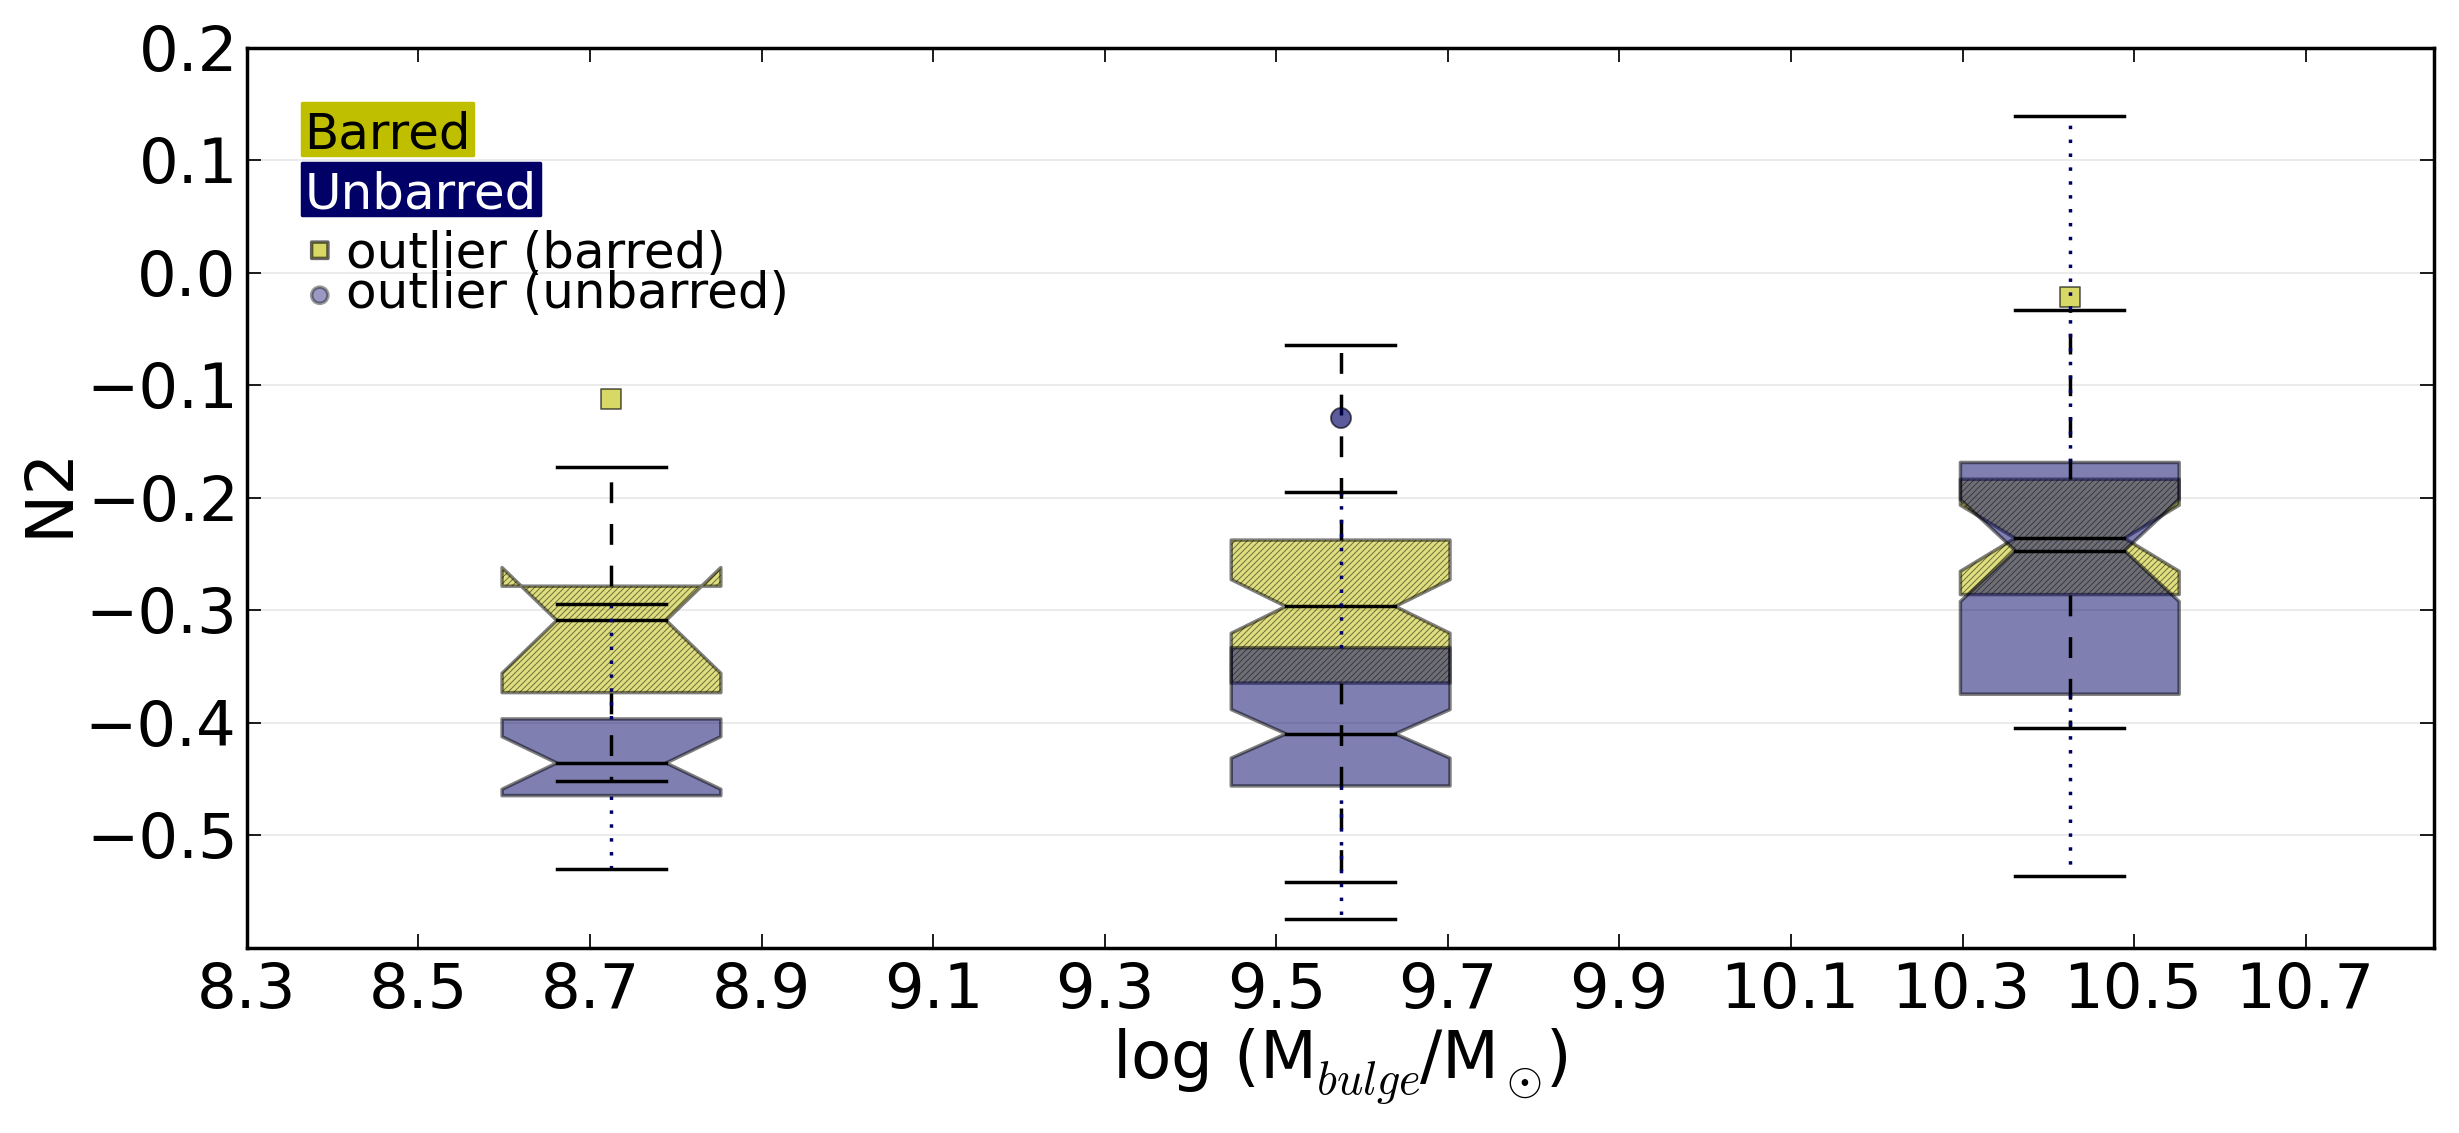
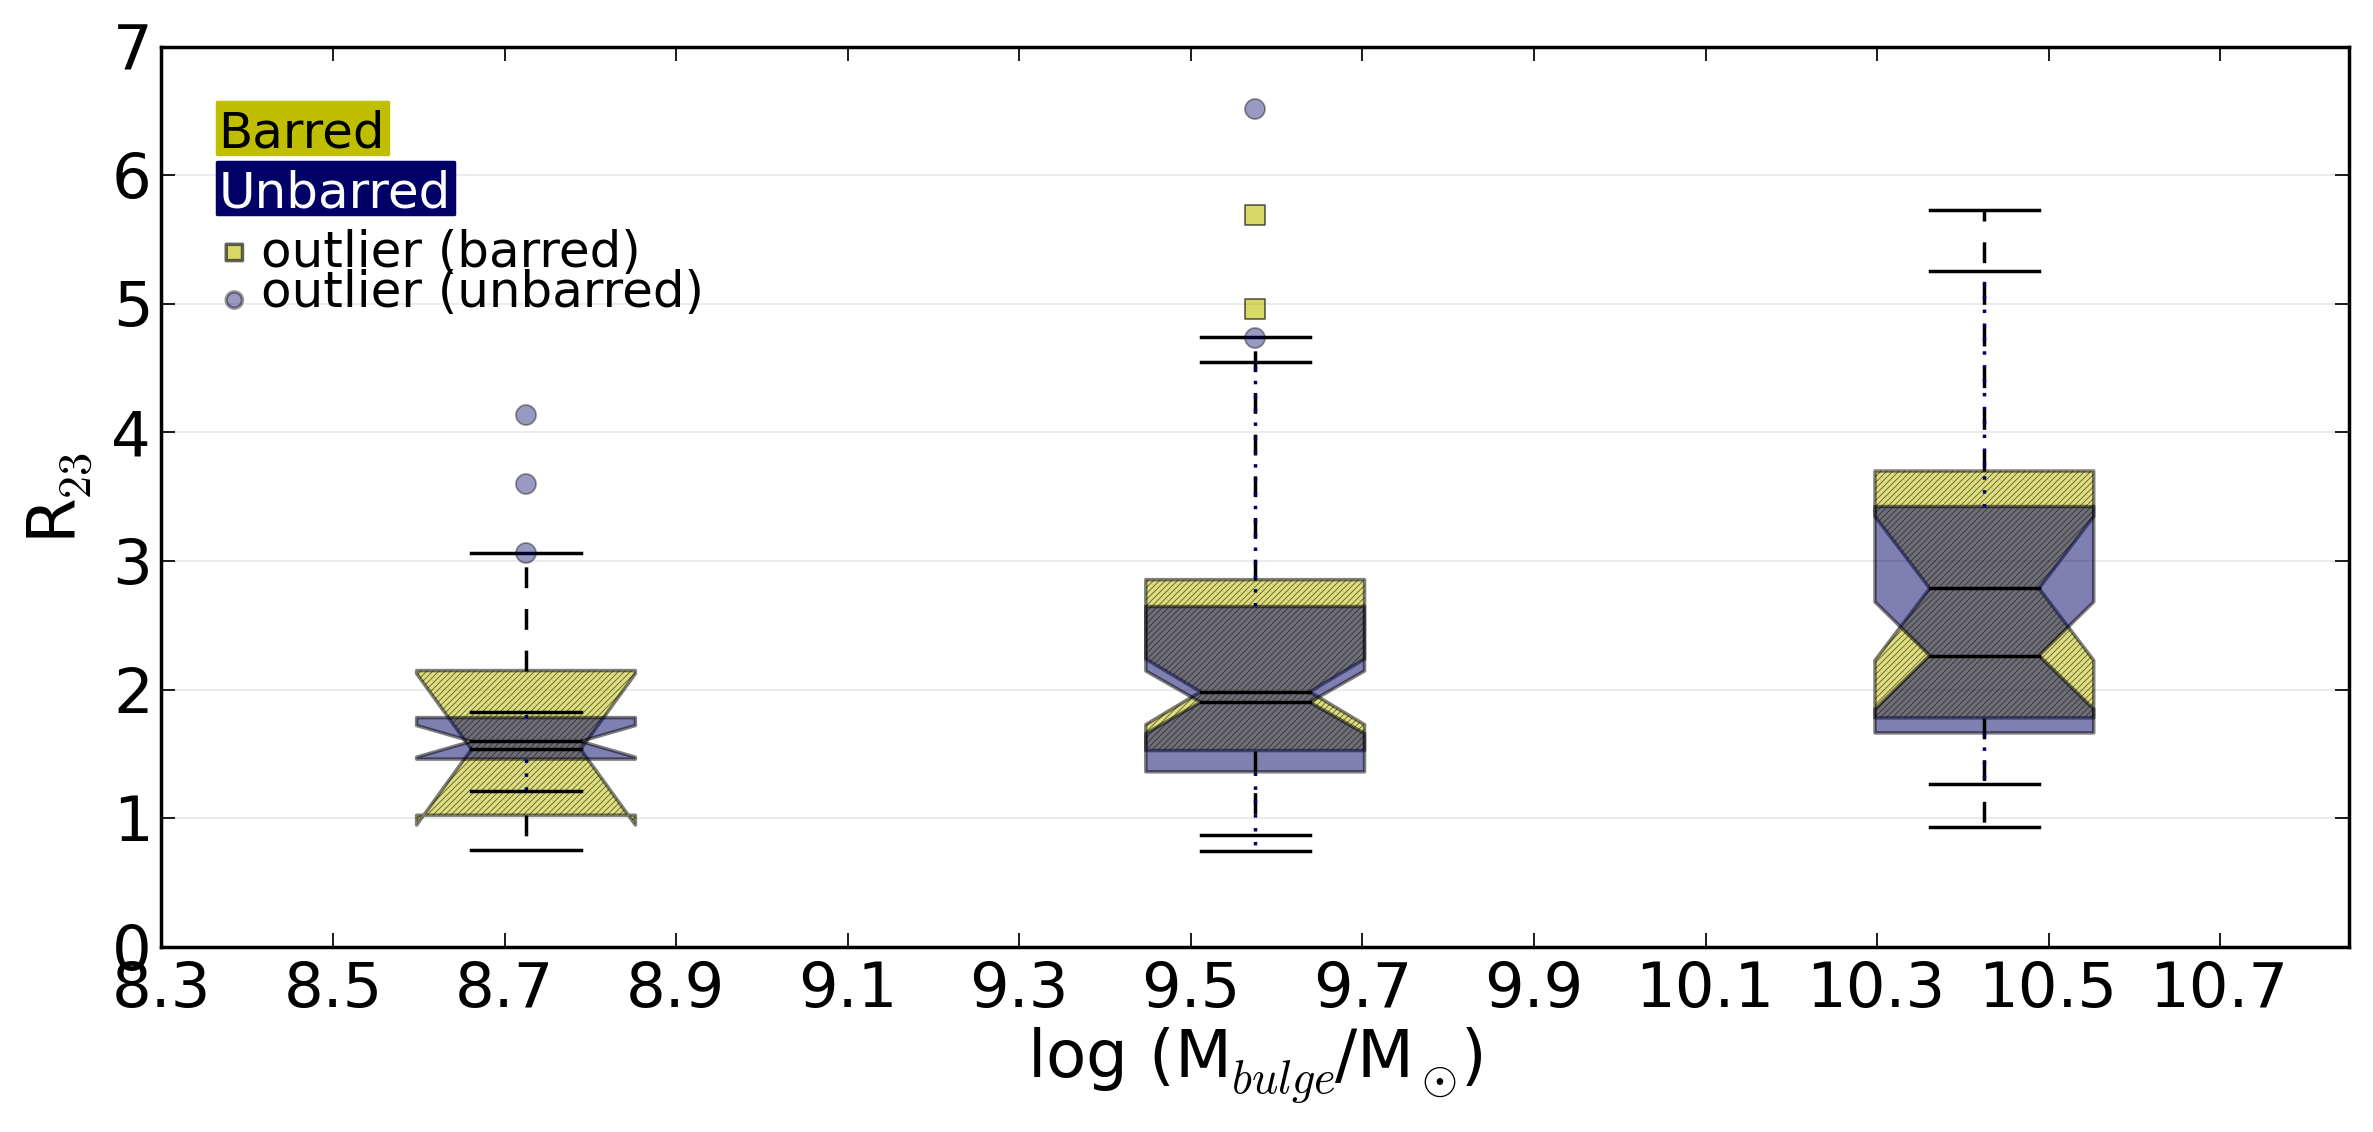
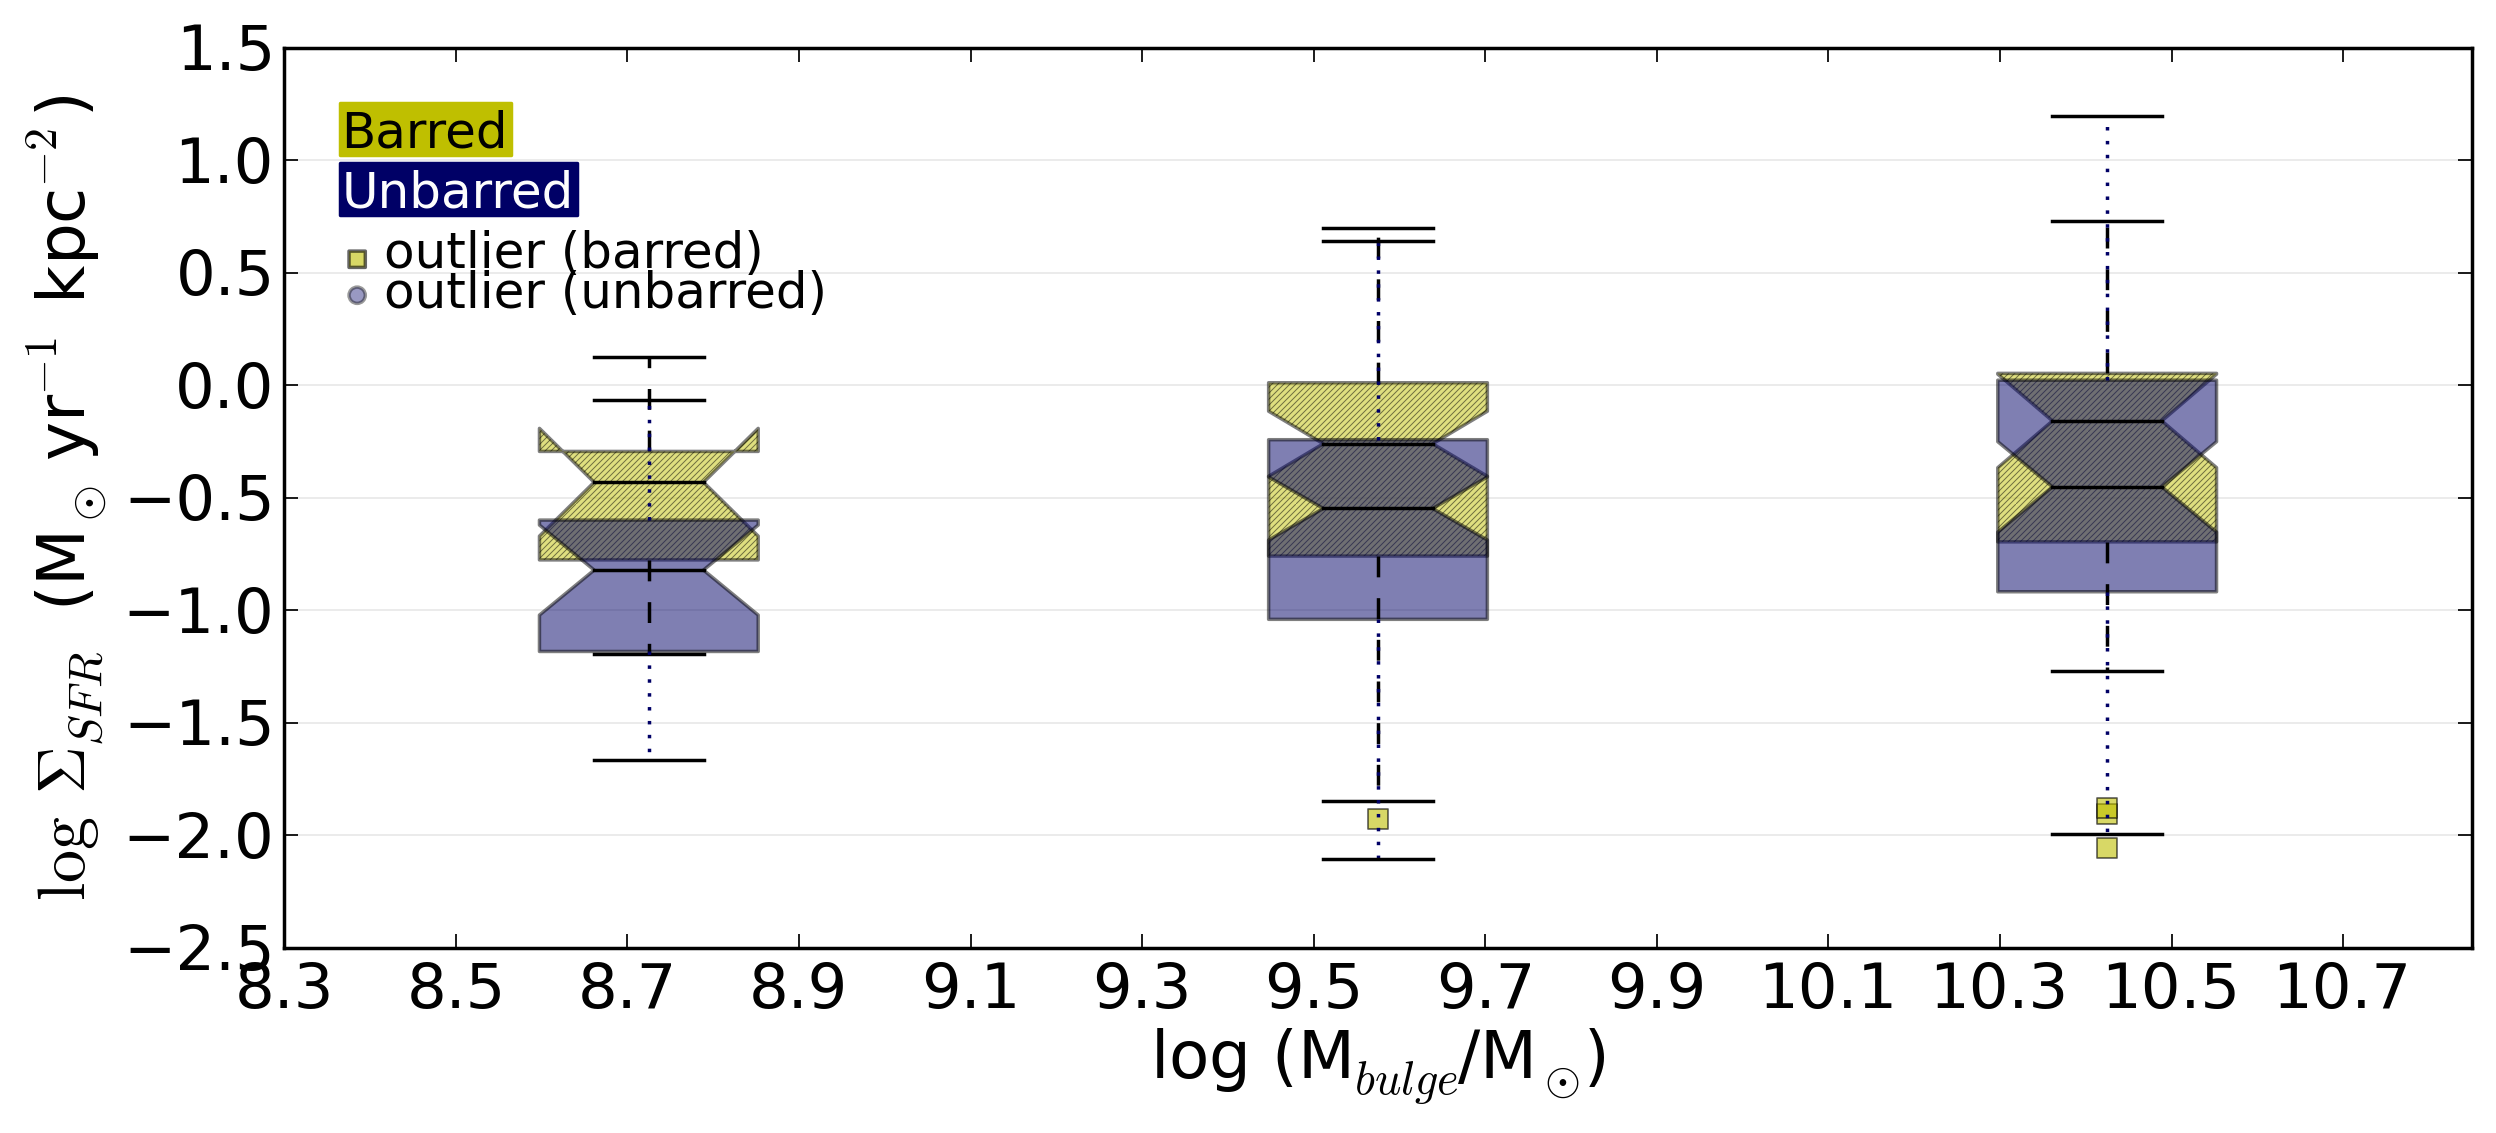
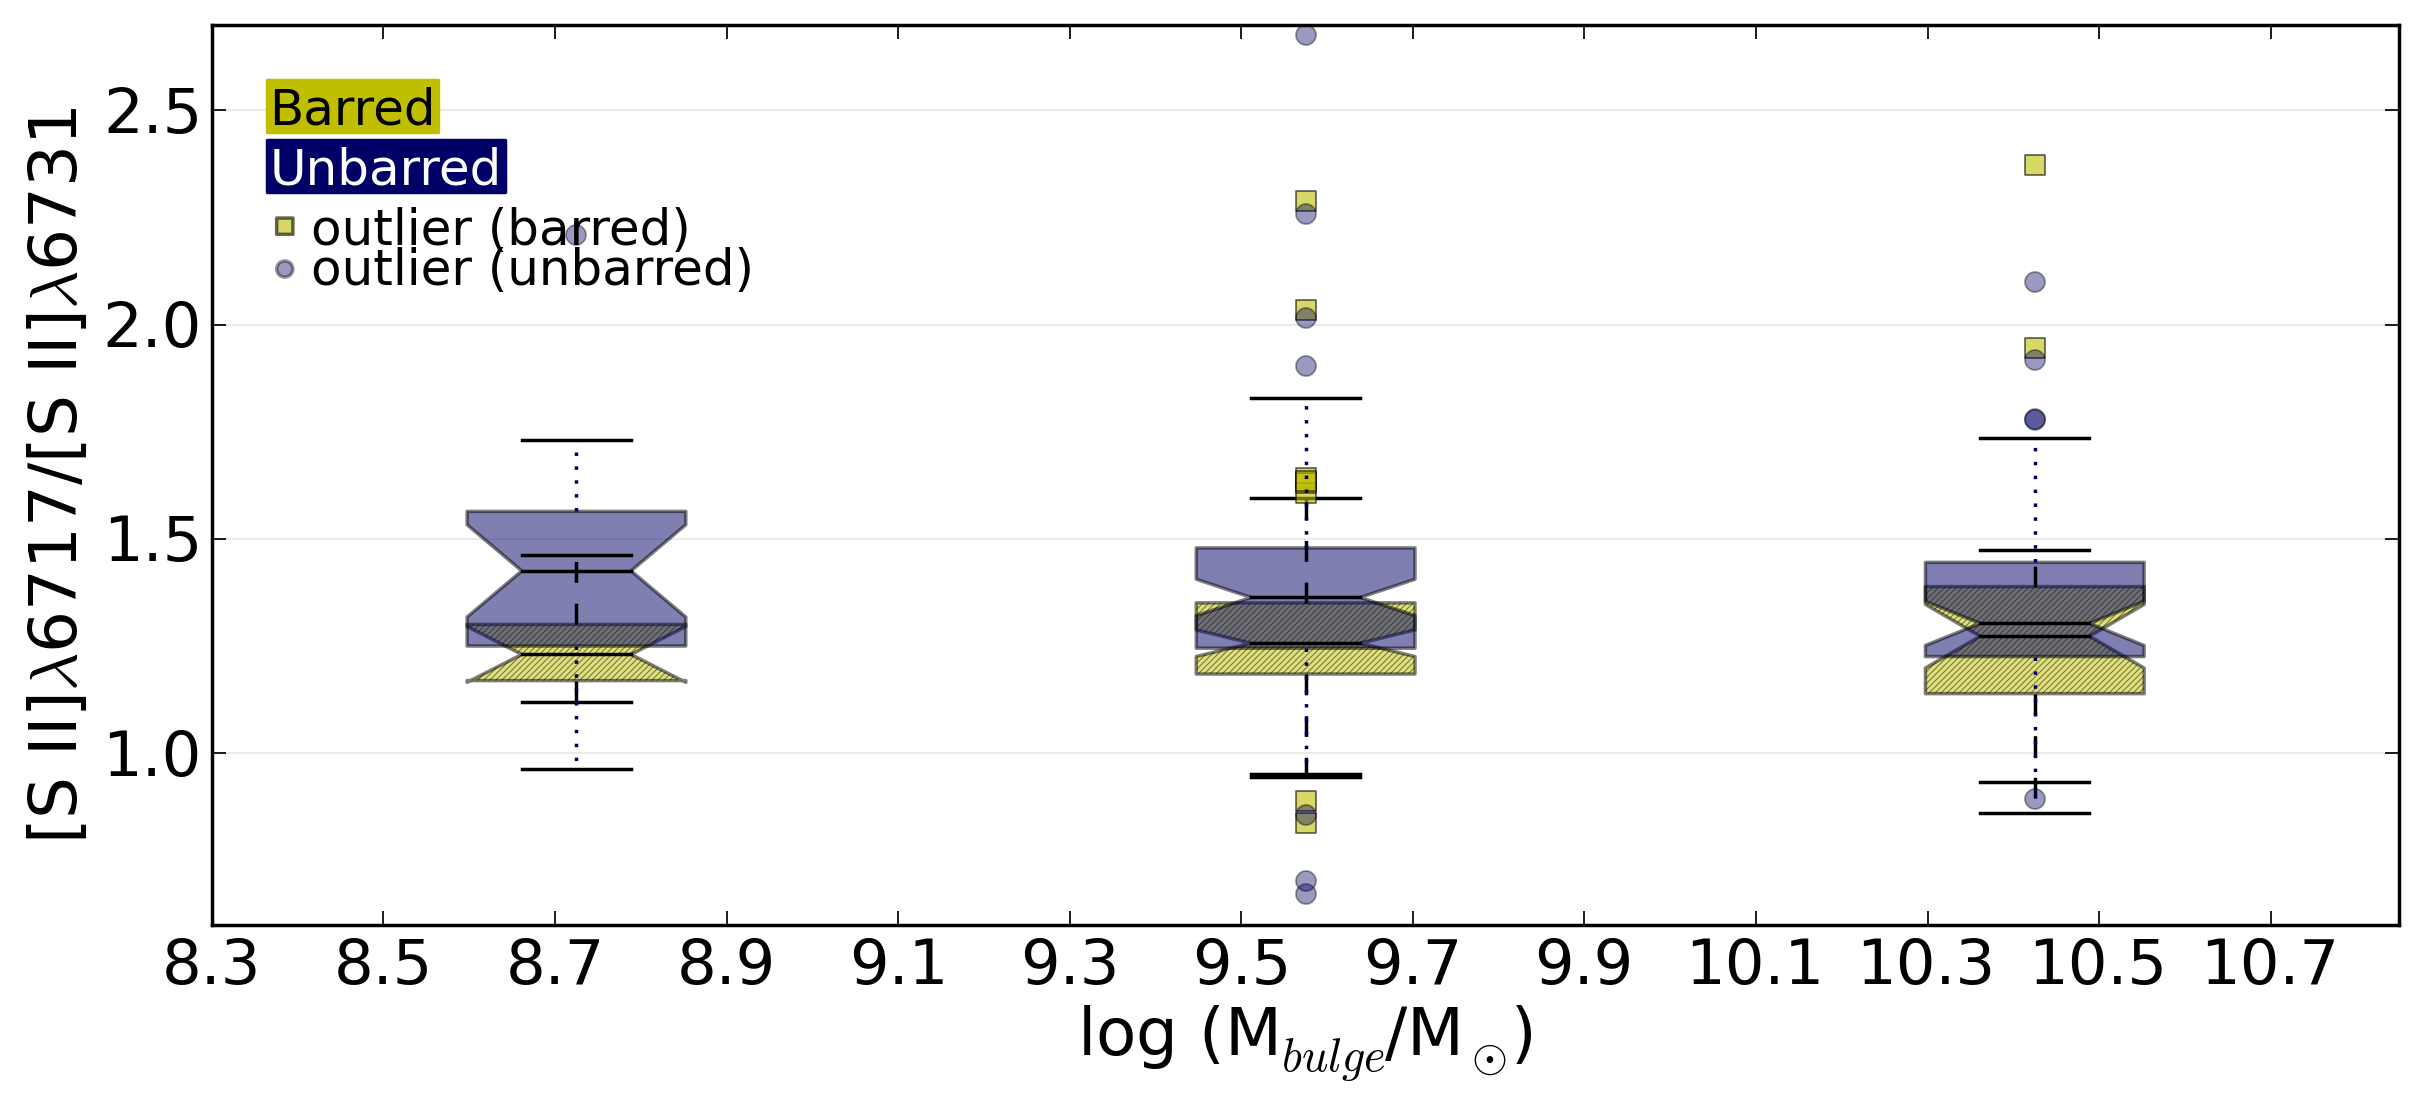
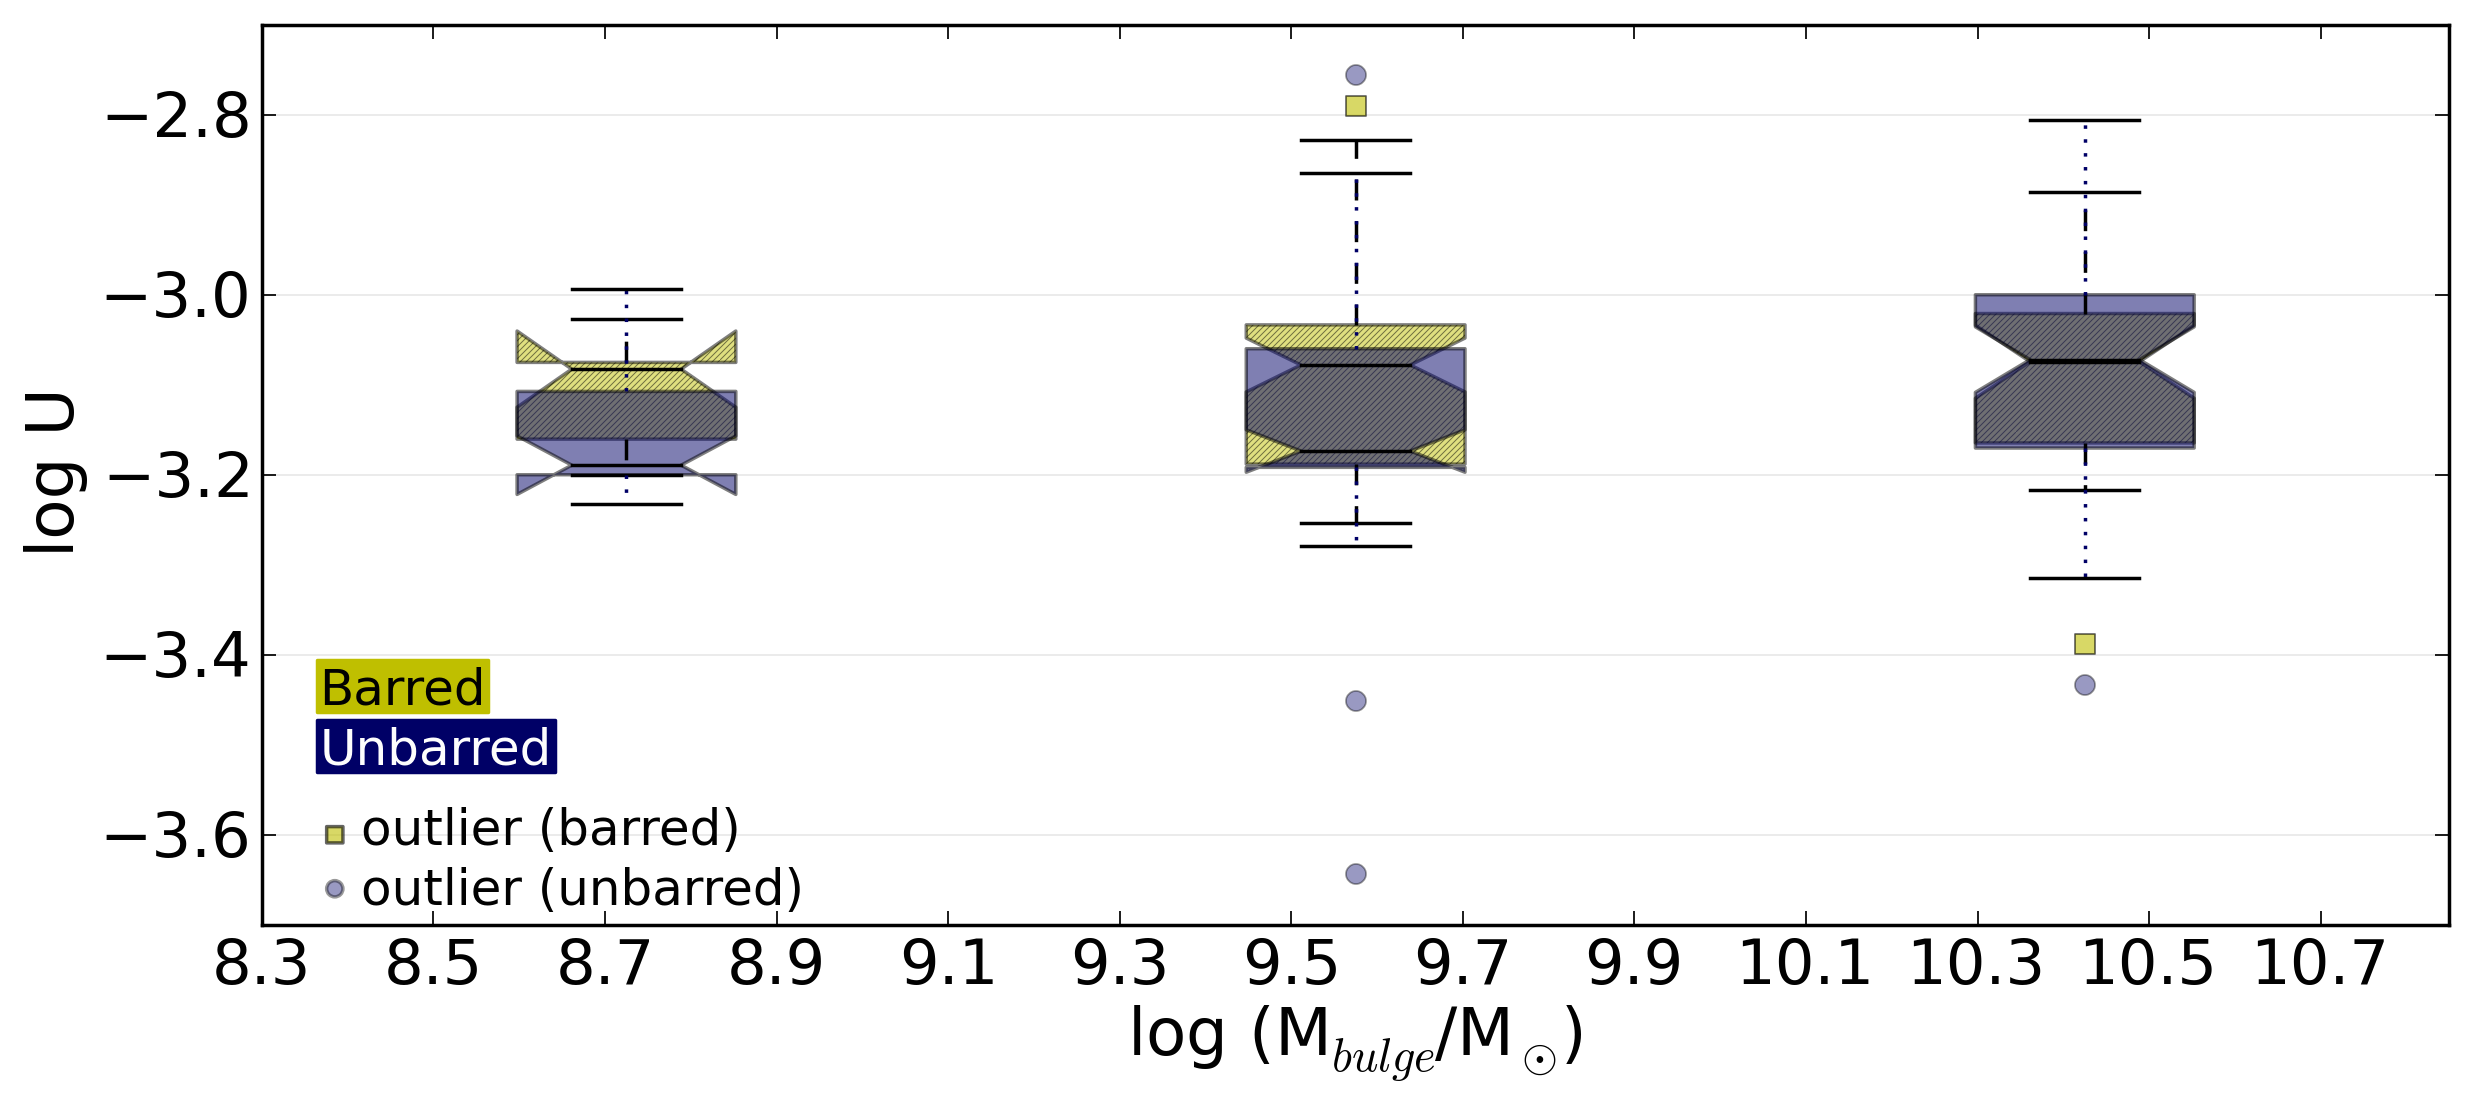
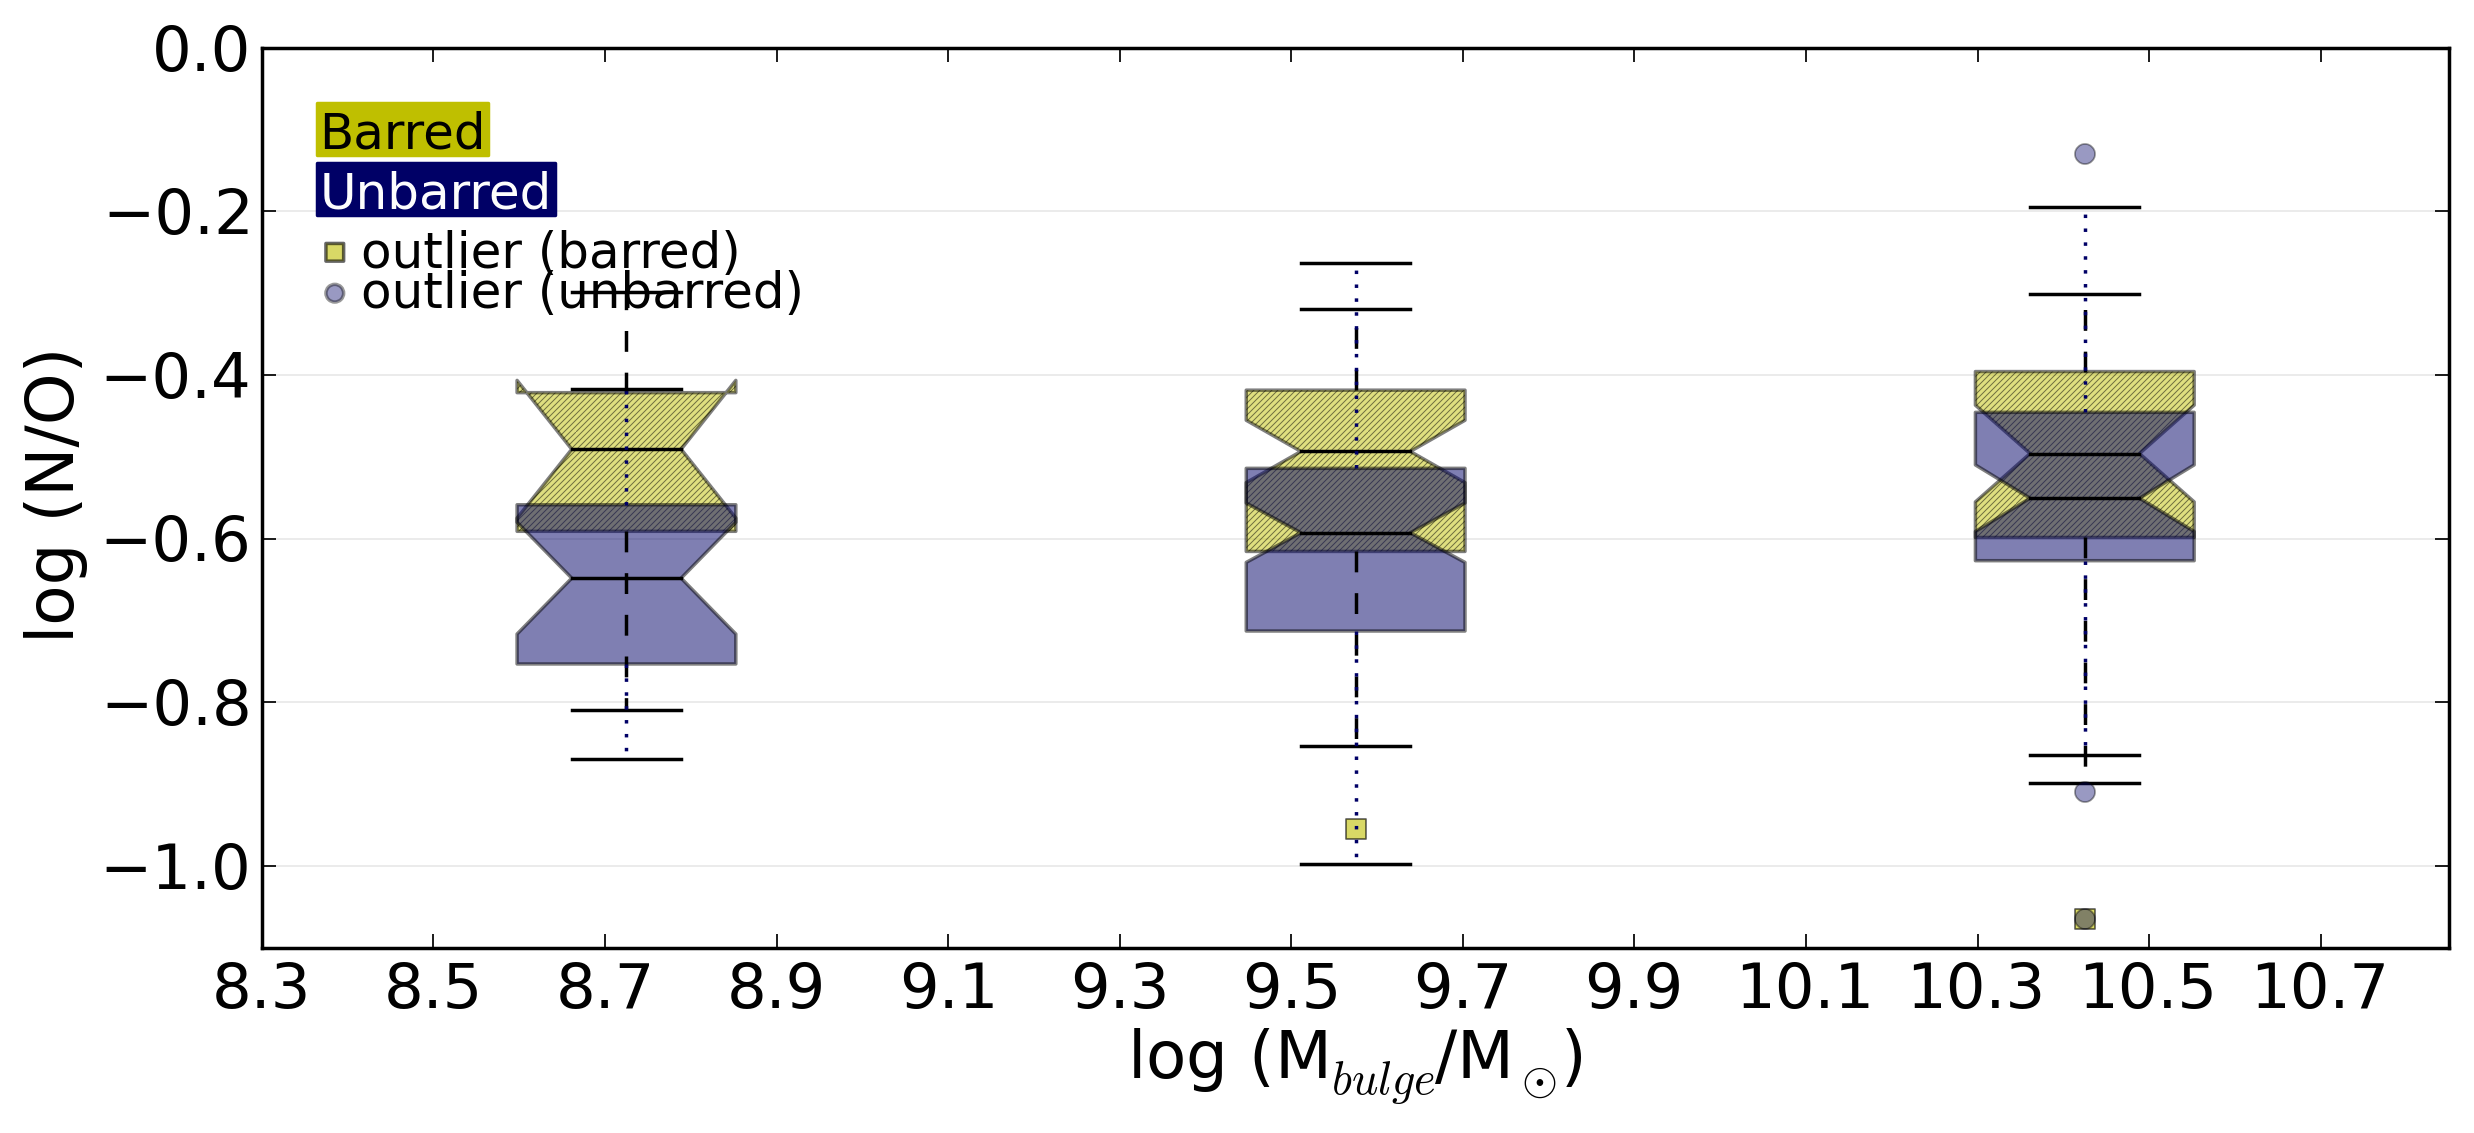
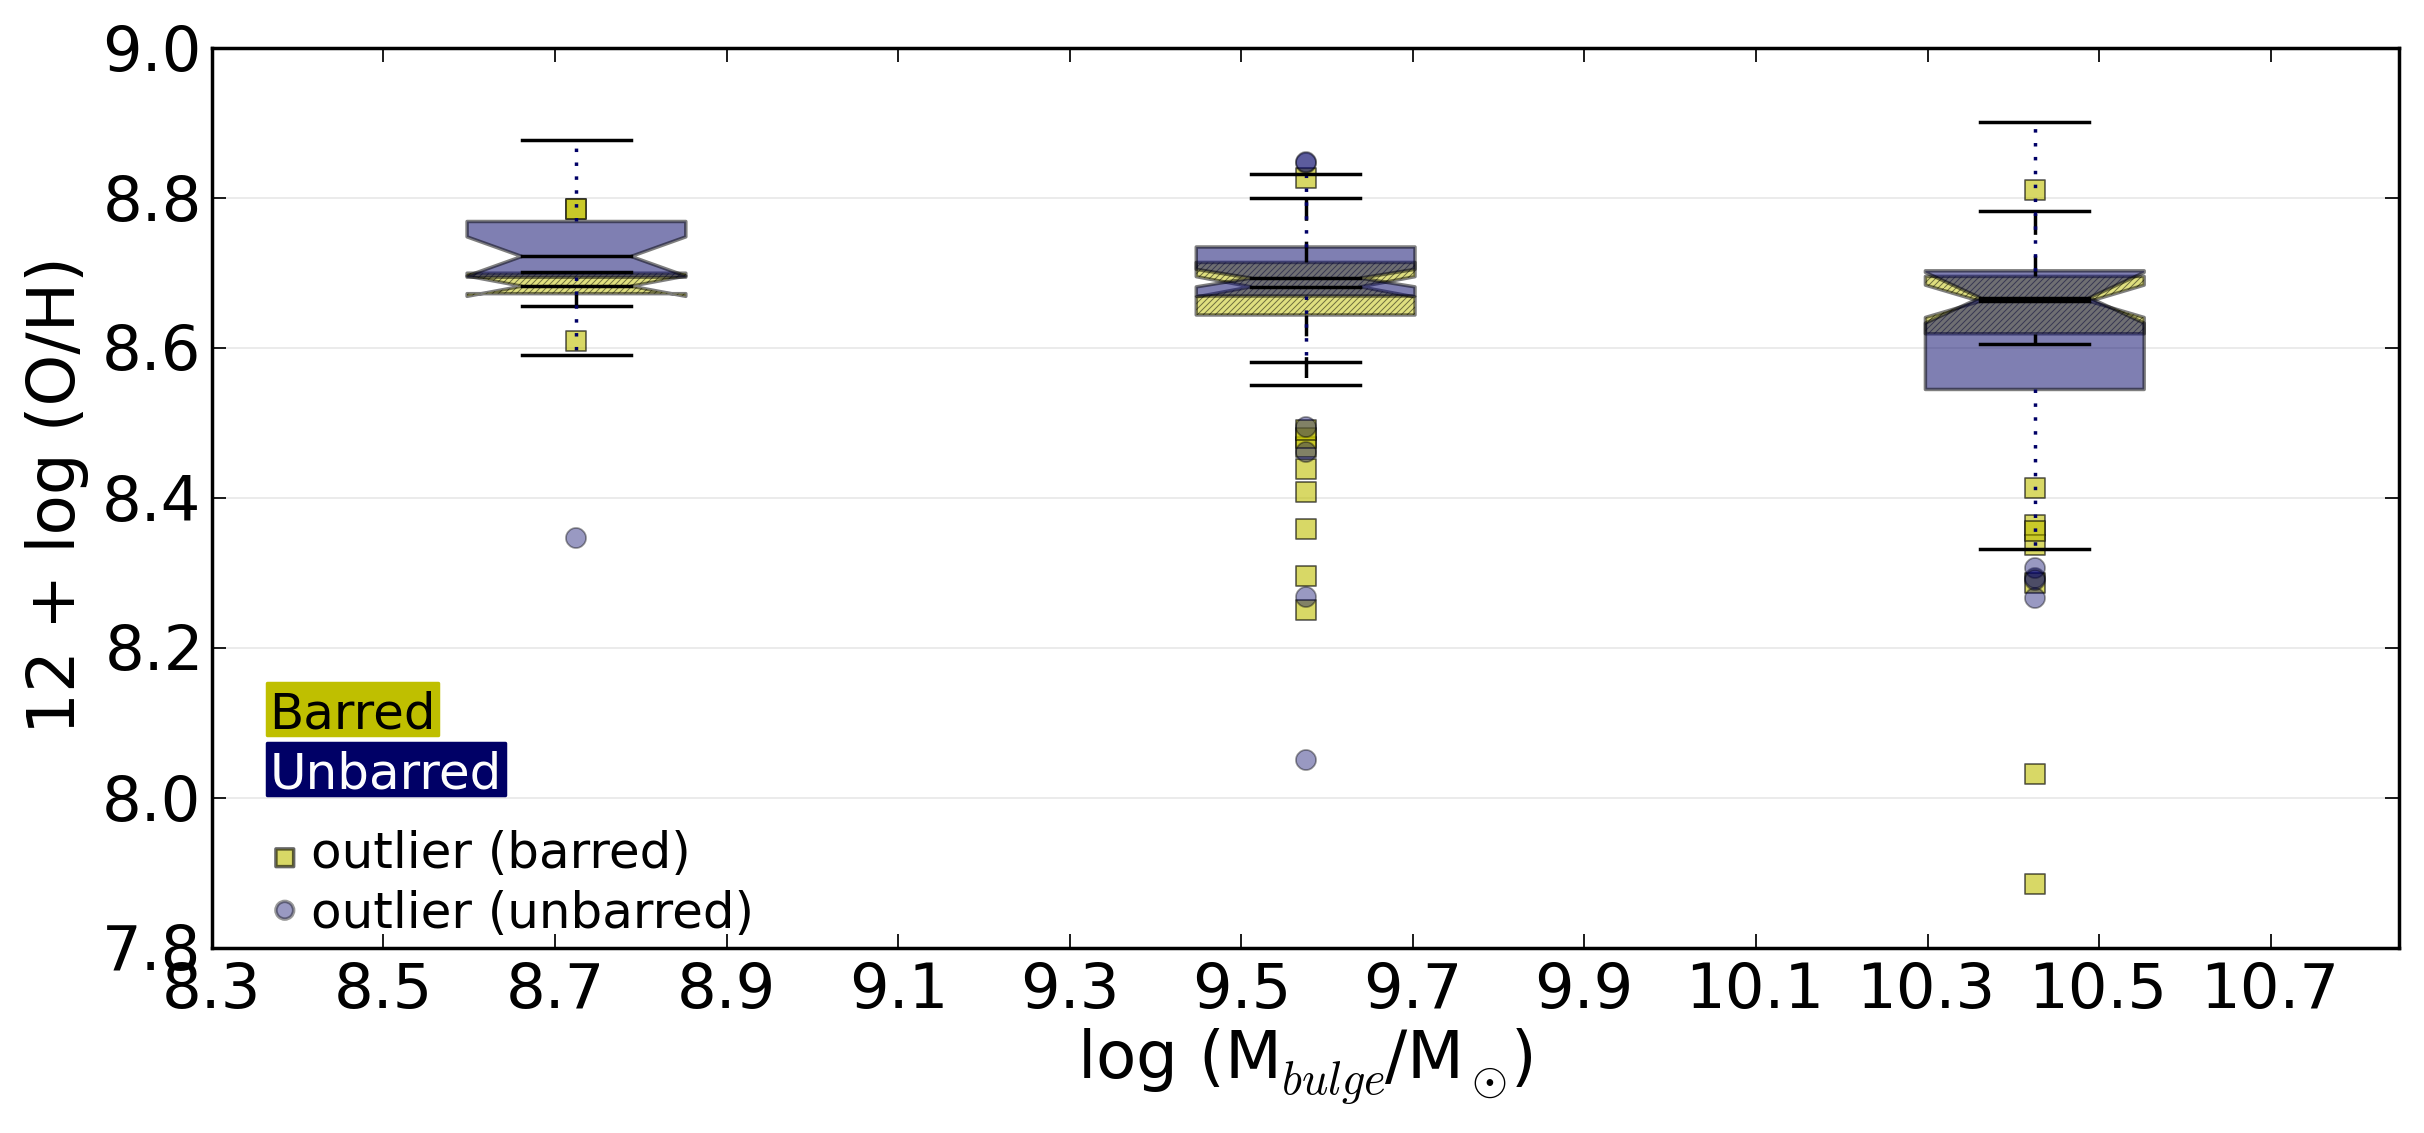
Fig. 17
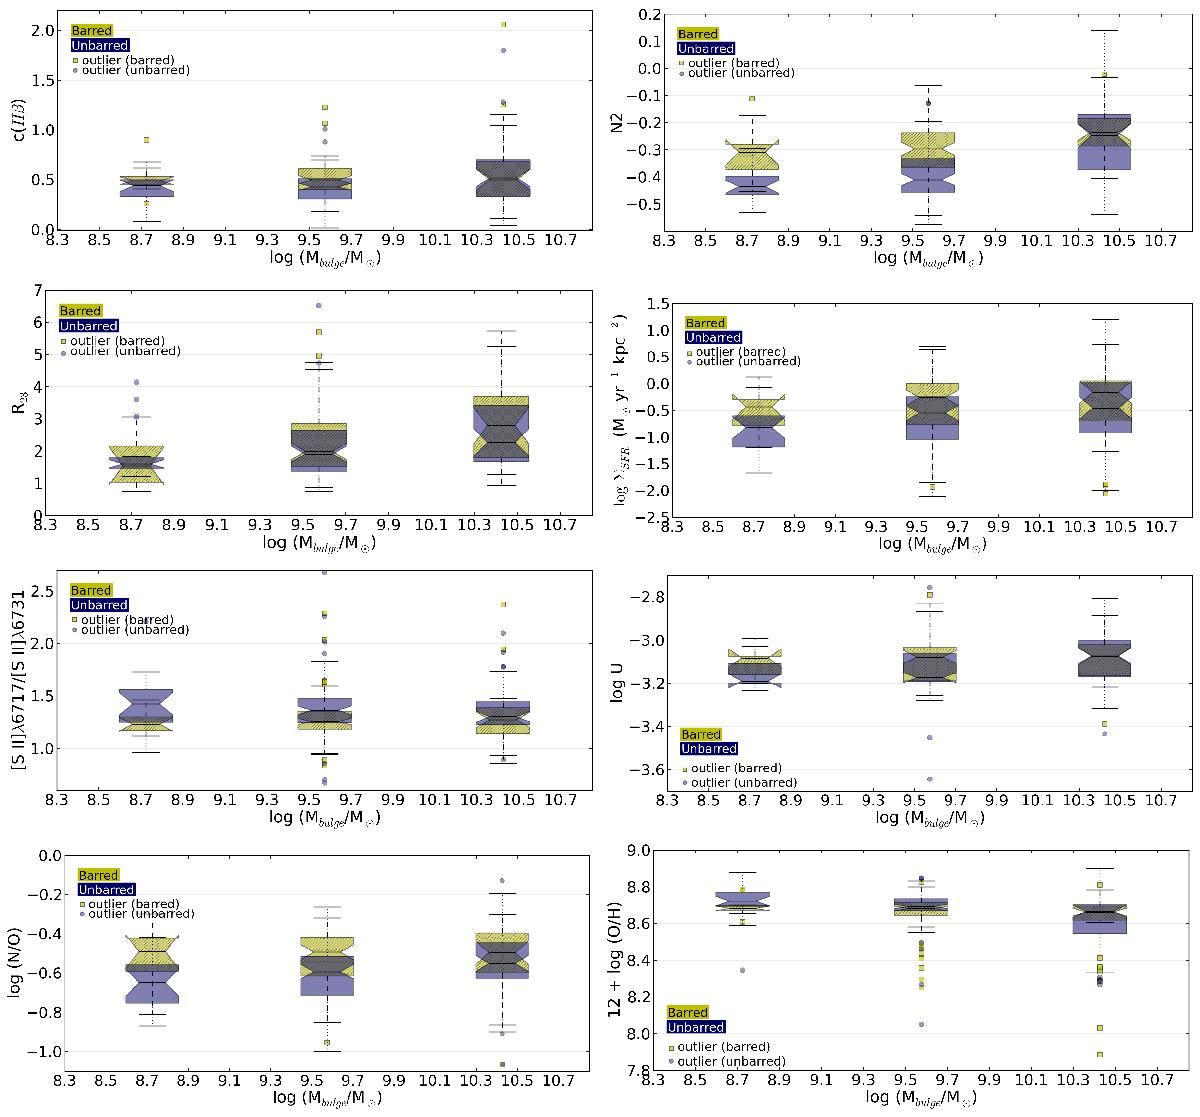
Same as Fig. 16 but as a function of the bulge mass. Each box represents the data distribution for galaxies in a 0.85 dex interval of logarithm in bulge stellar mass centred at the abscissas values of the box position. The number of galaxies in each box, in order of increasing stellar bulge mass, ranges from 9 to 10, 66 to 71, and 28 to 32 for barred galaxies, and from 18 to 22, 70 to 81, and 28 to 32, for unbarred galaxies.
Current usage metrics show cumulative count of Article Views (full-text article views including HTML views, PDF and ePub downloads, according to the available data) and Abstracts Views on Vision4Press platform.
Data correspond to usage on the plateform after 2015. The current usage metrics is available 48-96 hours after online publication and is updated daily on week days.
Initial download of the metrics may take a while.