Fig. A.1
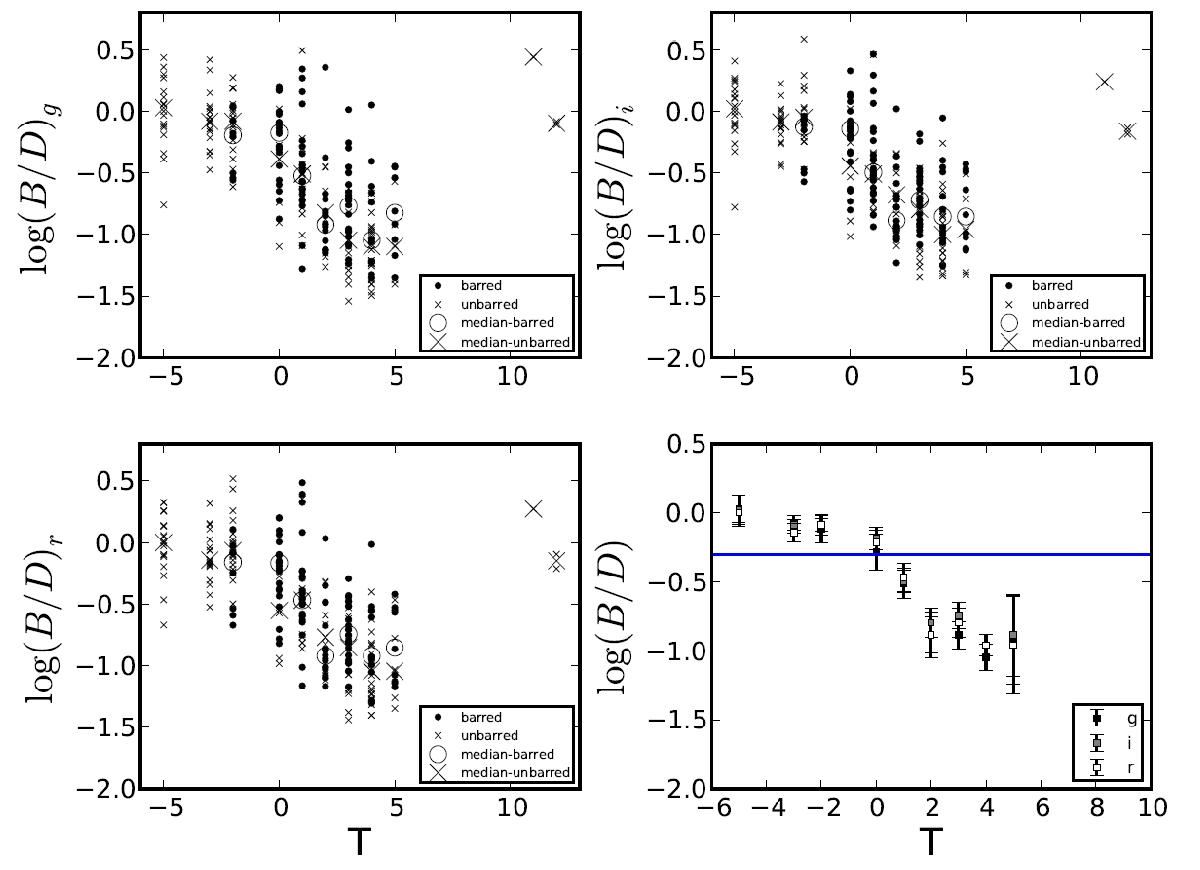
Logarithm of the B/D flux ratio in the g, r, and i-band versus morphological type (expressed as T-type) for the galaxies of the sample contained in the Nair & Abraham (2010) catalogue. Big crosses and big empty circles mark the median log (B/D) for each T-type value for unbarred and barred galaxies, respectively. The bottom right-hand panel shows the median log (B/D) in each band for each T-type value. Error bars represent the 95% confidence level of the median value for the distribution of B/D values at each T-type value. The blue solid straight line marks B/D = 0.5, that we have used to separate early from late-type galaxies.
Current usage metrics show cumulative count of Article Views (full-text article views including HTML views, PDF and ePub downloads, according to the available data) and Abstracts Views on Vision4Press platform.
Data correspond to usage on the plateform after 2015. The current usage metrics is available 48-96 hours after online publication and is updated daily on week days.
Initial download of the metrics may take a while.