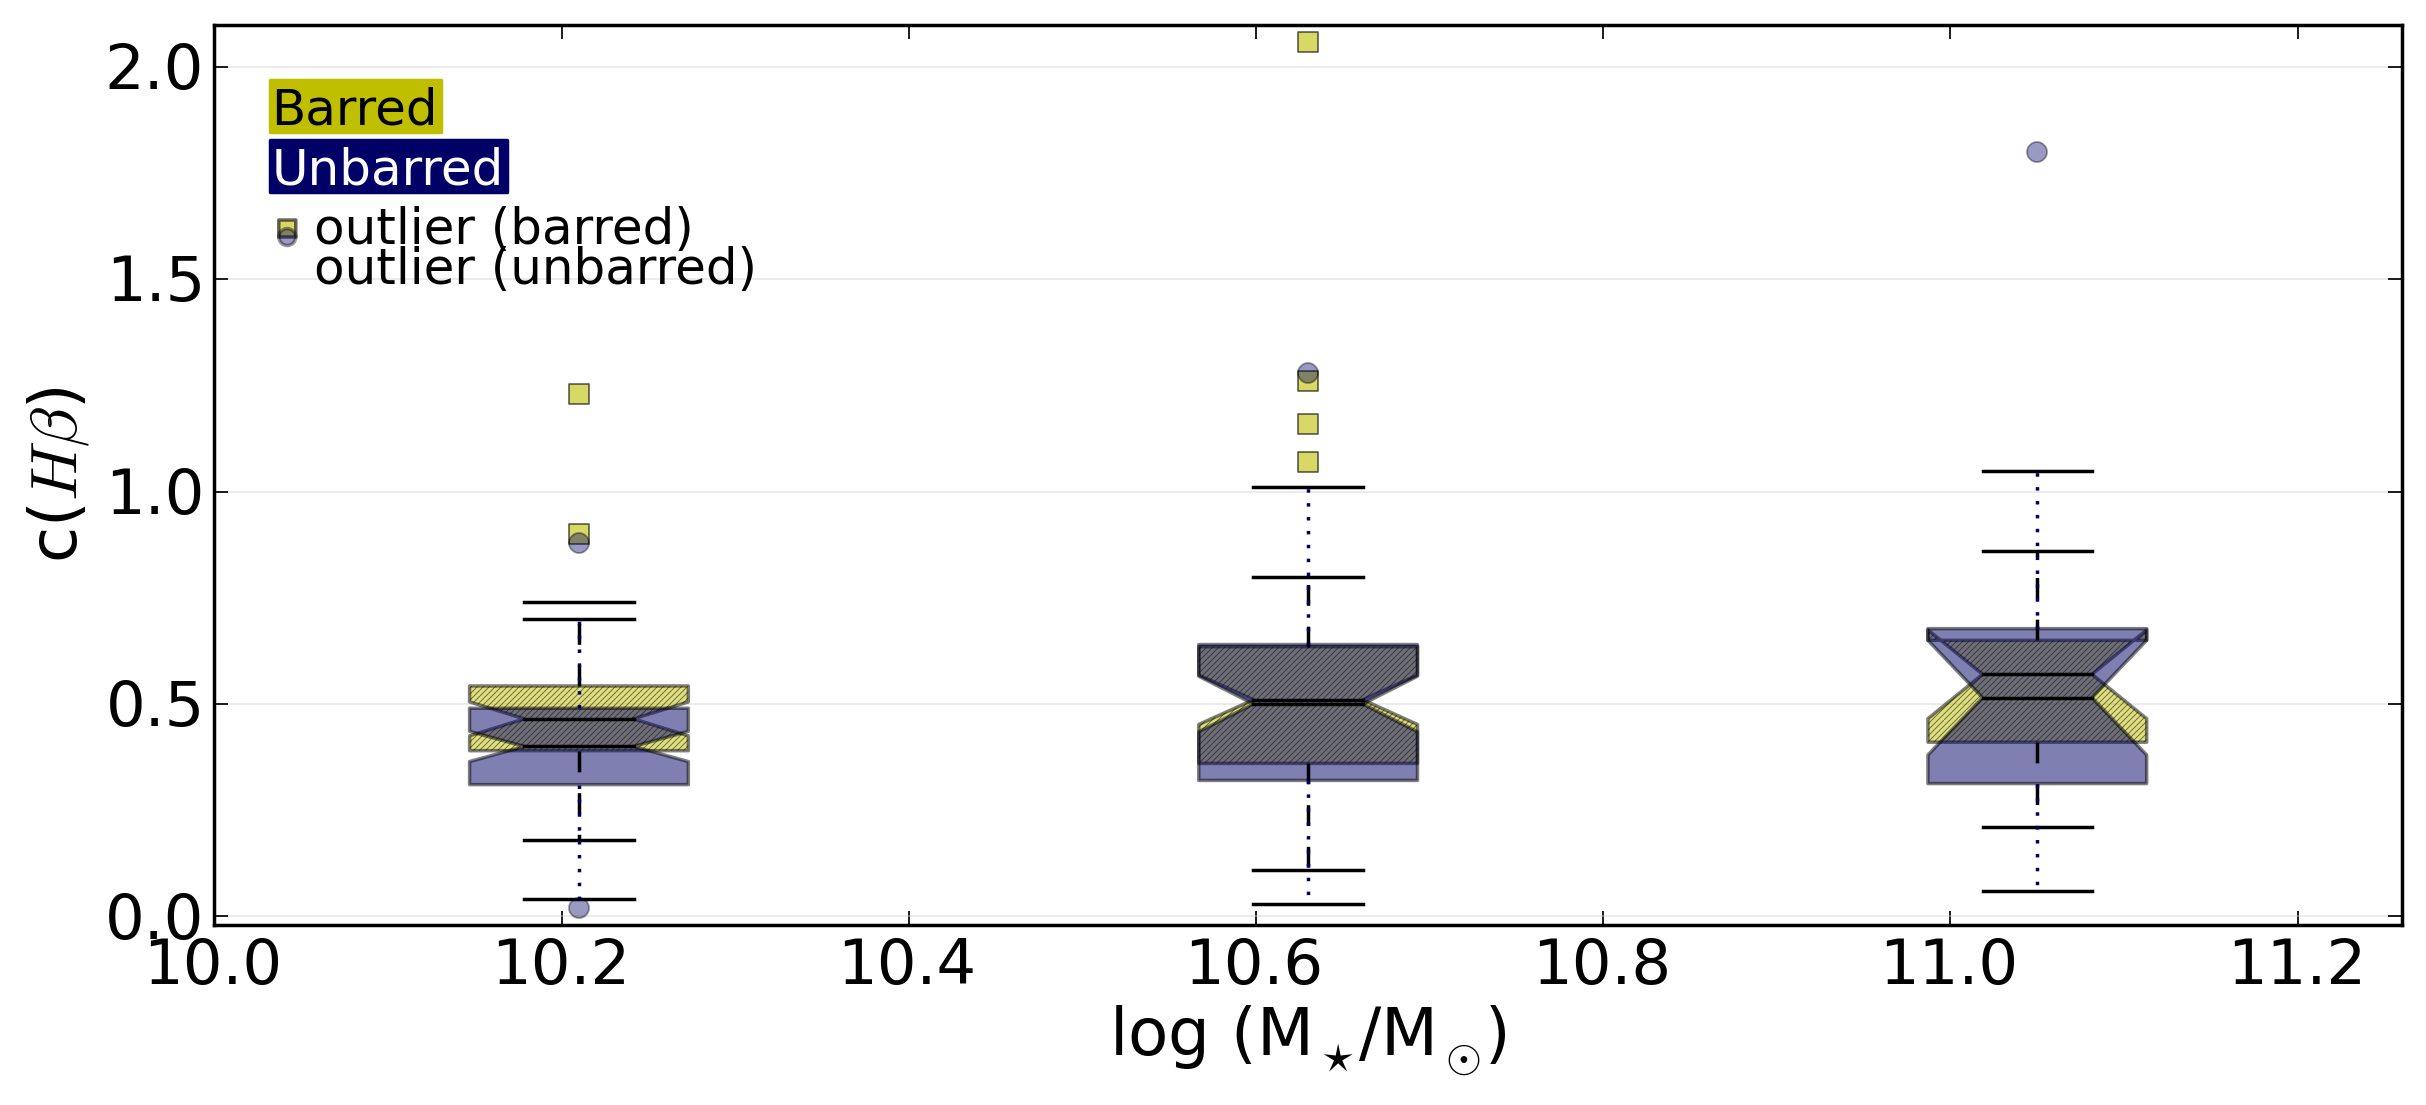
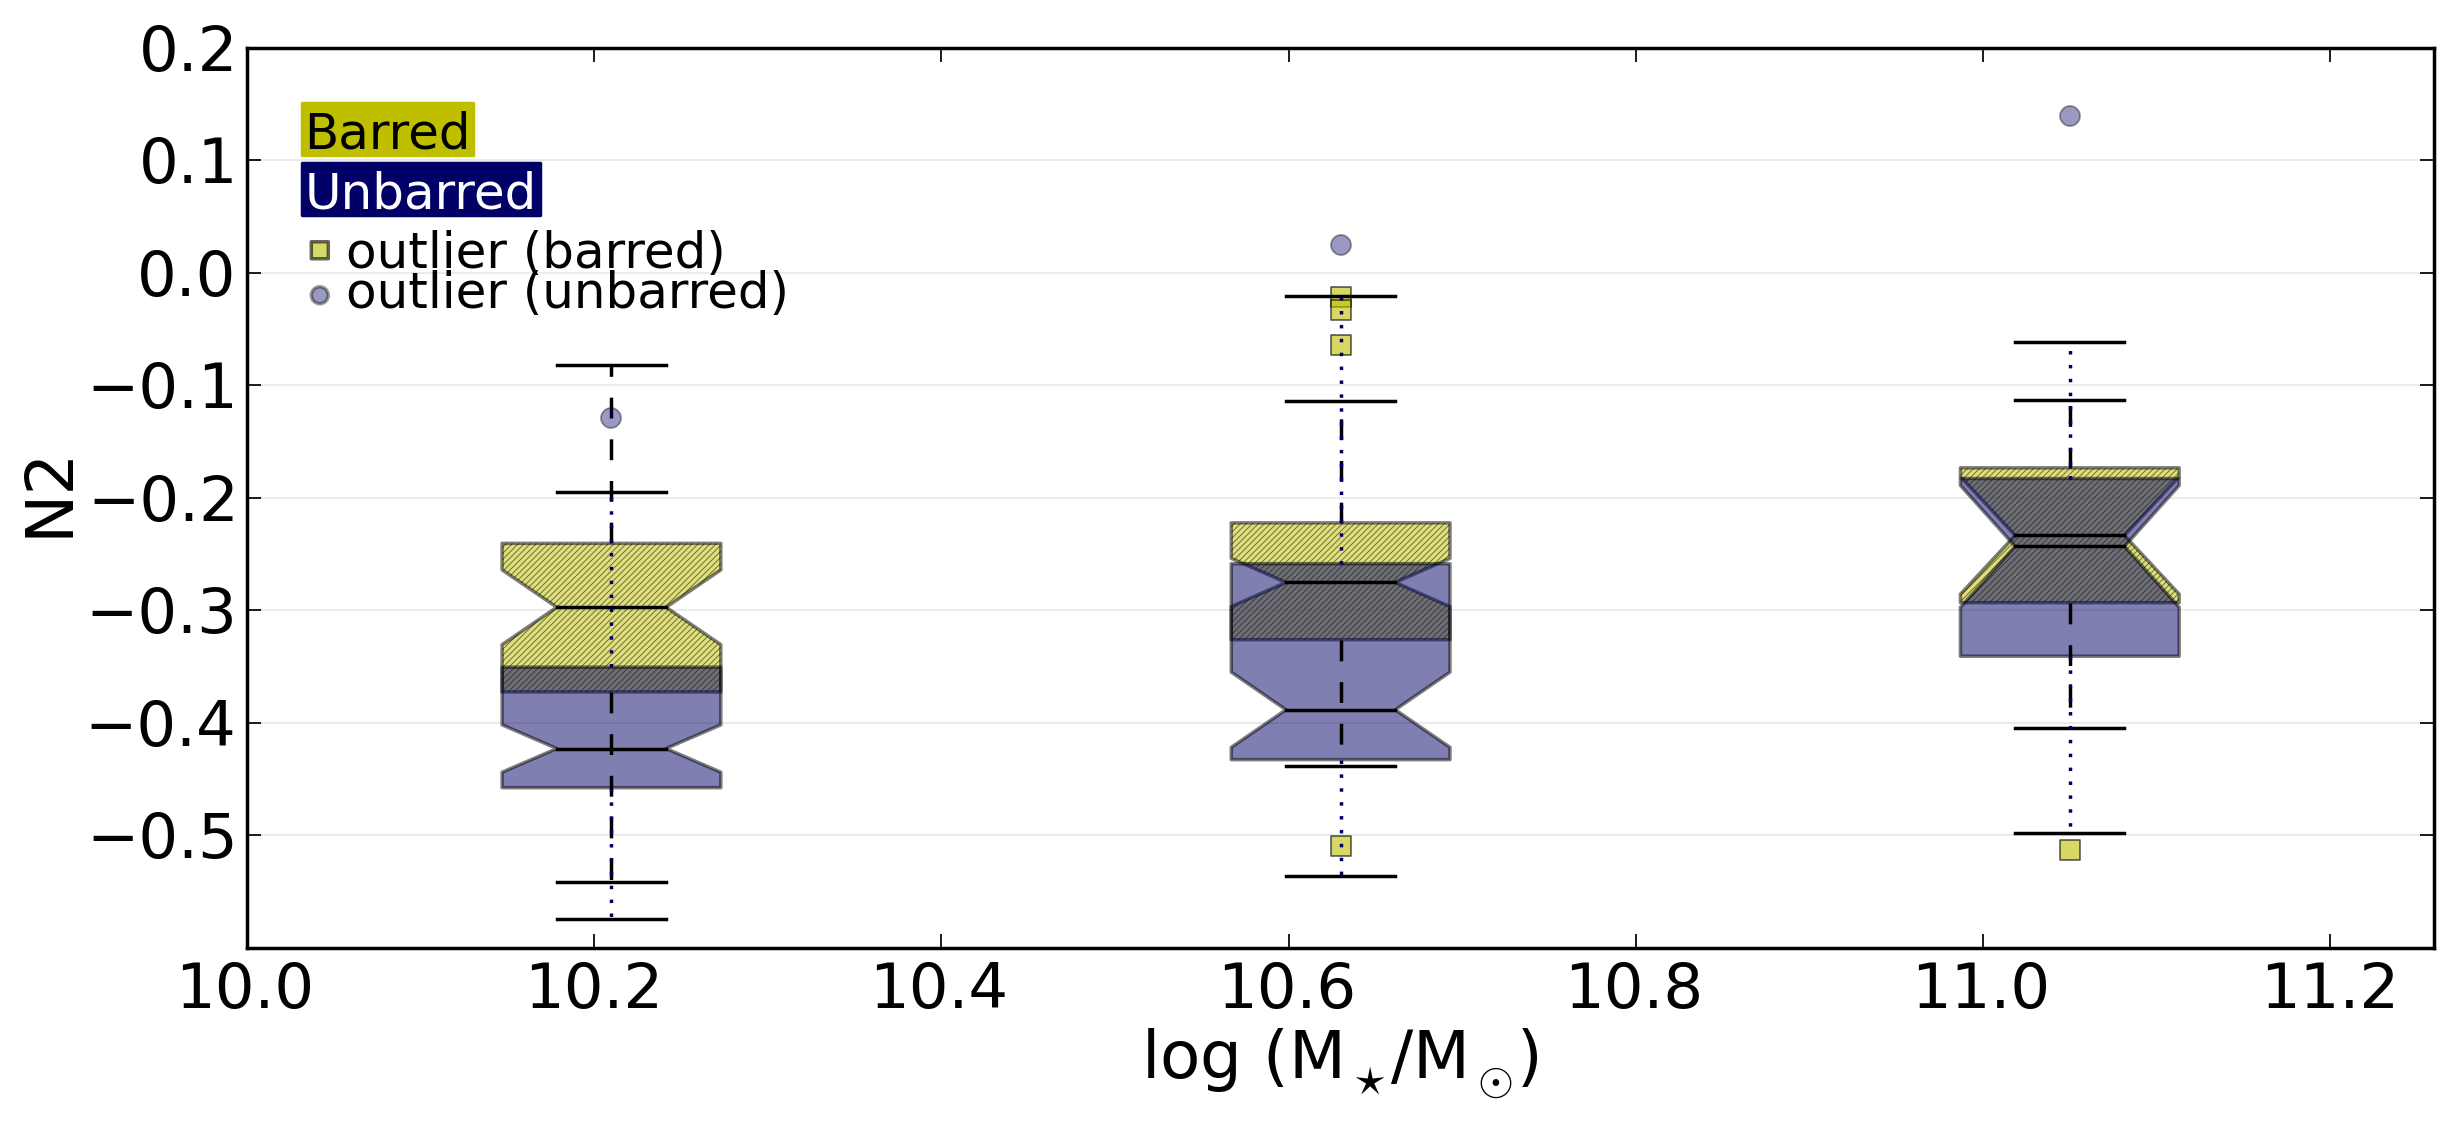
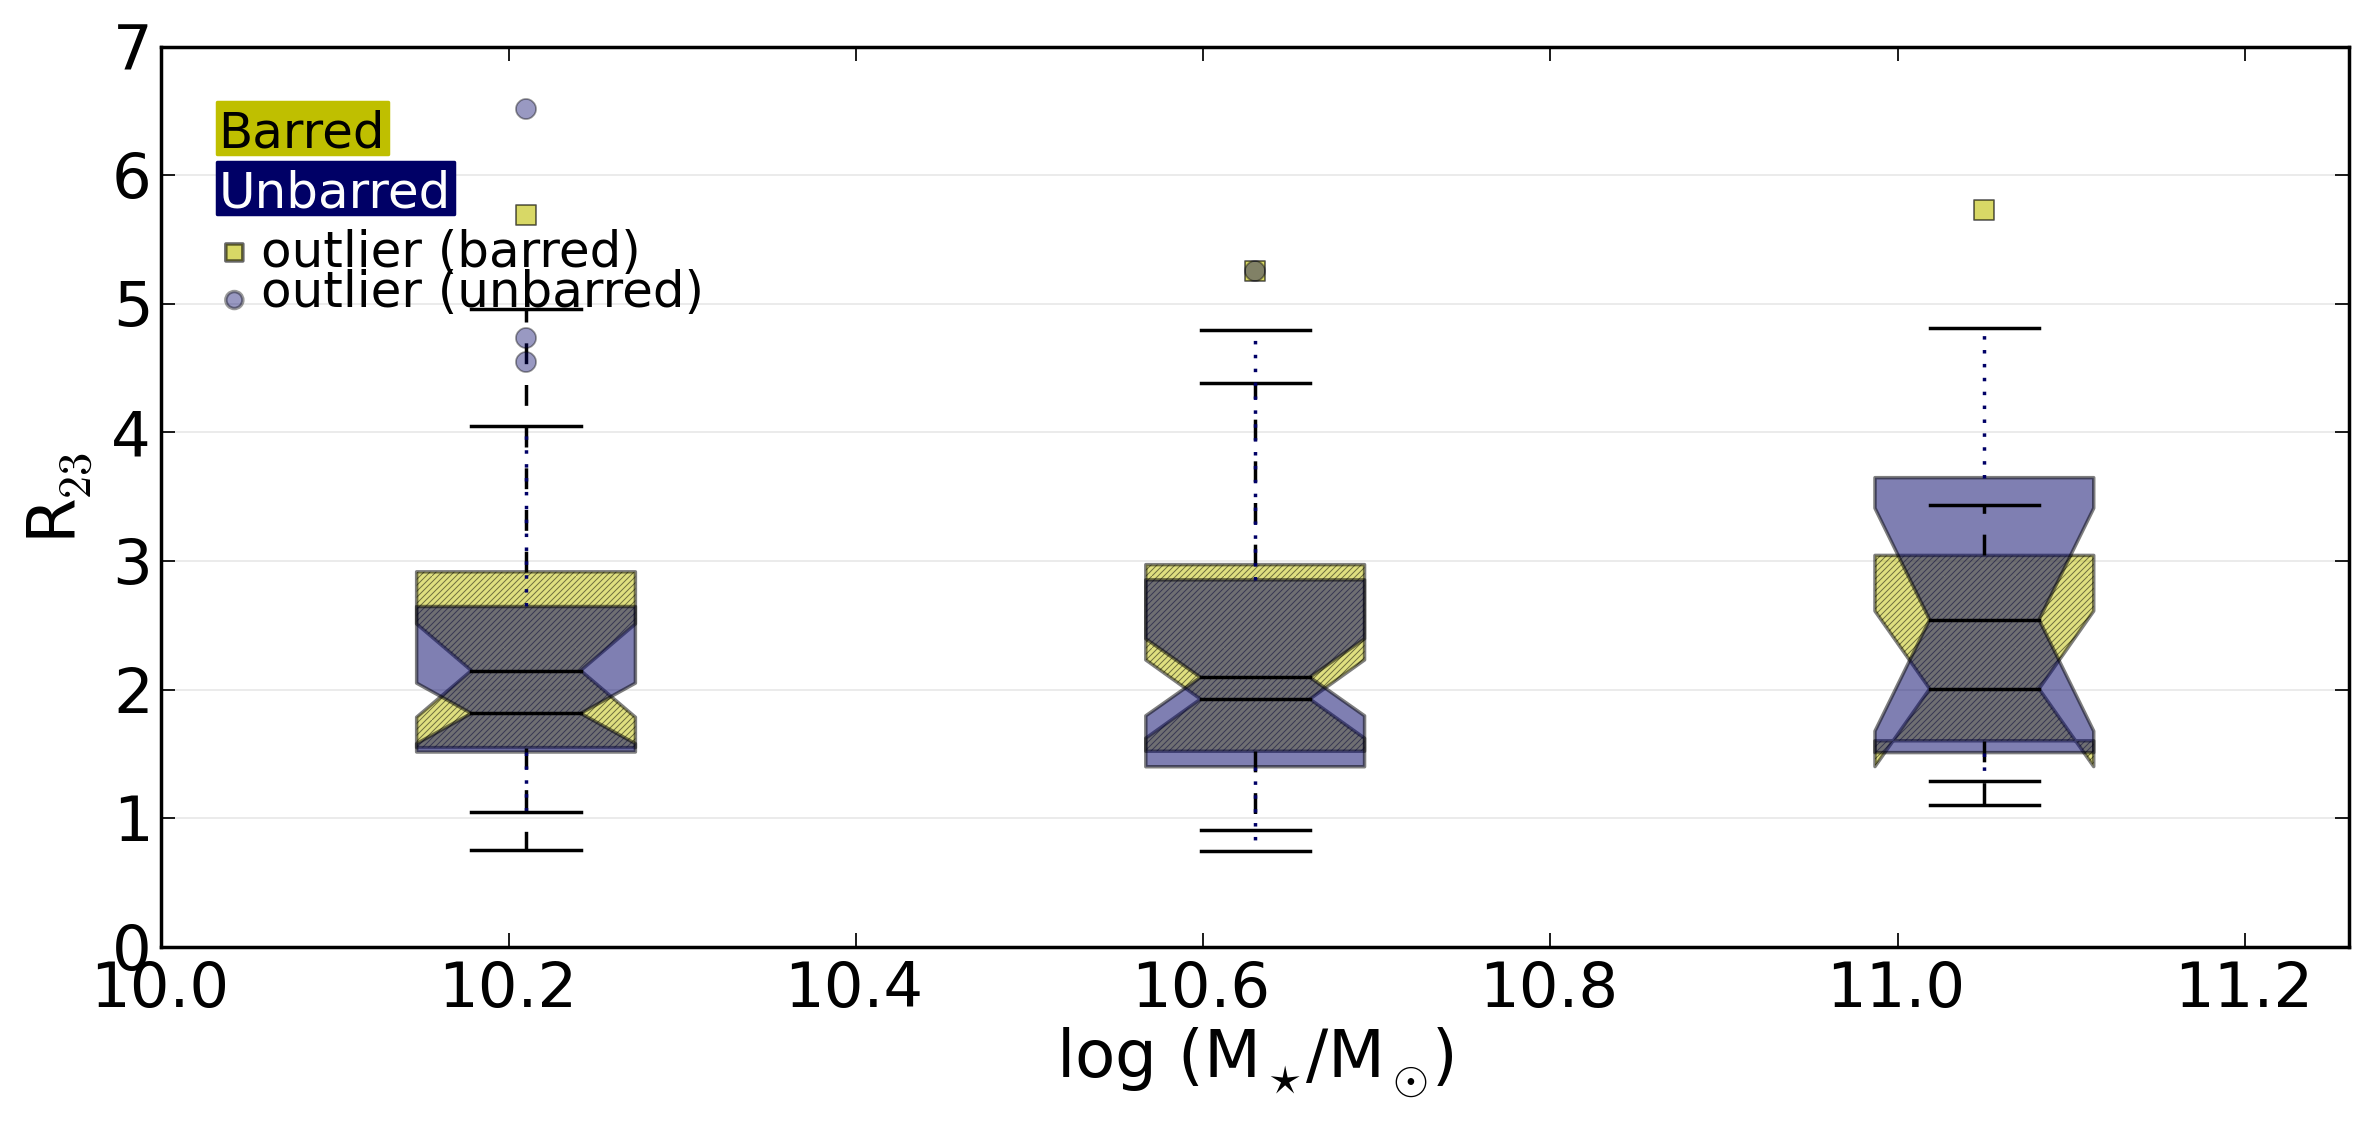
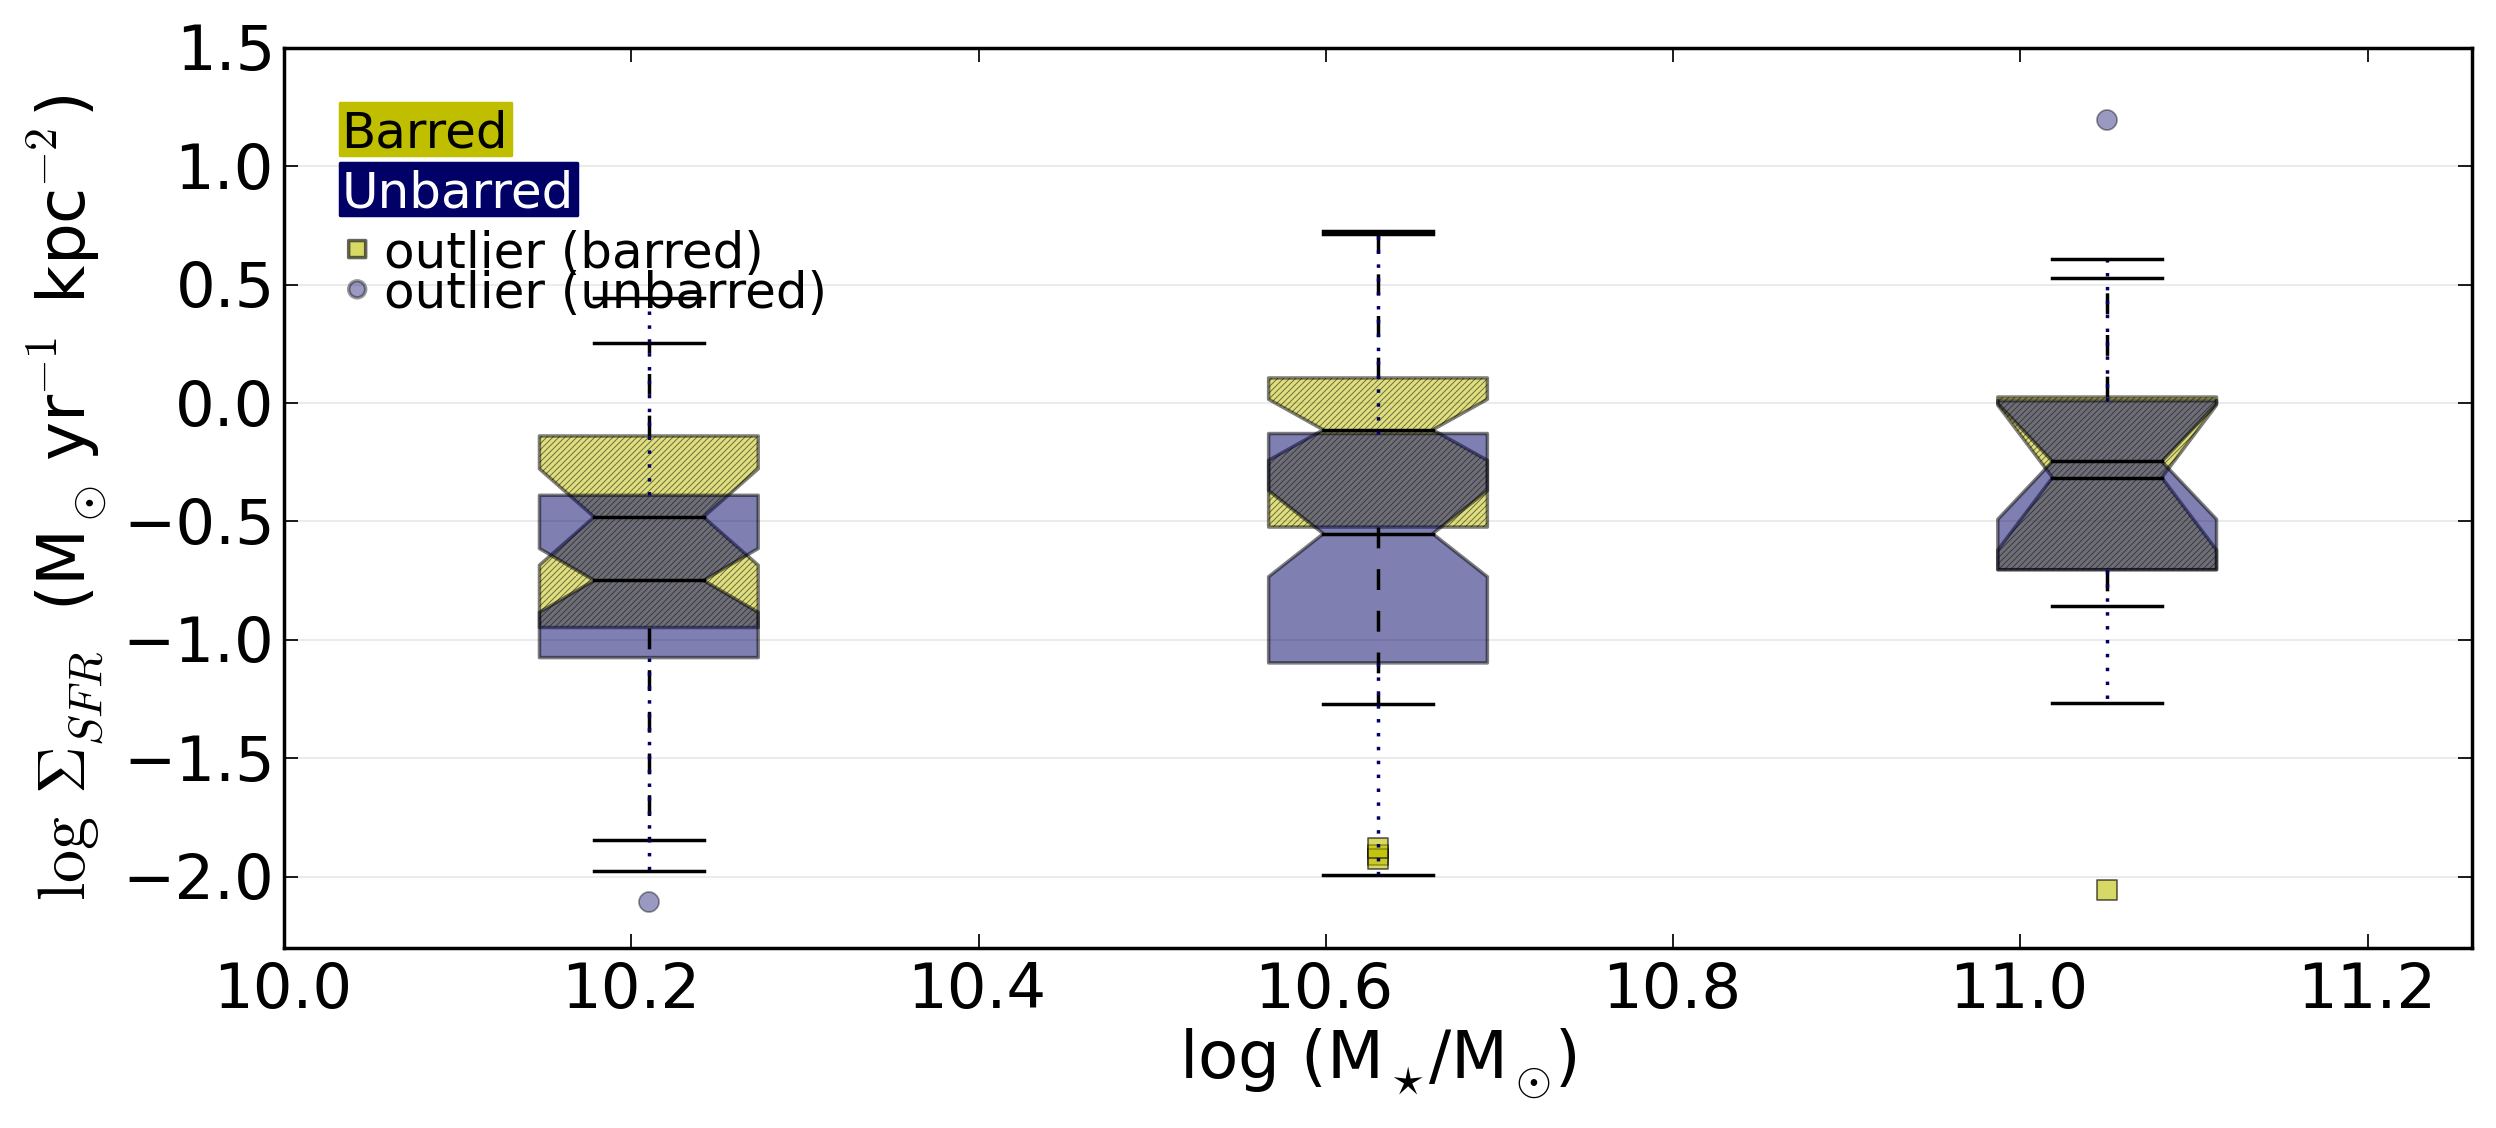
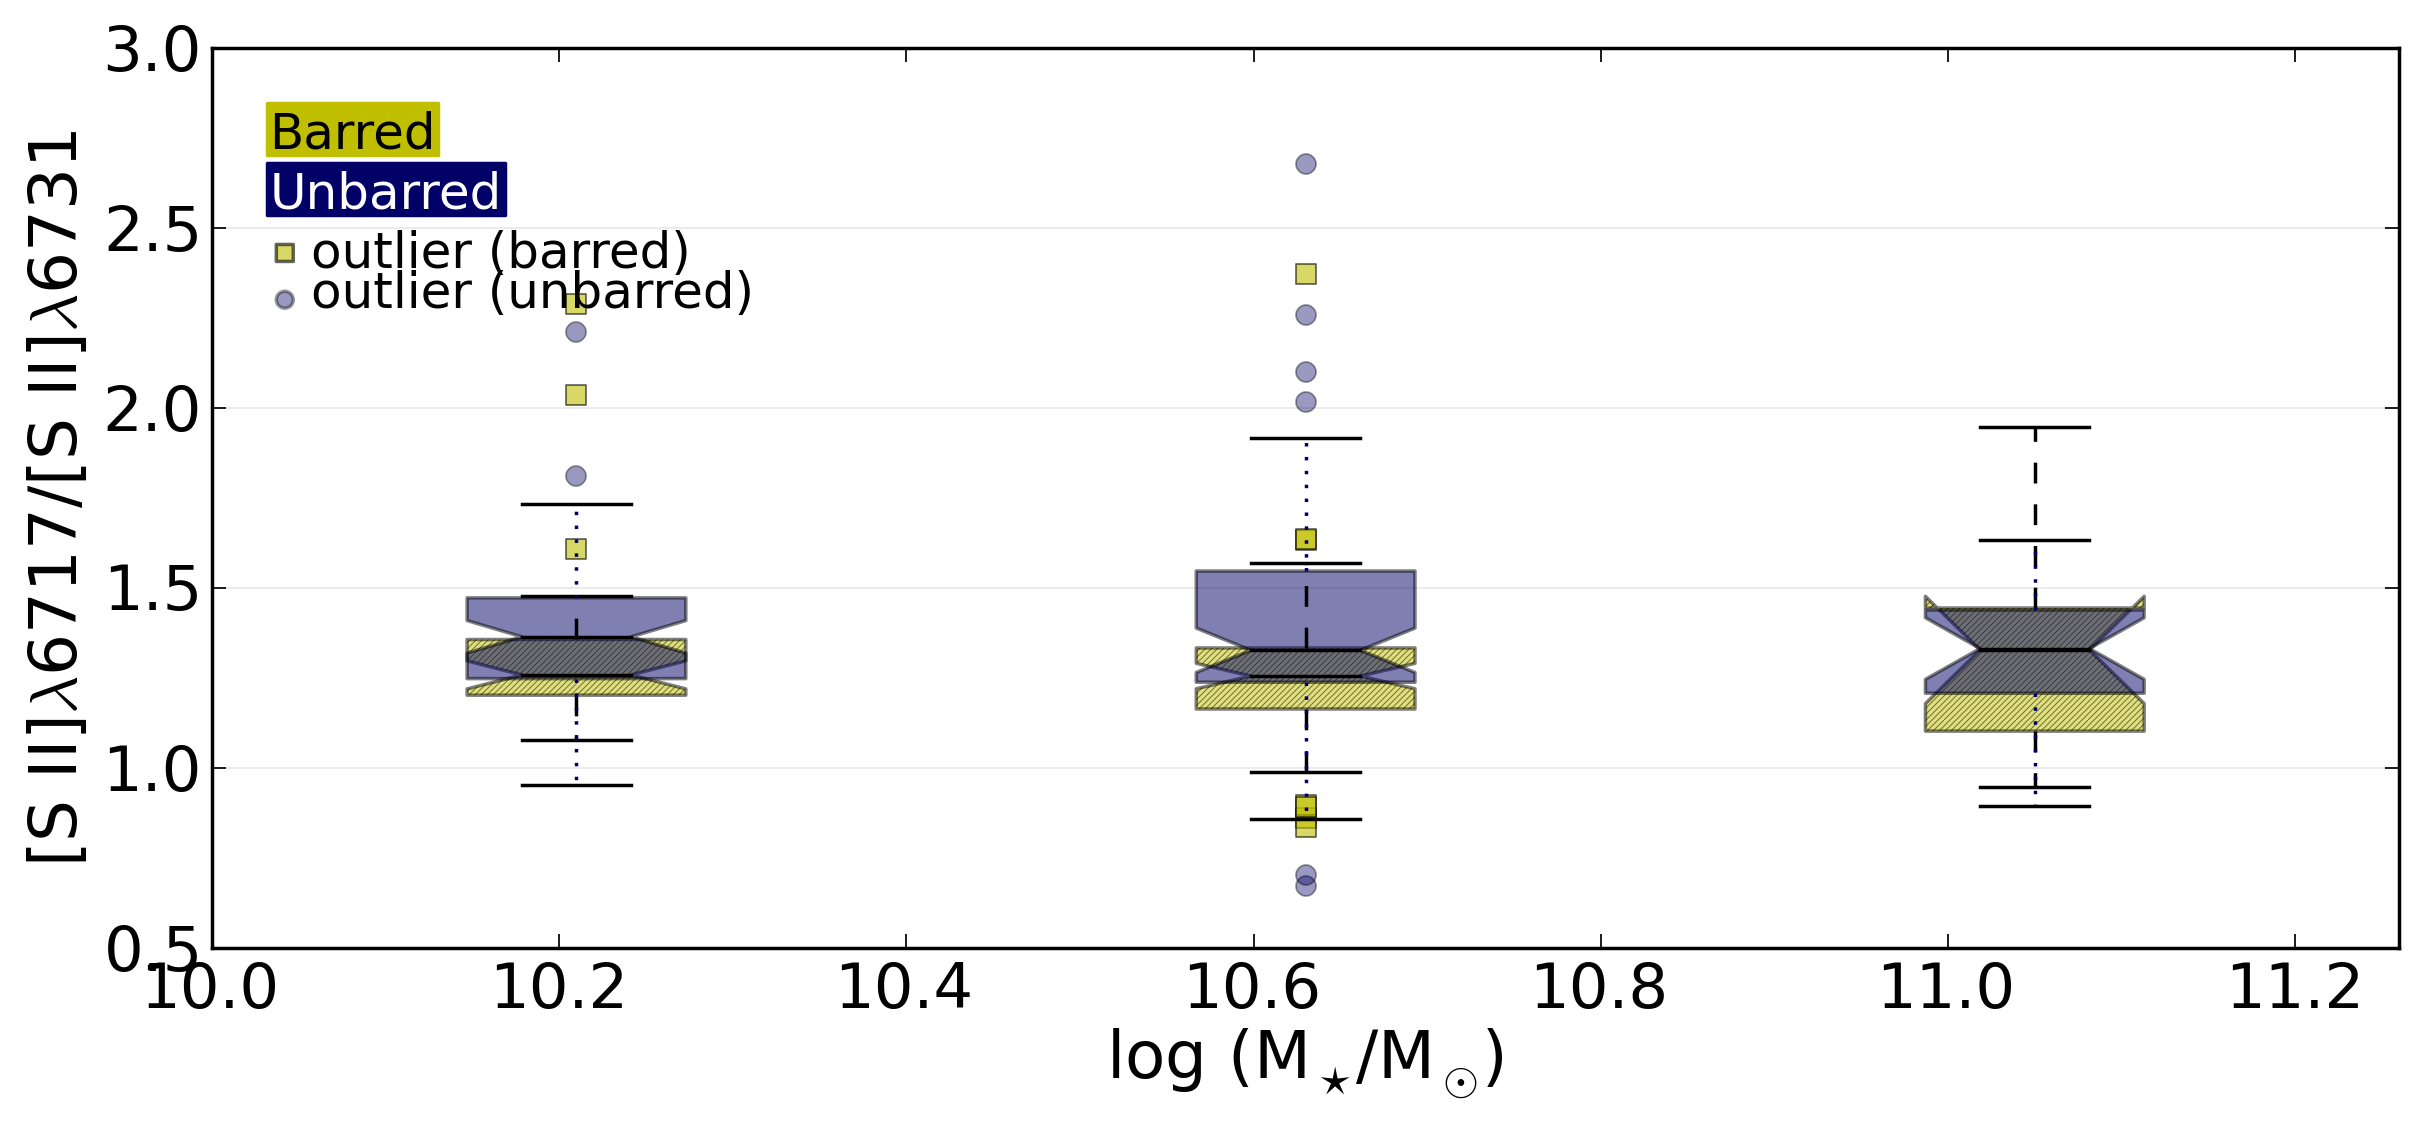
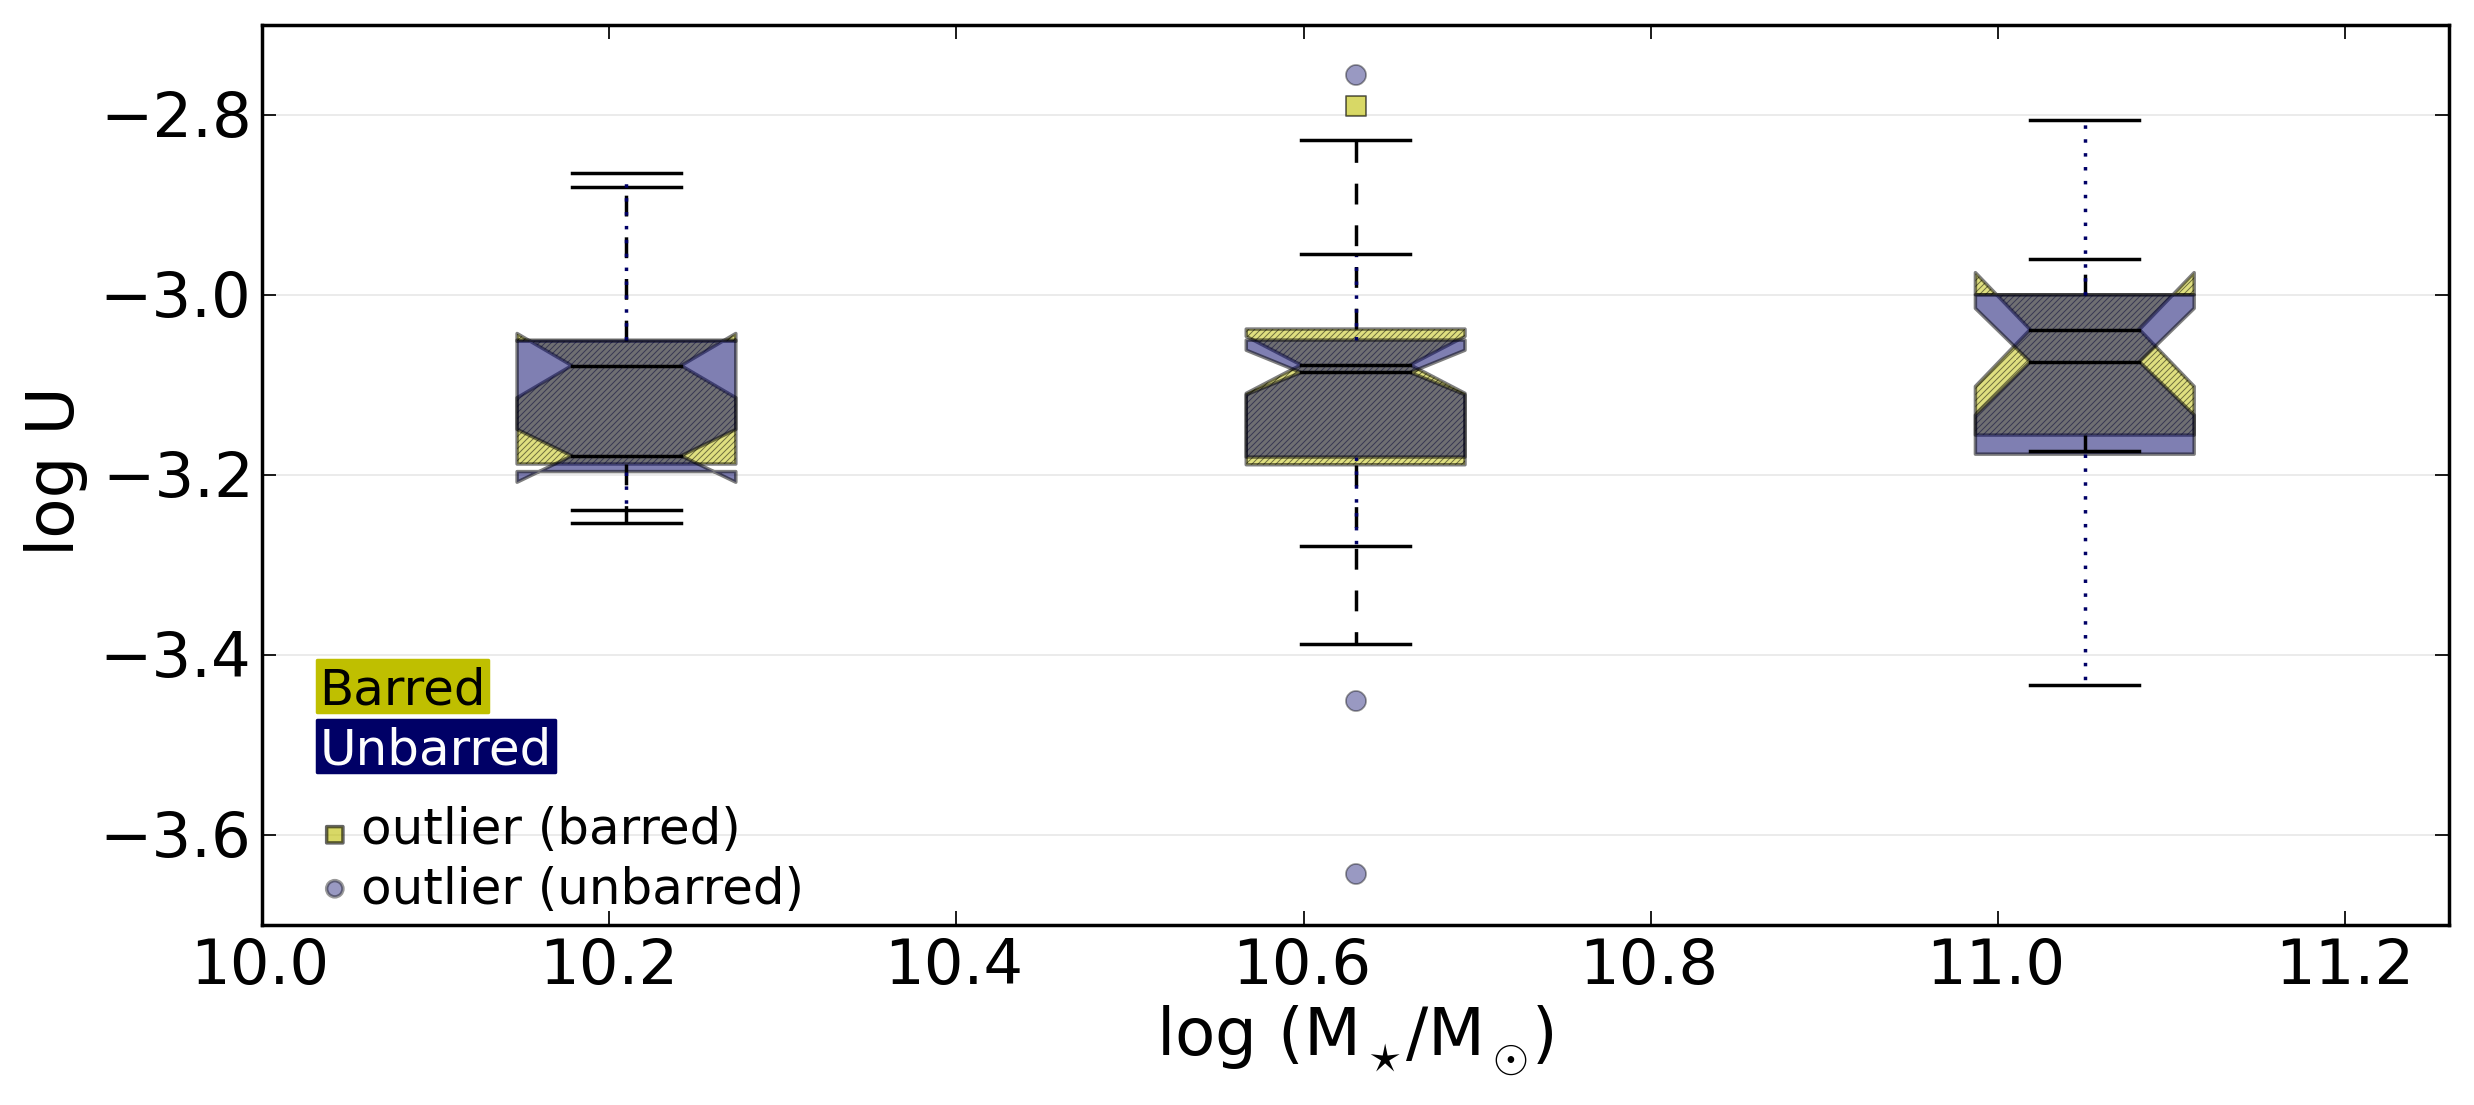
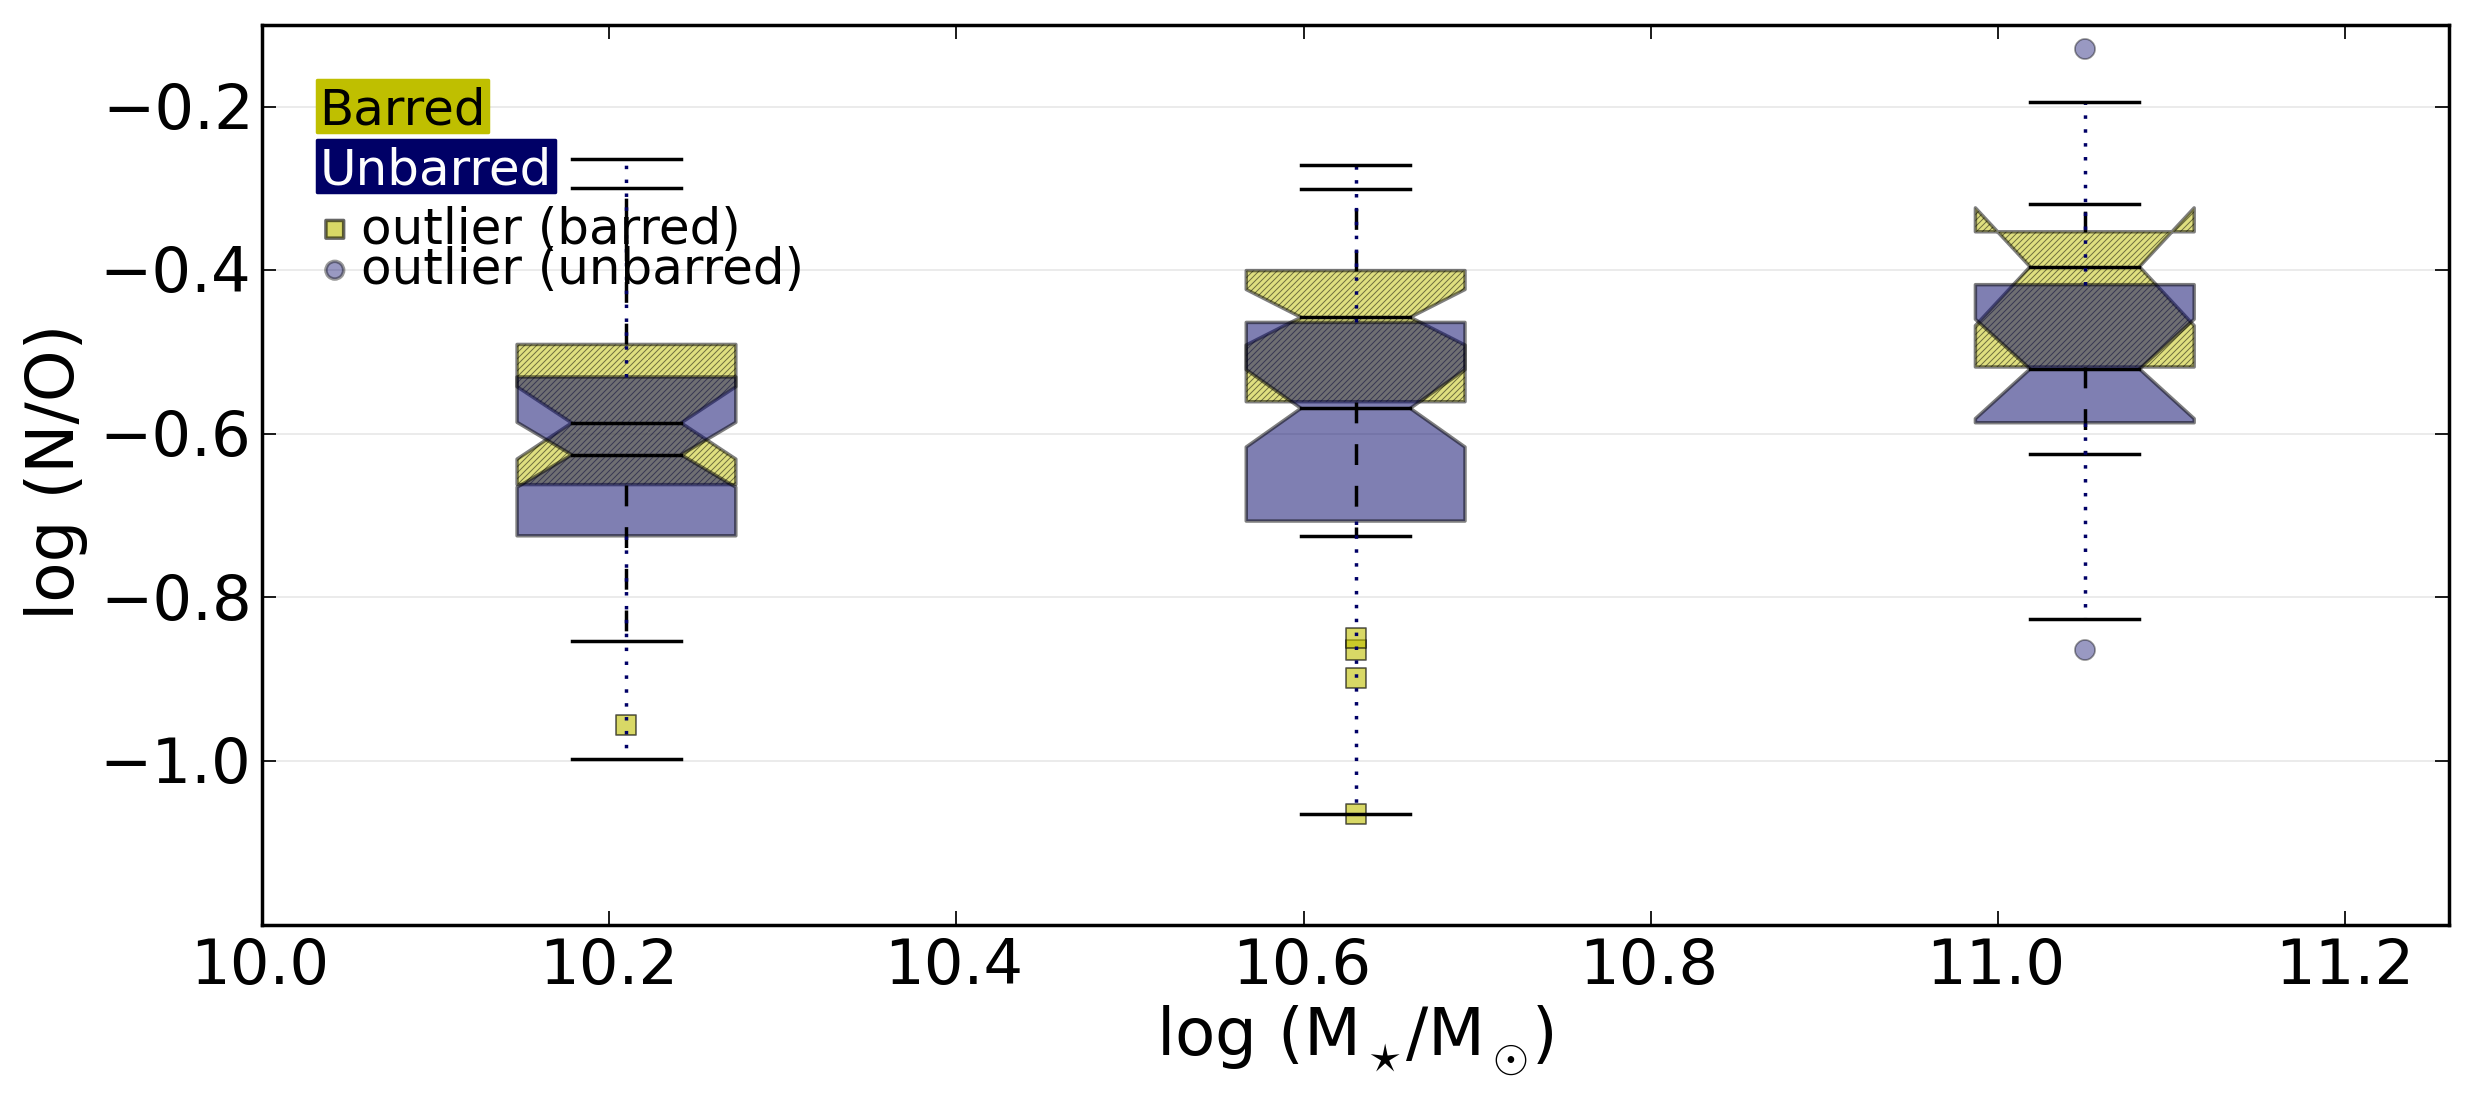
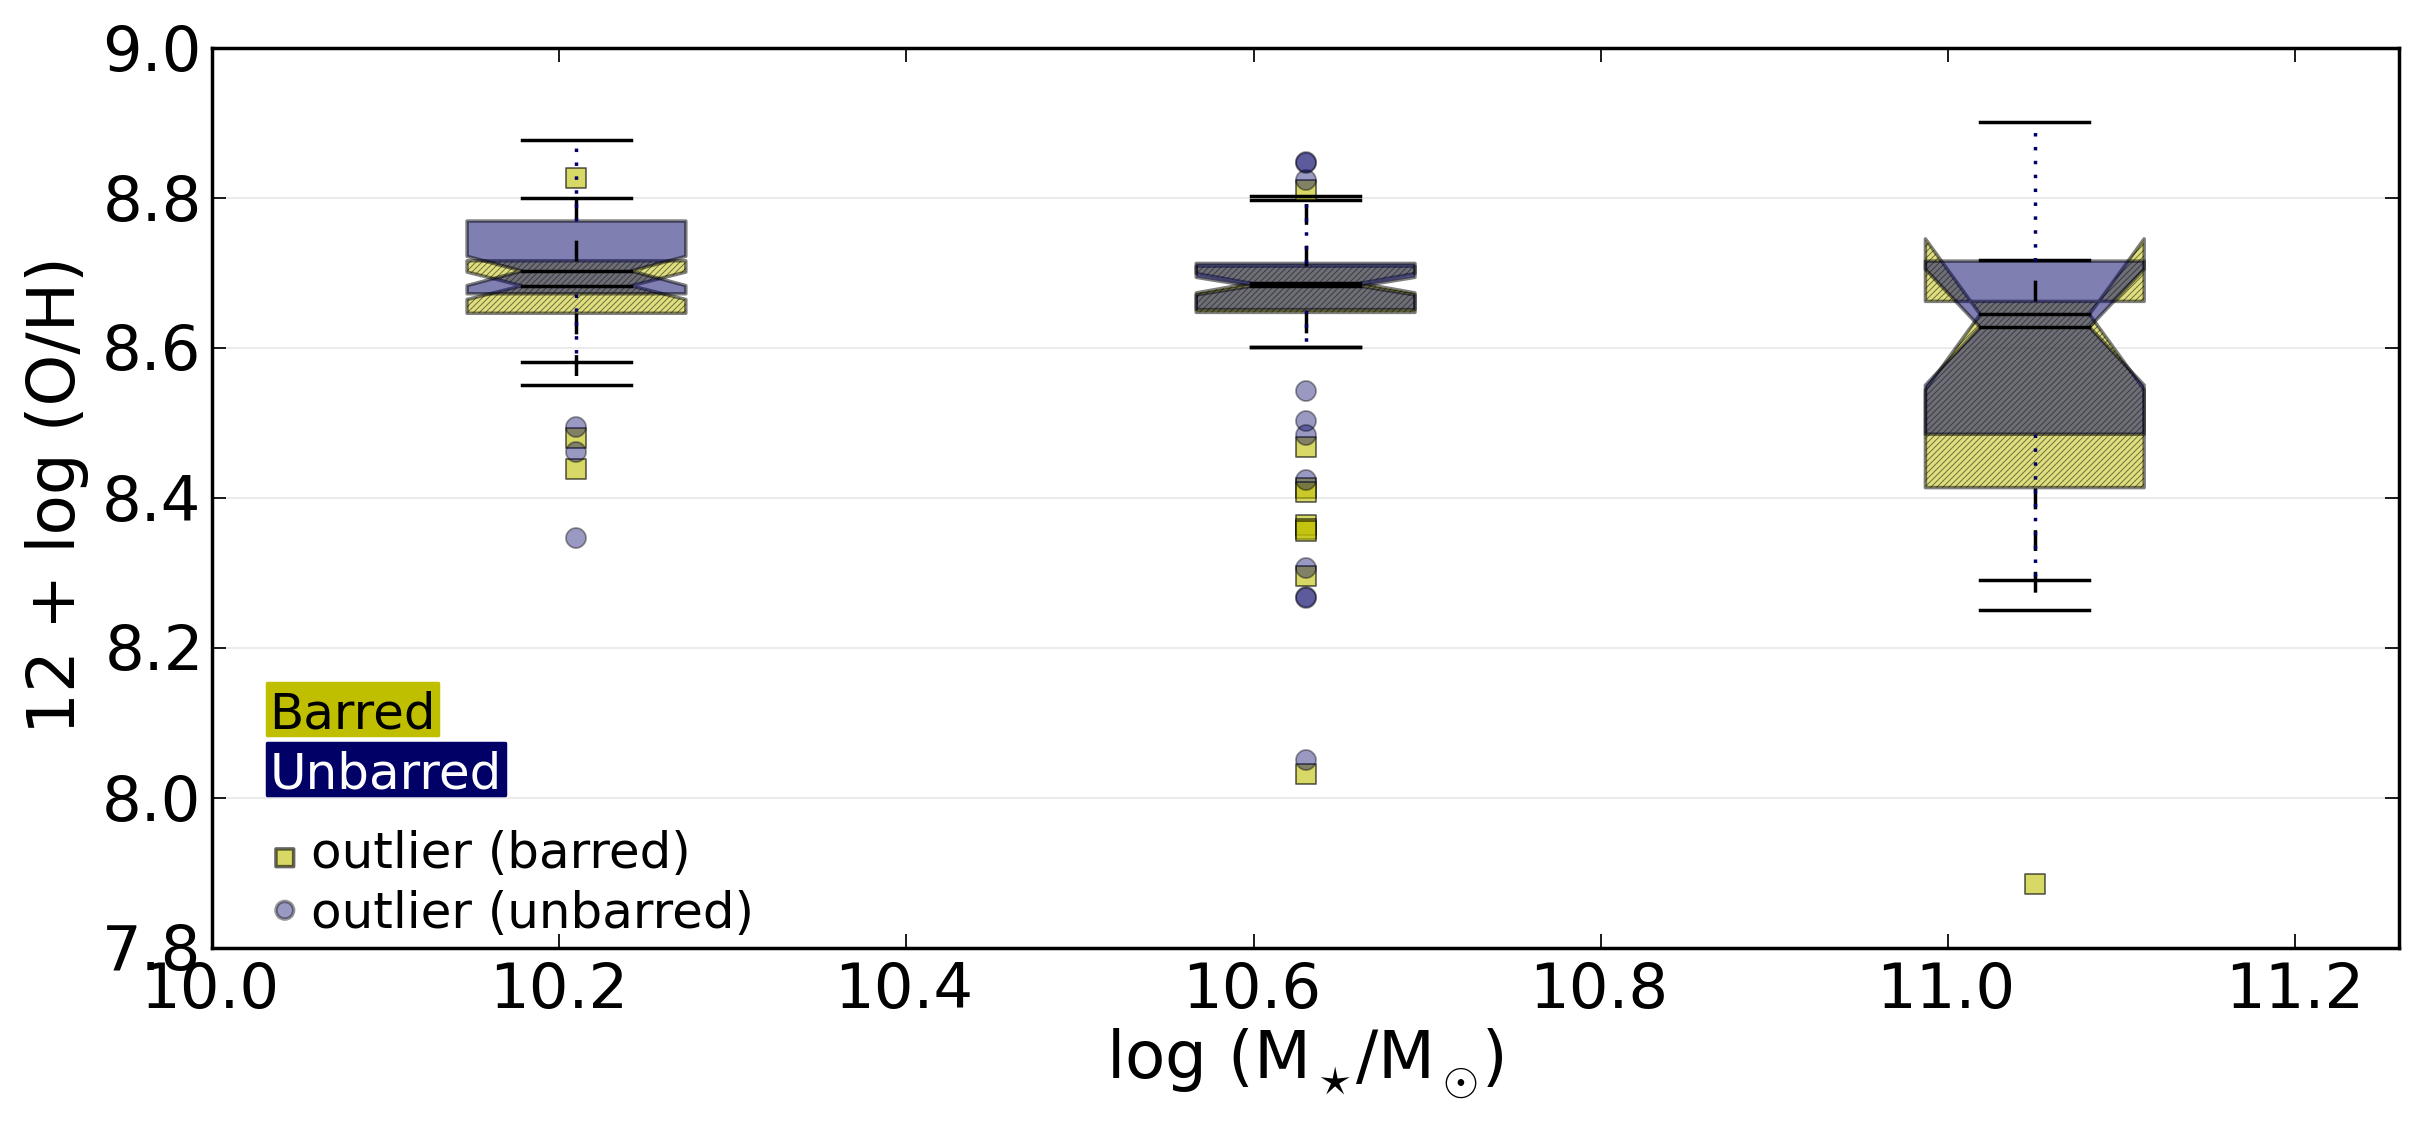
Fig. 16
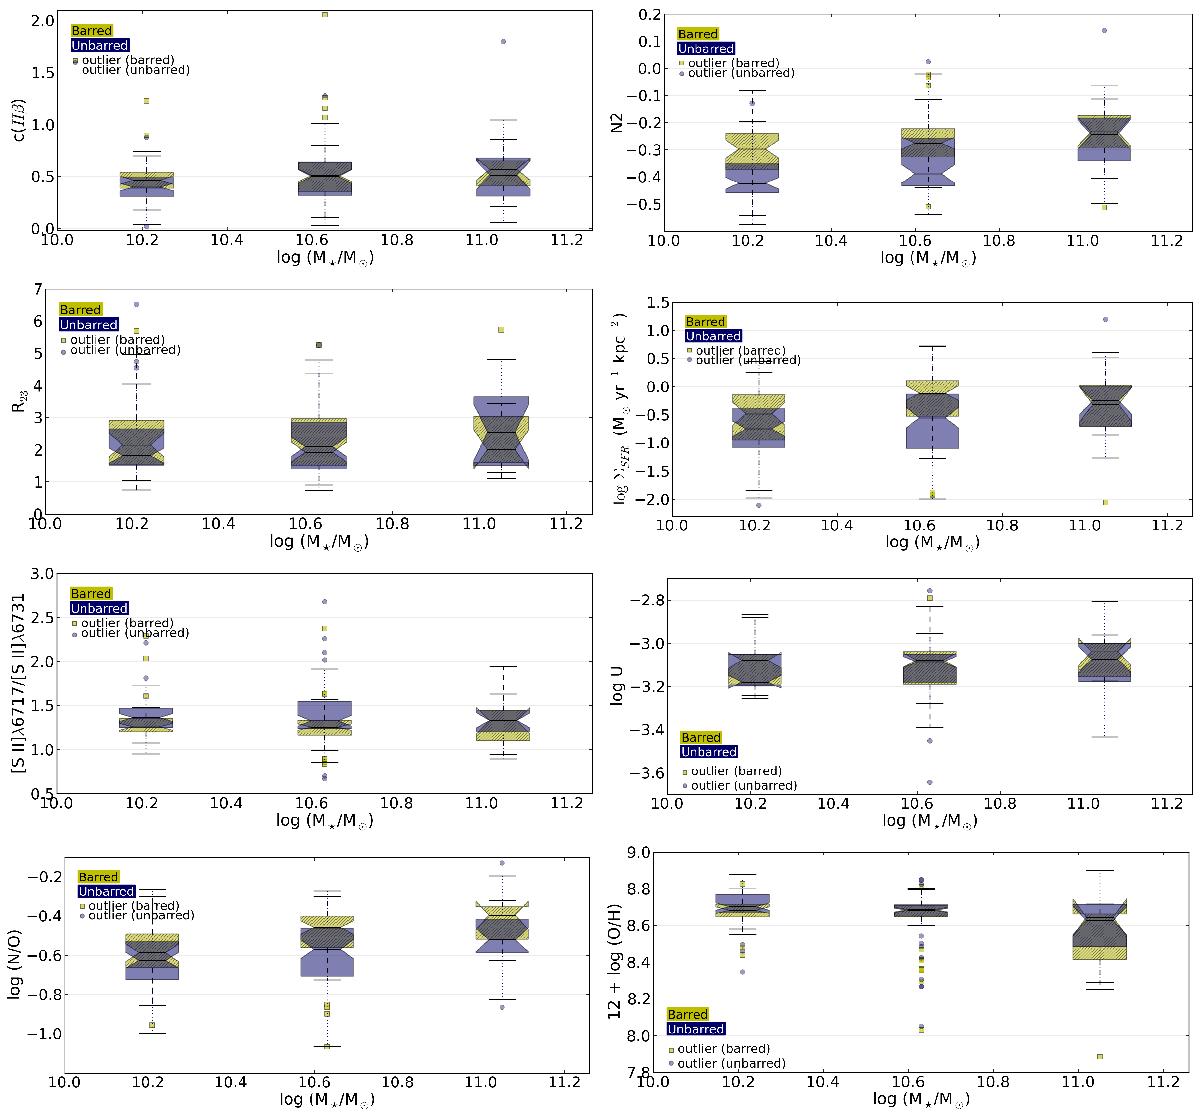
Boxplots showing the distribution in c(Hβ), N2 = log([N ii]6583/Hα), R23, SFR per unit area and [S ii]λ6717/[S ii]λ6731 line ratio, decimal logarithm of the ionisation parameter, N/O abundance ratio and oxygen abundance, as a function of the total galaxy stellar mass (M⋆) for barred (yellow boxes) and unbarred (purple) galaxies. Each box represents the data distribution for galaxies in a 0.42 dex interval of logarithm in stellar mass centred at the abscissa axis values of the box position. Inside each box, the central horizontal black straight line marks the median value. The lower and upper quartiles are represented by the outer edges of the boxes, i.e. the box length is equal to the inter-quartile range, and therefore the box encloses 50% of the data points. The notches mark the 95% confidence interval for the median value. The whiskers extend to the most extreme data point within 1.5 times the inter-quartile range. Galaxies that do not fall within the reach of the whiskers are considered as outliers (yellow and purple circles for barred and unbarred galaxies, respectively). The number of galaxies in each box, in order or increasing stellar mass, ranges from 35 to 39, 55 to 59, and 13 to 14 for barred galaxies, and from 57 to 64, 58 to 70, and 15 to 21, for unbarred galaxies.
Current usage metrics show cumulative count of Article Views (full-text article views including HTML views, PDF and ePub downloads, according to the available data) and Abstracts Views on Vision4Press platform.
Data correspond to usage on the plateform after 2015. The current usage metrics is available 48-96 hours after online publication and is updated daily on week days.
Initial download of the metrics may take a while.