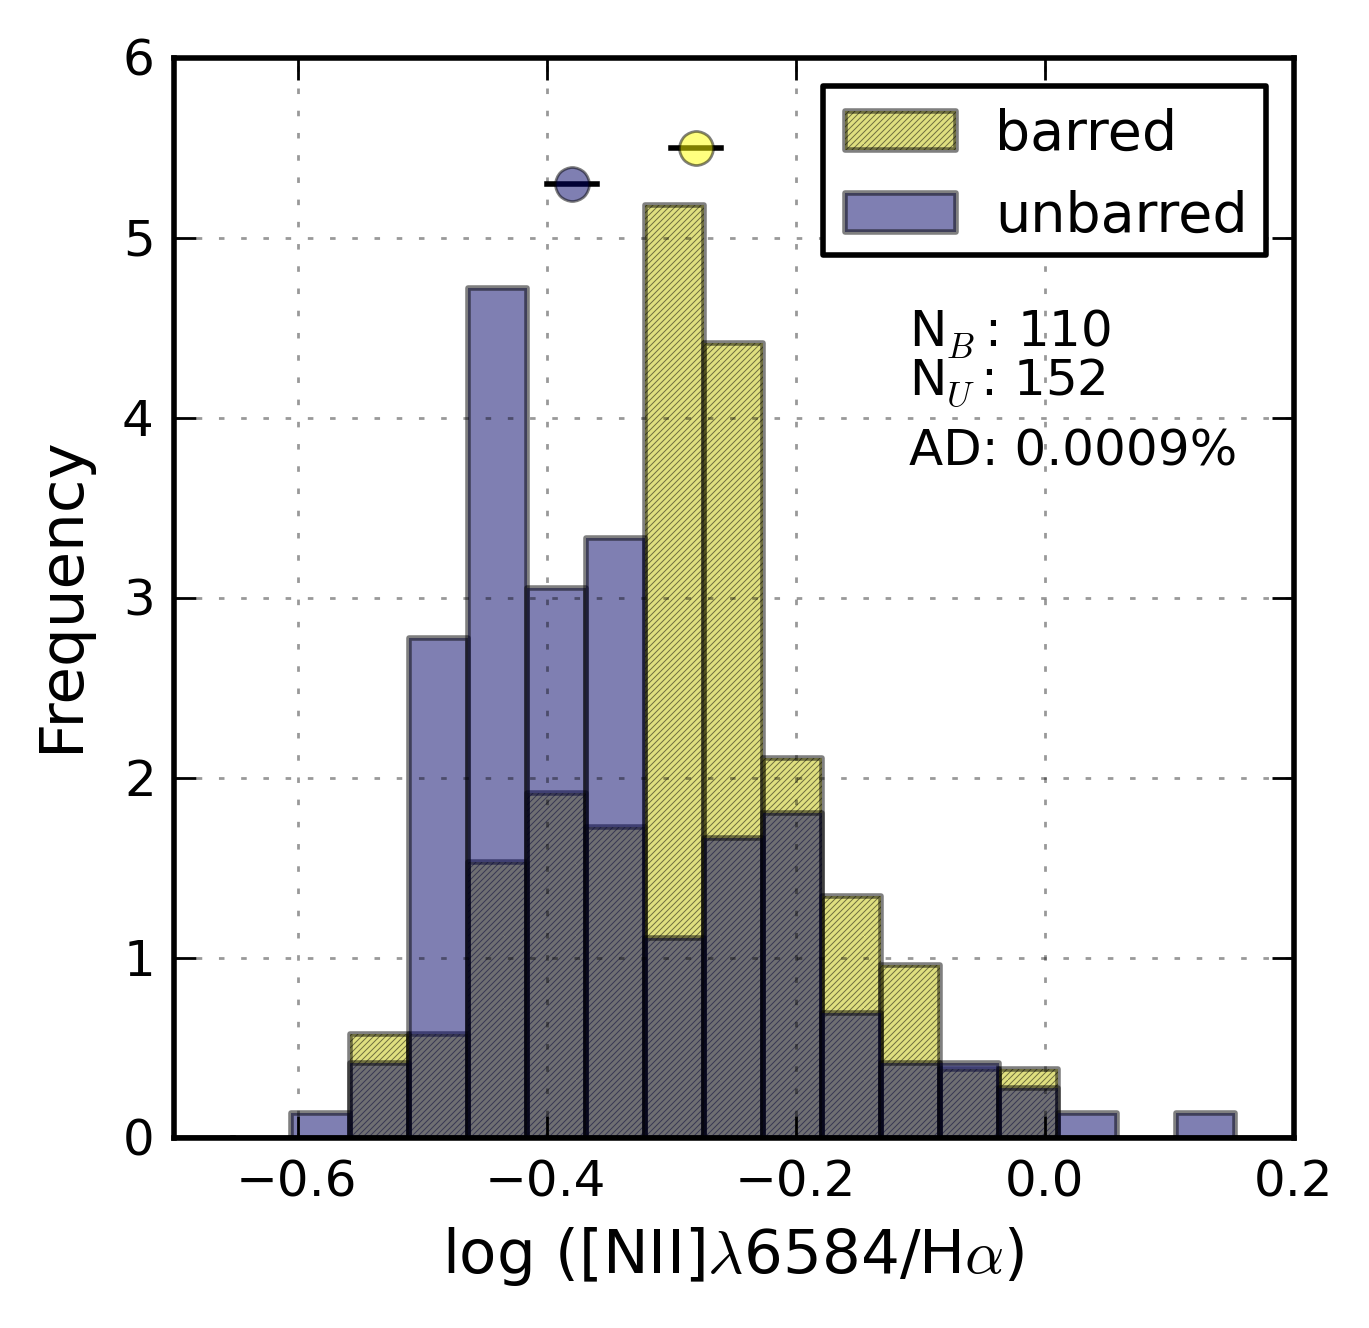
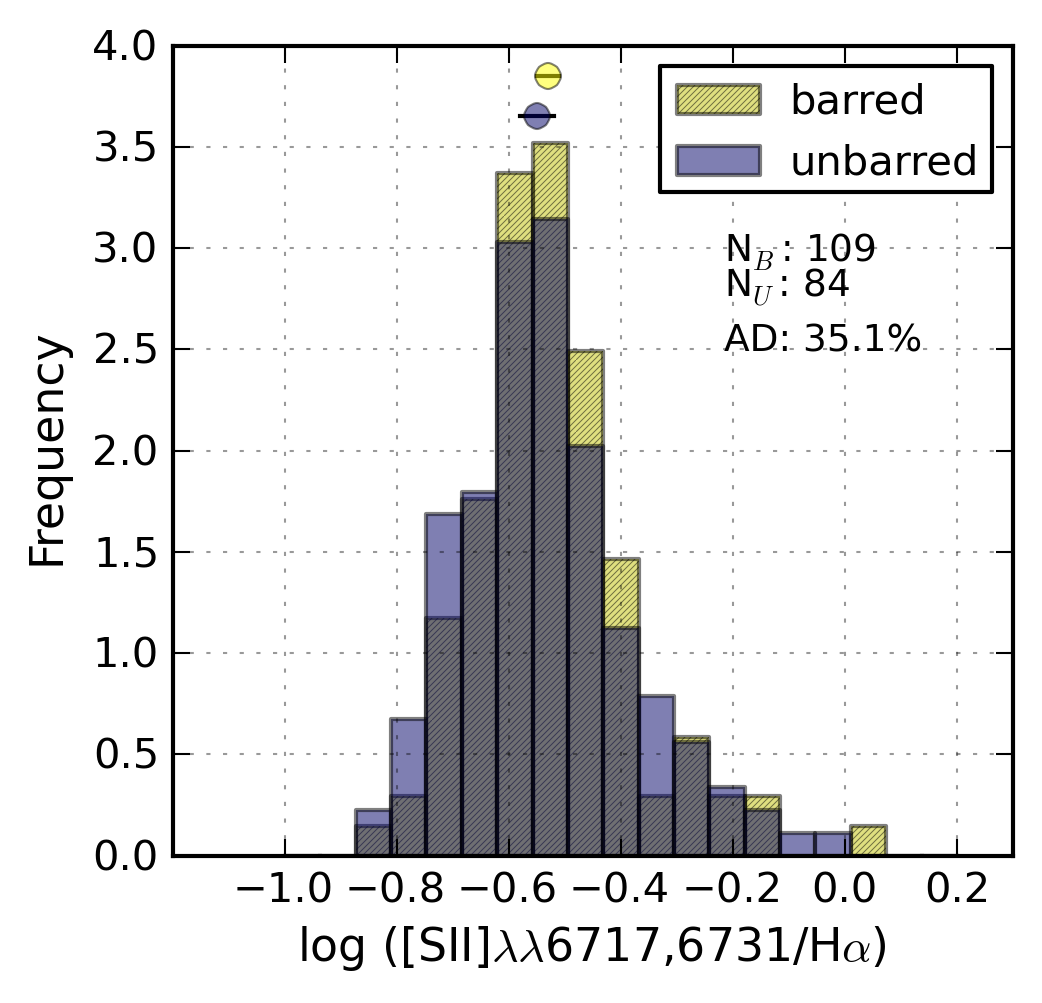
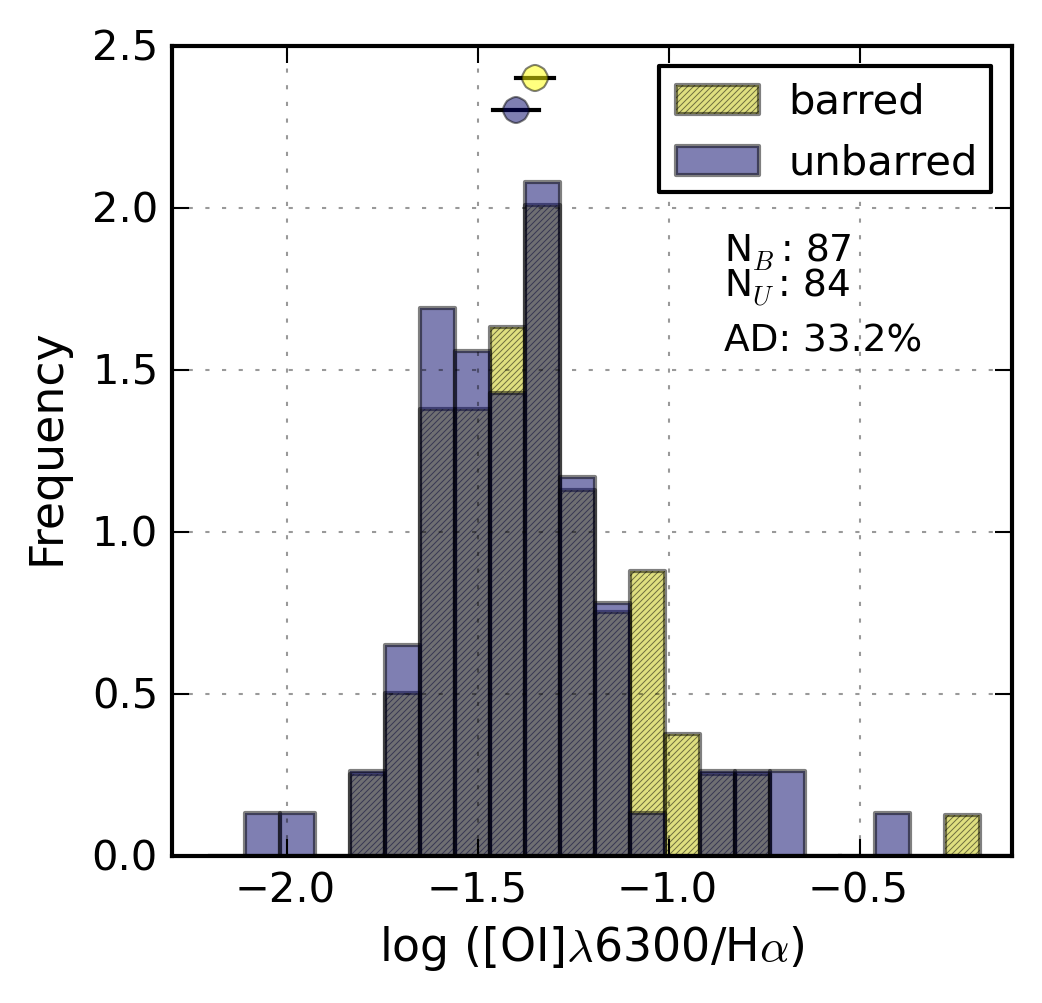
Fig. 19
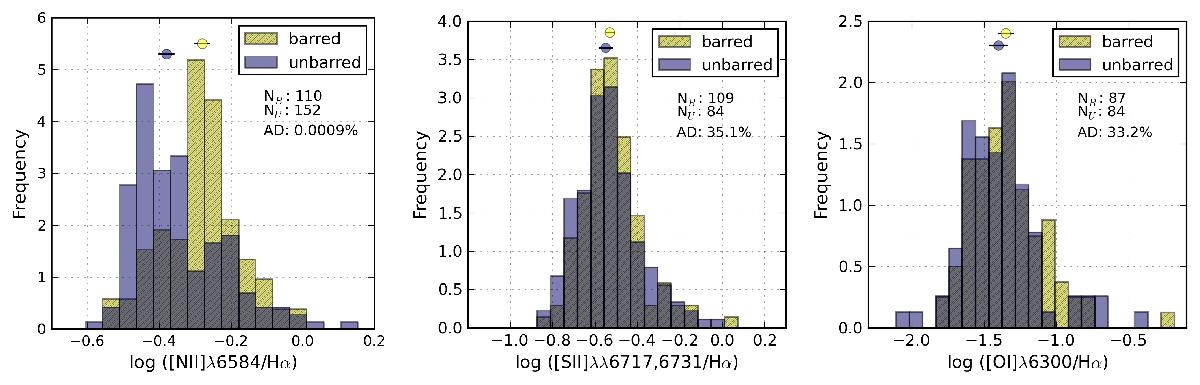
Histograms showing the distribution of AGN and shock-sensitive emission-line ratios (from left to right: [N ii]λ6583/Hα, [S ii]λλ6717, 6731/Hα, and [O i]λ6300/Hα) for barred and unbarred galaxies separately. All galaxies classified as non-AGN are included (see Sect. 4). The barred/unbarred distributions are only different for [N ii]λ6583/Hα, and therefore the source of the differences in that line ratio must originate from something other than shock ionisation and/or AGN contamination alone.
Current usage metrics show cumulative count of Article Views (full-text article views including HTML views, PDF and ePub downloads, according to the available data) and Abstracts Views on Vision4Press platform.
Data correspond to usage on the plateform after 2015. The current usage metrics is available 48-96 hours after online publication and is updated daily on week days.
Initial download of the metrics may take a while.