Fig. 4
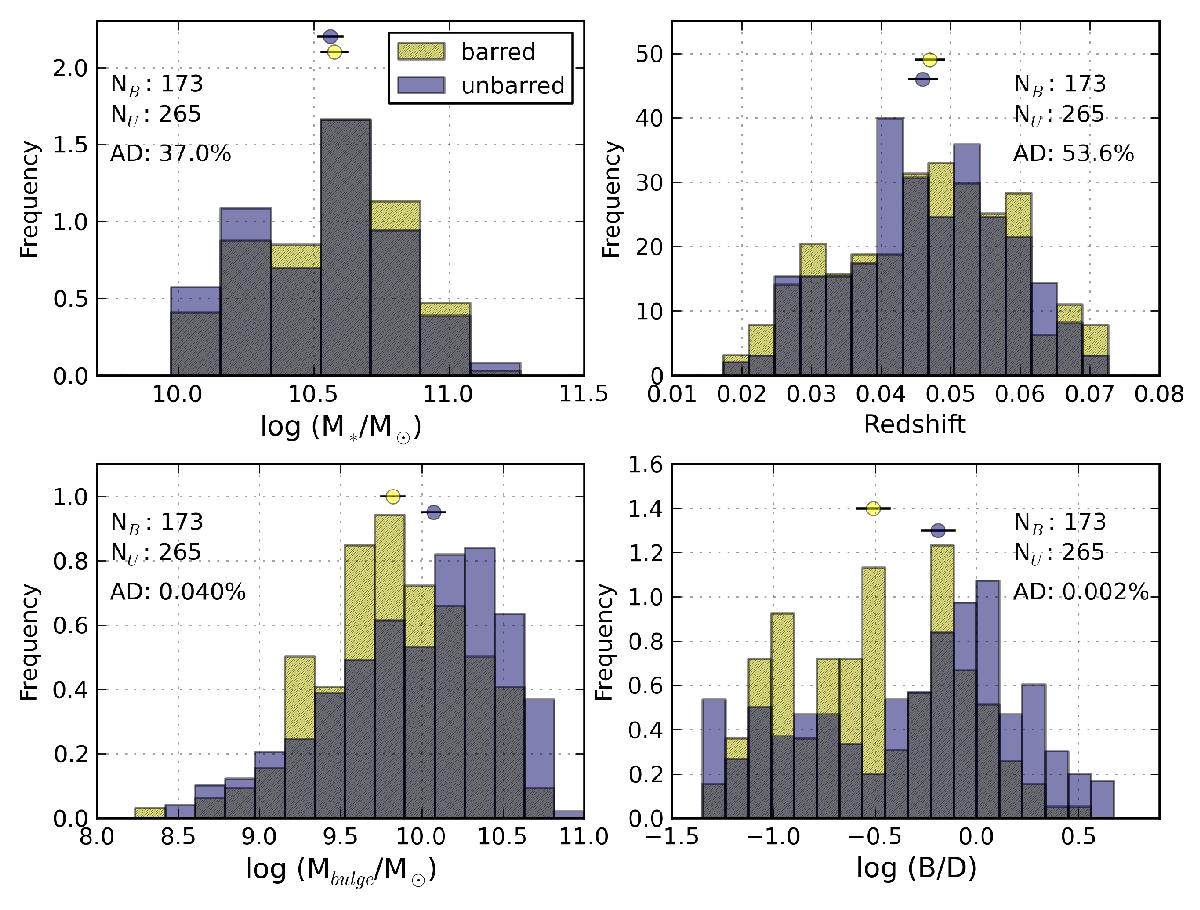
Histograms showing the distribution of decimal logarithm of the total galaxy stellar mass, redshift, logarithm of bulge mass and logarithm of the B/D light ratio in the i band for barred (hatched yellow) and unbarred (purple) galaxies separately, for all the non-active galaxies of the sample. The number of galaxies in each sub-sample (NB and NU) is indicated, together with the two-sample Anderson-Darling test P-values (AD, expressed in %). The yellow and purple circles in the upper side of the panels indicate the median value of the barred and unbarred distributions, respectively. The horizontal error bar covers the 95% confidence interval (estimated as ![]() , where IQR is the interquartile range, or 1st quartile subtracted from the 3rd quartile, and N the number of data points) for the corresponding median value.
, where IQR is the interquartile range, or 1st quartile subtracted from the 3rd quartile, and N the number of data points) for the corresponding median value.
Current usage metrics show cumulative count of Article Views (full-text article views including HTML views, PDF and ePub downloads, according to the available data) and Abstracts Views on Vision4Press platform.
Data correspond to usage on the plateform after 2015. The current usage metrics is available 48-96 hours after online publication and is updated daily on week days.
Initial download of the metrics may take a while.