Fig. 1
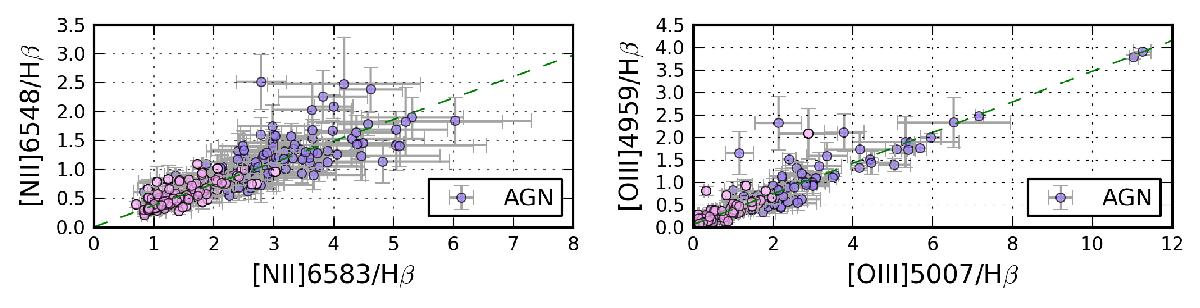
Comparison of the measured emission-line fluxes of the two lines in doublets [N ii]λλ6548, 6584 (left) and [O iii]λλ4959, 5007 (right) normalised to the Hβ emission-line flux. Purple points indicate galaxies classified as AGN (Sect. 4). The dashed green line shows the best linear fit to the data, which yields a slope of 0.37 ± 0.02 and 0.34 ± 0.01 for [N ii]λ6548/Hβ vs. [N ii]λ6584/Hβ, and [O iii]λ4959/Hβ vs. [O iii]λ5007/Hβ, respectively (see text in Sect. 3.2 for details).
Current usage metrics show cumulative count of Article Views (full-text article views including HTML views, PDF and ePub downloads, according to the available data) and Abstracts Views on Vision4Press platform.
Data correspond to usage on the plateform after 2015. The current usage metrics is available 48-96 hours after online publication and is updated daily on week days.
Initial download of the metrics may take a while.