| Issue |
A&A
Volume 583, November 2015
|
|
|---|---|---|
| Article Number | A135 | |
| Number of page(s) | 9 | |
| Section | Stellar atmospheres | |
| DOI | https://doi.org/10.1051/0004-6361/201526375 | |
| Published online | 05 November 2015 | |
The GAPS programme with HARPS-N at TNG
X. Differential abundances in the XO-2 planet-hosting binary⋆,⋆⋆
1 INAF–Osservatorio Astrofisico di Catania, via S. Sofia 78, 95123 Catania, Italy
e-mail: katia.biazzo@oact.inaf.it
2 INAF–Osservatorio Astronomico di Padova, Vicolo dell’Osservatorio 5, 35122 Padova, Italy
3 INAF–Osservatorio Astrofisico di Torino, via Osservatorio 20, 10025 Pino Torinese, Italy
4 Dipartimento di Fisica, Università di Torino, via P. Giuria 1, 10125 Torino, Italy
5 Landessternwarte Königstuhl, Zentrum für Astronomie der Universitat Heidelberg, Königstuhl 12, 69117 Heidelberg, Germany
6 INAF–Osservatorio Astronomico di Palermo, Piazza del Parlamento 1, 90134 Palermo, Italy
7 INAF–Osservatorio Astronomico di Brera, via E. Bianchi 46, 23807 Merate (LC), Italy
8 Fundación Galileo Galilei – INAF, Rambla José Ana Fernandez Pérez 7, 38712 Breña Baja, TF, Spain
9 INAF–Osservatorio Astronomico di Capodimonte, Salita Moiariello 16, 80131 Napoli, Italy
10 INAF–Osservatorio Astronomico di Trieste, via Tiepolo 11, 34143 Trieste, Italy
11 Dipartimento di Fisica e Astronomia Galileo Galilei – Università di Padova, Vicolo dell’Osservatorio 2, 35122 Padova, Italy
12 Instituto de Astrofísica e Ciências do Espaço, Universitade do Porto, CAUP, Rua das Estrelas, 4150-762 Porto, Portugal
13 Centro de Astrofísica, Universitade do Porto, Rua das Estrelas, 4150-762 Porto, Portugal
14 Departamento de Física e Astronomia, Facultade de Ciências, Univ. do Porto, Rua do Campo Alegre, s/n, 4169-007 Porto, Portugal
Received: 21 April 2015
Accepted: 24 August 2015
Binary stars hosting exoplanets are a unique laboratory where chemical tagging can be performed to measure the elemental abundances of both stellar components with high accuracy, with the aim to investigate the formation of planets and their subsequent evolution. Here, we present a high-precision differential abundance analysis of the XO-2 wide stellar binary based on high-resolution HARPS-N at TNG spectra. Both components are very similar K-dwarfs and host planets. Since they formed presumably within the same molecular cloud, we expect that they possess the same initial elemental abundances. We investigated whether planets can cause some chemical imprints in the stellar atmospheric abundances. We measure abundances of 25 elements for both stars with a range of condensation temperature TC = 40−1741 K, achieving typical precisions of ~0.07 dex. The northern component shows abundances in all elements higher by +0.067 ± 0.032 dex on average, with a mean difference of +0.078 dex for elements with TC > 800 K. The significance of the XO-2N abundance difference relative to XO-2S is at the 2σ level for almost all elements. We discuss that this result might be interpreted as the signature of the ingestion of material by XO-2N or depletion in XO-2S that is due to locking of heavy elements by the planetary companions. We estimate a mass of several tens of M⊕ in heavy elements. The difference in abundances between XO-2N and XO-2S shows a positive correlation with the condensation temperatures of the elements, with a slope of (4.7 ± 0.9) × 10-5 dex K-1, which could mean that both components have not formed terrestrial planets, but first experienced the accretion of rocky core interior to the subsequent giant planets.
Key words: planetary systems / stars: abundances / techniques: spectroscopic / stars: individual: XO-2N / stars: individual: XO-2S
Based on observations made with the Italian Telescopio Nazionale Galileo (TNG), operated on the island of La Palma by the INAF – Fundación Galileo Galilei at the Roche de los Muchachos Observatory of the Instituto de Astrofísica de Canarias (IAC) in the framework of the large programme Global Architecture of Planetary Systems (GAPS; P.I. A. Sozzetti).
Final reduced spectra (FITS) are only available at the CDS via anonymous ftp to cdsarc.u-strasbg.fr (130.79.128.5) or via http://cdsarc.u-strasbg.fr/viz-bin/qcat?J/A+A/583/A135
© ESO, 2015
1. Introduction
A well-established direct dependence exists between the occurrence rate of giant planets and the metal content of their main-sequence hosts (Gonzalez 1997; Butler et al. 2000; Laws et al. 2003; Santos et al. 2004; Fischer & Valenti 2005; Udry & Santos 2007; Sozzetti et al. 2009; Mortier et al. 2012). Two main scenarios have been invoked to explain the observational evidence. On the one hand, the enhanced likelihood of forming giant planets in higher metallicity disks can be seen as a direct consequence of the core-accretion scenario (Pollack et al. 1996; Ida & Lin 2004; Alibert et al. 2005) because the expected larger reservoirs of dust grains in more metal-rich environments (e.g., Pei & Fall 1995; Draine et al. 2007) will favor the build-up of cores that will later accrete gas. In this case, the observed giant planet – metallicity connection has a primordial origin. On the other hand, it is possible that the outcome of the planet formation process might directly affect the chemical composition of the host stars. Two different versions of this second scenario have been proposed. In the first one, disk-planet or planet-planet interactions may cause the infall of metal-rich (rocky) material onto the star (Gonzalez 1997). In this case, the presence of planets is expected to positively correlate with metallicity. A similar effect is thought to be in action in the solar system (Murray et al. 2001), where the total mass of rocky material accreted by the Sun after the shrinking of its convective zone (~ 0.4M⊕) might be too low to cause an appreciable variation of its chemical composition, however. Alternatively, the formation of planetary cores may prevent rocky planetary material to be accreted by the star (Meléndez et al. 2009). In this case, the presence of planets should negatively correlate with metallicity, in the sense that depletion of refractory elements relative to volatiles should be observed. Some evidence that this might be the case for the Sun has been presented by Meléndez et al. (2009). Chambers (2010) estimated that the deficiency of refractory elements found by these authors would be canceled if ~ 4 M⊕ of rocky material were added to the present-day solar convective envelope. Meléndez et al. (2009) also concluded that solar twins without close-in giant planets chemically resemble the Sun, suggesting that the presence of such planets might prevent the formation of Earth-sized planets. Of course, all these (and more) mechanisms might be at work, rendering the discernment of their relative roles a rather complex undertaking (see, e.g., González Hernández et al. 2013; Adibekyan et al. 2014; Maldonado et al. 2015).
While accretion of planetary material may cause huge effects in white dwarfs (e.g., Zuckerman et al. 2003), variations of surface abundances are not expected to be large in FGK main-sequence stars due to the dilution of the material within the outer convective envelope (Murray et al. 2001). In general, the most prominent effect is probably an over- or underabundance of elements as a function of the grain condensation temperature (TC), which is different for different elements (Smith et al. 2001). Various authors have tried to show that such anomalies may be present in stars with planets (see, e.g., Smith et al. 2001; Laws & Gonzalez 2001; Meléndez et al. 2009; Ramírez et al. 2010; Maldonado et al. 2015). Revealing these trends requires developing rather ingenious techniques of very accurate differential abundance analyses (e.g., Ramírez et al. 2014). In spite of these efforts, the results, if any, are still quite elusive. Obtaining accurate differential abundances is easier for members of stellar clusters (e.g., Yong et al. 2013) and binary systems (Gratton et al. 2001; Laws & Gonzalez 2001; Desidera et al. 2004, 2006; Ramírez et al. 2011; Liu et al. 2014) because here many observational uncertainties related to distances and reddening can be considered common-mode effects. In addition, the most accurate results are obtained from comparing stars that are very similar to each other (Gratton et al. 2001; Desidera et al. 2004; Liu et al. 2014). At the same time, it is also crucial that such stellar samples are accurately scrutinized to determine whether planets exist around them.
XO-2 is a wide visual binary (separation ~ 31 arcsec, corresponding to a projected distance of ~ 4600 AU; Burke et al. 2007) composed of two unevolved stars of very similar masses (~ 0.97 M⊙; Damasso et al. 2015) that have the same proper motions (LSPM J0748+5013N and LSPM J0748+5013S in Lepine & Shara 2005). Neither star has detectable amounts of lithium, supporting the old age of the system (Desidera et al. 2014; Damasso et al. 20151). A transiting giant planet was discovered around XO-2N by Burke et al. (2007), with a period P = 2.616 d, a mass Mp = 0.597 MJ, and a semi-major axis a = 0.037 AU. Recently, XO-2S was also shown to host a planetary system composed of at least two planets (Mp sini = 0.259 MJ, P = 18.157 d, a = 0.134 AU and Mp sini = 1.370 MJ, P = 120.80 d, a = 0.476 AU; Desidera et al. 2014, hereafter Paper I). In a subsequent characterization of the XO-2 system, a long-term curvature in the radial velocity (RV) measurements of XO-2N was established, suggesting a possible second planet on a much wider orbit with P ≥ 17 yr (Damasso et al. 2015, hereafter Paper II). The reason for the difference in the architectures of the planetary systems around the two stars is currently unclear.
An accurate differential analysis of the iron content in the two components of XO-2 revealed a small but clearly significant difference of 0.054 ± 0.013 dex, XO-2N being more iron-rich than XO-2S (Paper II). This is a rare occurrence among binary systems, as in most cases the two components have very similar metal abundances (Desidera et al. 2004, 2006). This result seems to be in contrast with the work by Teske et al. (2013), who found the two stars to be similar in physical properties and in iron and nickel abundances, with some evidence of enrichment in C and O abundance of XO-2N compared to XO-2S. Very recently, Teske et al. (2015) explored the effects of changing the relative stellar temperature and gravity on the elemental abundances. Using three sets of parameters, they found that some refractory elements (Fe, Si, and Ni) are most probably enhanced in XO-2N regardless of the chosen parameters2. Therefore, in the XO-2 system, similar to other binary systems hosting planets, the results are still ambiguous. In fact, there is still no consensus on the differences between 16 Cyg A and B (Laws & Gonzalez 2001; Takeda 2005; Schuler et al. 2011a; Ramírez et al. 2011; Metcalfe et al. 2012; Tucci Maia et al. 2014, and references therein), while no significant abundance differences between components in the single-host systems HAT-P-1 (Liu et al. 2014), HD 132563 (Desidera et al. 2011), HD 106515 (Desidera et al. 2012) and the dual-host HD 20782/1 system (Mack et al. 20143) were found.
The XO-2 binary system is of particular interest. Being composed of two bright, near-twin stars with well-characterized planetary systems around them, it is one of only four known dual-planet-hosting binaries, together with HD 20782/1 (Jones et al. 2006), Kepler 132 (Rowe et al. 2014), and WASP 94 (Neveu-Vanmalle et al. 2014). As we have mentioned above, planet-hosting binaries provide useful laboratories to try to distinguish the effects of the stellar system initial abundances that are due to the star-forming cloud from the possible effects of the planetary system on the star chemical composition. It is therefore important to perform a more extensive abundance analysis of the XO-2 system, not only to confirm the abundance difference we found for iron between the two components, but also to establish if there is any correlation of the abundance differences with the condensation temperatures or other quantities.
As a follow-up of Papers I and II and within the context of the Global Architecture of Planetary Systems (GAPS4; Covino et al. 2013) program, we present an accurate differential abundance analysis of 25 elements for the two components of the XO-2 system (XO-2N and XO-2S). The procedure described in Paper II allows us to derive the differences in elemental abundances (and stellar parameters) with very high accuracy and unveil small differences among the components, removing several sources of systematic errors.
The outline of this paper is as follows. We first briefly present the spectroscopic dataset in Sect. 2. In Sect. 3, we describe the differential analysis of the elemental abundances for 25 species. We then discuss the behavior of the elemental abundance differences with the condensation temperature (Sect. 4) and the origin of these differences (Sect. 5). In Sect. 6 our conclusions are presented.
2. Observations
We observed both XO-2 components with the high-resolution spectrograph HARPS-N at Telescopio Nazionale Galileo (TNG) (R ~ 115 000, λ ~ 3900−6900 Å; Cosentino et al. 2012) between November 20, 2012 and October 4, 2014. Solar spectra were also obtained through observations of the asteroid Vesta. The spectra were reduced using the 2013 November version of the HARPS-N instrument data reduction software (DRS) pipeline. A detailed description of the observations and data reduction is reported in Paper II.
As in Paper II, we measured the elemental abundances by co-adding the spectra of the two components and Vesta, properly shifted by the corresponding radial velocity, to produce merged spectra with signal-to-noise ratios (S/N) of about 300 (for the targets) and 400 (for the asteroid) per pixel at λ ~ 6000 Å.
3. Spectral analysis
3.1. Differential elemental abundances
Elemental abundances5 were measured using the differential spectral analysis described in Paper II, which is based on the prescriptions reported in detail by Gratton et al. (2001) and Desidera et al. (2004, 2006). In particular, this method gives very accurate results when the binary components are very similar in stellar parameters, as is the case of the XO-2 system. We thus considered an analysis based on equivalent widths (EWs), where a strict line-by-line method was applied, for the two stars and the solar spectrum. Then, XO-2S was analyzed differentially with respect to the N component, which was used as a reference star. This allowed us to obtain the differences in stellar parameters and elemental abundances between XO-2N and XO-2S. This approach minimizes errors that are due to uncertainties in measurements of EWs, atomic parameters, solar parameters, and model atmospheres. Moreover, because the two components of this binary system are very similar to each other, this reduces the possibility of systematic errors (Desidera et al. 2006).
We considered as stellar parameters (effective temperature Teff, surface gravity log g, microturbulence ξ) and iron abundances ([Fe/H]), together with their uncertainties, those reported in our Paper II, where Kurucz (1993) grids of plane-parallel model atmospheres were used. We refer to that work and Biazzo et al. (2012) for a detailed description of the method with which we measured abundances (and their uncertainties). After fixing stellar parameters and iron abundance, we computed elemental abundances of several refractories, siderophiles, silicates, and volatile elements (according to their cosmochemical character; see, e.g., Fig. 4 of Anders & Grevesse 1989) using the MOOG code (Sneden 1973, version 2014) and the abfind and blends drivers for the treatment of the lines without and with hyperfine structure (HFS), respectively. From this we obtained the abundance of 25 elements: C, N, O, Na, Mg, Al, Si, S, Ca, Sc, Ti, V, Cr, Mn, Fe, Co, Ni, Cu, Zn, Y, Zr, Ba, La, Nd, and Eu. For three elements (Ti, Cr, and Fe) we measured two ionization states, while for the other elements only one species (first or second ionization state) was measured. As in Paper II for the iron lines, here the EWs of each spectral line were measured interactively on the one-dimensional spectra using the splot task in IRAF6. The location of the local continuum was carefully selected by tracing as best possible the same position for each spectral line of the two binary system components and the asteroid Vesta. The aim was to minimize the error in the selection of the continuum. We also excluded features that were affected by telluric absorption.
We compiled a long list of spectral lines from the literature, starting with Biazzo et al. (2012). In particular, our line list comprises Na i, Mg i, Al i, Si i, Ca i, Ti i, Ti ii, Cr i, Cr ii, Fe i, Fe ii, Ni i, and Zn i, complemented with additional lines and atomic parameters for Na i, Al i, Si i, Ti i, Ti ii, Cr i, Ni i, and Zn i taken from Schuler et al. (2011b) and Sozzetti et al. (2006) to increase the statistics. In seven cases (C i, S i, Sc ii, V i, Mn i, Co i, and Cu i), we considered the line lists by Kurucz (1993), Schuler et al. (2011b), Johnson et al. (2006), and Scott et al. (2015b), where the HFS by Johnson et al. (2006) and Kurucz (1993) was adopted for Sc, V, Mn, Cu, and Co. Solar isotopic ratios by Anders & Grevesse (1989) were considered for Cu (i.e., 69.17% for 63Cu and 30.83% for 65Cu). For the s-process elements Y ii, Zr ii (first peak) and Ba ii, La ii (second peak), and the r-process elements Nd ii and Eu ii we considered the line lists by Johnson et al. (2006), Ljung et al. (2006), Prochaska et al. (2000), Lawler et al. (2001b), and Den Hartog et al. (2003), where the HFS by Gallagher et al. (2010) and Lawler et al. (2001a) was adopted for Ba and La, respectively. Solar isotopic ratios by Anders & Grevesse (1989) were considered for Ba (i.e., 2.417% for 134Ba, 7.854% for 136Ba, 71.70% for 138Ba, and 6.592% for 135Ba, 11.23% for 137Ba) and Eu (i.e., 47.8% for 151Eu and 52.2% for 153Eu).
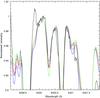 |
Fig. 1 Comparison between observed (black line) and synthetic spectra for XO-2S in the region around the [O i] line at 6300.3 Å. The synthetic spectra have been computed for log n(O) = 9.15 (blue line), 9.20 (red line), and 9.25 (green line), respectively. We note that several CN lines are also present in this spectral region; as a result of the coupling between C and O, the strength of these features is anticorrelated with that of O. |
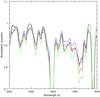 |
Fig. 2 Comparison between observed (black line) and synthetic spectra for XO-2S in the region around the bandhead of C2 at 5635 Å. The synthetic spectra have been computed for log n(C) = 8.83 (blue line), 8.88 (red line), and 8.93 (green line), respectively. |
CNO abundances were measured as follows. First, O was measured by using the synth driver within the MOOG code (Sneden 1973, version 2014) fitting synthetic spectra to the zone around the [O i] line at 6300.3 Å (see Fig. 1). Then adopting the estimated O abundance, C was measured from features generated by the C2 Swan system at 5150 ((0, 0) band) and 5635 Å ((0, 1) band: see Fig. 2). Finally, N was measured from several CN features at ~4195 and ~4215 Å, adopting the measured C and O abundances. The process was repeated for the stars and for the Vesta spectrum until convergence of the derived values. We note that the procedure was strictly differential, using the same features in each of the stars. Line lists were built using the latest version of the VALD database7 for the atomic lines, while the line lists for CN are taken from Sneden et al. (2014) and those for C2 are taken from Ram et al. (2014) and Brooke et al. (2013). Carbon abundances were also derived from atomic C i. Since the C abundance was derived with both EWs and spectral synthesis, as final abundance we considered the mean value coming from these two methods.
Table 1 lists the solar elemental abundances we obtained using spectra of the Vesta asteroid and the following solar parameters: Teff ⊙ = 5770 K, log g⊙ = 4.44, and ξ⊙ = 1.10 km s-1 (see, e.g., Biazzo et al. 2012). In the same table, the most recent determinations of solar abundances by Asplund et al. (2009), Scott et al. (2015a,b), and Grevesse et al. (2015) are also given. We stress that the latter values were obtained using 3D+NLTE models. Our determinations therefore agree well with these recent literature values.
Comparison between our measured solar abundances and standard values from the literature.
In Table 2 we present the final elemental abundances (relative to the solar ones) and the differential abundances (N−S) of all elements, together with their respective errors. The estimate of the uncertainties on each elemental abundance and on differential [X/H] was done as described in detail in Paper II (see also references therein). Table 3 lists the mean internal errors in abundance determination that are due to uncertainties in stellar parameters for the two components, where the stellar parameters and iron abundance are those obtained and reported in Paper II. In the end, the differences in parameters (in the sense of N minus S component) are ΔTeff = −35 ± 8 K, Δlog g = +0.010 ± 0.020 dex, Δξ = −0.07 ± 0.07 km s-1, and [Fe/H] = +0.055 ± 0.013 dex. Our analysis demonstrates that i) the S component is slightly hotter than the N component, as reported in Paper II; ii) in addition to the enhancement in iron found in Paper II, the XO-2 binary system is more rich than the Sun in almost all elements (see Fig. 3, where the differential abundances of the N minus S component are displayed as a function of the atomic number Z and the ionization potential I); and iii) XO-2N is enhanced in all refractory elements and less enhanced in average in volatiles (see Fig. 4, where the differential abundances are displayed as a function of the condensation temperatures). Hints of a similar behavior were reported by Teske et al. (2015) for Fe, Si, and Ni.
All differential elemental abundances have errors in the range ~0.01−0.05 dex (with the exception of europium), which further demonstrates the advantages of a strictly differential analysis. The mean abundance difference of all elements between XO-2N and XO-2S is Δ [X/H] = +0.067 ± 0.032 dex, with a mean difference of 0.025 dex for the volatile elements (Tc < 800 K) and ~0.078 dex for the elements with TC > 800 K. For the neutron-capture elements (e.g., Y ii, Zr ii, Ba ii, La ii, Nd ii, Eu ii) the mean difference is 0.087 dex. No elemental abundance of XO-2N differs from that of XO-2S by more than ~0.11 dex, and all but three species (N, S, and Eu) have differences detected at ≳ 2σ level.
Differential elemental abundances for the XO-2 system.
Mean internal errors in abundance determinations caused by given uncertainties (ΔTeff, Δlog g, and Δξ) in stellar parameters for XO-2N and XO-2S.
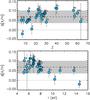 |
Fig. 3 Elemental abundance difference between XO-2N and XO-2S as a function of the atomic number Z (upper panel) and ionization potential I (lower panel). In both panels, the dotted line refers to a null difference, the dashed line represents the mean value of the difference, and the filled gray area is the ± 1σ level. |
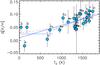 |
Fig. 4 Differential elemental abundances of XO-2N − XO-2S versus condensation temperatures. The solid blue line is the unweighted linear least-squares fit to our data. The horizontal dotted blue line represents the average of the volatiles, while the other dotted blue line is the trend of the refractory elements. The dashed red line is the mean trend obtained by Meléndez et al. (2009) for eleven solar twins with respect to the Sun, after a vertical shift was applied to match the refractory elements. |
3.2. Stellar population of the XO-2 components
Elemental abundances, together with Galactic kinematics, are often used to identify a star as belonging to a specific stellar population. This is because the thin disk and the thick disk within the Milky Way are discrete populations showing distinct chemical distributions in several elements, and in particular in α-elements. In fact, the Galactic thin and thick disks appear to overlap significantly around −0.7 ≲ [Fe/H] ≲ 0.0 dex when the iron abundance is used as a reference, while they are separated in [α/Fe] (see, e.g., Bensby et al. 2003; Mishenina et al. 2004).
Here, we investigate to which population the XO-2 stellar system belongs to take advantage of 431 stars listed in the catalog by Soubiran & Girard (2005) and 906 FGK dwarf stars analyzed by Adibekyan et al. (2012) with thin-disk, thick-disk, and halo membership probabilities (Pthin, Pthick, Phalo) higher than 90%. We used as abundance of α-elements the definition [α/Fe] =  ([Mg/Fe] + [Si/Fe] + [Ca/Fe] + [Ti/Fe]), since magnesium, silicon, calcium, and titanium are the common elements analyzed by these authors and by us, and also because they show similar behavior in the chemical evolution within our Galaxy. Figure 5 displays the position of the XO-2N and XO-2S stars in the [α/Fe] versus [Fe/H] diagram. Based on this chemical indicator, the stellar system we studied here appears to belong to the Galactic thin-disk population. This result supports previous findings based on kinematics (Burke et al. 2007) and an analysis of the Galactic orbits (Paper II).
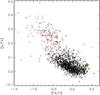 |
Fig. 5 [α/Fe] versus [Fe/H] for the Adibekyan et al. (2012) sample, where open circles, open squares, and asterisks represent stars with Pthin ≥ 0.90, Pthick ≥ 0.90, and Phalo ≥ 0.90 (from Bensby et al. 2003), respectively. Filled circles and squares show the stars within the Soubiran & Girard (2005) sample with Pthin ≥ 0.90 and Pthick ≥ 0.90 (from Mishenina et al. 2004), respectively. The positions of the two targets XO-2N and XO-2S are displayed with large yellow and green five-pointed star symbols, respectively. |
4. Abundance differences versus condensation temperatures
Possible evidence of planetesimal accretion can be investigated by searching for any dependence between elemental abundances and condensation temperatures. This is because any accretion event would occur very close to the star (i.e., in a high-temperature environment). Since refractory elements (e.g., α- and Fe-peak elements) condense at high TC, they might be added in large quantities with respect to volatile elements (e.g., C, N, O, Zn) with lower TC (Sozzetti et al. 2006, and references therein).
Any trend of [X/H] with TC can be quantified in terms of a positive slope in a linear fit. The possibility of a trend of [X/H] with TC (Sozzetti et al. 2006; González Hernández et al. 2013; Liu et al. 2014; Mack et al. 2014, and references therein) and its dependence on stellar age, surface gravity, and mean Galactocentric distance (Adibekyan et al. 2014) has been investigated by several authors, and often no statistically convincing trend could be found.
The similarity in stellar parameters between the XO-2 binary components allowed us to derive differential elemental abundances with a high level of confidence. Figure 4 shows the differential abundances of the XO-2N and XO-2S stars relative to each other versus TC in the range 40−1741 K (see also Table 2). We note that it is important to have a range of condensation temperatures as extended as possible to place constraints on such a trend. The slope of the unweighted linear least-squares fit is positive, with a value of (4.7 ± 0.9) × 10-5 dex K-1. We calculated the Pearson r correlation coefficient by means of the IDL8 procedure CORRELATE (Press et al. 1986). This test indicates that Δ[X/H] and TC are positively correlated, with r ~ 0.72. Considering only the elements with higher values of TC (i.e., > 800 K), the slope and r become (6.1 ± 2.1) × 10-5 dex K-1 and ~ 0.57, respectively. Moreover, using Monte Carlo simulations (Parke Loyd & France 2014), we found that the probability that uncorrelated random datasets can reproduce the observed arrangement of point is only ~ 0.9%. This proves that the observed positive correlation between the differential elemental abundances of XO-2N related to XO-2S and the condensation temperatures is significant. A similar peculiar positive trend in the observed differential abundances with TC has been found in solar twin stars known to have close-in giant planets (see Fig. 4), while the majority of solar analogs without revealed giant planets in radial velocity monitoring show a negative trend, such as the Sun (Meléndez et al. 2009). This result would seem to be consistent with the expectation that close-in giant planets prevent the formation and/or survival of terrestrial planets (Ida & Lin 2004).
4.1. Comparison with previous works
In Paper II we have found that XO-2N is richer in Fe abundance than the S component. Here, we confirm this finding for many more elements (in particular, the refractories). This result seems to be consistent with the recent work by Teske et al. (2015), who found that the N component is most probably enhanced in Si, Fe, and Ni when compared to XO-2S. No consensus was reached for 16 Cyg A/B because some authors found differences in the differential abundances (e.g., Ramírez et al. 2011; Tucci Maia et al. 2014) and others claimed that the stars are chemically homogeneous (with the exception of Li and B). Mack et al. (2014) found non-zero differences for O, Al, V, Cr, Fe, and Co of HD 20781/2. Again, Liu et al. (2014) found Δ[X/H] values consistent with zero in the HAT-P-1 G0+F8 binary. Recently, Teske et al. (2015) suggested that perhaps we see an effect in Δ[X/H] trends that is due to Teff, moving from hotter stars with no differences to cooler stars with more significant differences. They also warned that we have to approach this question with caution, as it is hard today to have an answer because of the different analysis methods applied and the host star nature of these systems (i.e., whether or not they host planets). Moreover, as pointed out by Sozzetti et al. (2006), there is an intrinsic difficulty in determining elemental abundances for a large set of elements in cool stars with accuracy without introducing greater uncertainties in the results.
Similarly to the analysis of several binary systems (see, e.g., Ramírez et al. 2009, 2011; Schuler et al. 2011b; Liu et al. 2014; Mack et al. 2014; Tucci Maia et al. 2014), we find a positive trend with TC for the elemental abundances. Our results are consistent with accretion events of H-depleted rocky material in both components. In single stars, an unambiguous explanation for these trends is difficult to reach, even in presence of slopes in the Δ[X/H]−TC relation steeper than Galactic chemical evolution effects, as they may not necessarily indicate the presence or absence of planets. González Hernández et al. (2013) have found that after removing the Galactic chemical evolution effects from a sample of 61 single FG-type main-sequence objects, stars both with and without planets show similar mean abundance patterns. On the other hand, the Galactic chemical evolution is not capable of producing specific element-by-element differences between components of a binary system, whereas the planetary accretion scenario might reproduce it naturally (see Mack et al. 2014).
5. Origin of the elemental abundances difference
The two stars have distinguishably different chemical composition (see Fig. 3), with a mean elemental abundance difference between the N and the S components of + 0.067 ± 0.032 dex, and statistically significant trends with the condensation temperature (Fig. 4). It is commonly assumed that individual components in binary systems share the same origin and initial bulk abundances because they form within the same cloud. Therefore, under the reasonable assumption that the XO-2 components were born together from the same molecular cloud, their dissimilar elemental abundances seem to favor other explanations than Galactic chemical evolution and/or stellar birthplace effects as possible reasons of the abundance patterns we observe (see, e.g., Adibekyan et al. 2014).
Differences in elemental abundances between the XO-2 system components could then reflect the likely different formation and evolution histories of the two planetary systems orbiting around them, which might have led to metal deficiencies in XO-2S or excesses in XO-2N. We recall the different architectures of the two planetary systems: XO-2N hosts a transiting hot Jupiter, with preliminary evidence for another object in an outer orbit (see Paper II, and references therein); XO-2S hosts two giant planetary companions on moderately close-in orbits (and possibly a third long-period object; see Paper I).
We estimated how many heavy elements were being accreted or depleted in one of the components following the prescriptions of Murray et al. (2001), as in Desidera et al. (2004, 2006). The mass of the convective envelope is about 0.06 M⊙. Based on the stellar [Fe/H] and Δ[Fe/H] between the components from Table 2, the difference of iron within the convective zone is ~ 10 M⊕. Assuming to first order a similar composition of meteoritic material, this corresponds to 50 M⊕ of heavy elements. These values are higher than those considered in similar studies on planetary accretion (e.g., Pinsonneault et al. 2001; Mack et al. 2014; Tucci Maia et al. 2014) because of the size of the convective envelope and the super solar metallicity of the XO-2 components. We consider in the following sub-sections two alternatives: depletion of heavy elements in XO-2S and excess of heavy elements in XO-2N.
5.1. Depletion of heavy elements in XO-2S?
The abundance difference between the components of the XO-2 system can be interpreted in the context of the scenario devised by Meléndez et al. (2009) as depletion of heavy elements in the stellar atmosphere of XO-2S because they are locked in planetary companions. More precisely, our result appears qualitatively similar to that recently found by Tucci Maia et al. (2014) in the binary system 16 Cyg A/B, in which the secondary component, which hosts a giant planet on an eccentric orbit, is poorer in metals than the companion, which is not known to have planetary companions. Moreover, as found by the same authors, here we reveal a hint of the break in TC between volatiles and refractories at ~ 800 K (Fig. 4). As pointed out by Tucci Maia et al. (2014), this means that the rocky core of the giant planet was most probably not formed in the inner disk, but at larger distances where they are more likely to form.
The large amounts of heavy elements to be locked in planetary companions is challenging to estimate. However, it is a possibility that cannot be dismissed in a super metal-rich environment such as that of the XO-2 system. Indeed, there are cases of compact transiting giant planets whose high density appears to be due to a very large content of heavy elements, such as the hot Saturn HD 149026b (Sato et al. 2005; Fortney et al. 2006).
Theoretical models also predict the existence of such high-density Saturn-mass planets formed by up to 80% of heavy elements (Mordasini et al. 2012), but they are most likely to form in the outer region of a super metal-rich protoplanetary disk (Dodson-Robinson & Bodenheimer 2009), so that substantial migration would have been needed to carry such a planet at the observed separation of XO-2Sb.
The inner planet XO-2Sb has a mass similar to HD 149026b and the stellar metallicities are also comparable. Unfortunately, search for transits of XO-2Sb have been inconclusive up to now (APACHE Team, priv. comm.), preventing the determination of the planet density. The presence in XO-2S of two planets (with XO-2Sc more massive than XO-2Nb) and the possibility of an additional object responsible for the long-term RV trend might also contribute to the segregation of heavy elements by the planets, favoring the locking scenario. The moderate eccentricities of the XO-2Sb and XO-2Sc (e ~ 0.2) could imply a smooth migration history of the known giant planets around XO-2S, possibly different from a dynamical instability event that might have caused the inward migration of XO-2Nb to its current tight orbit. Such a smooth evolution could also have allowed formation and survival of additional low-mass planets that remain undetected in the available RV data. This possibility was also mentioned by Teske et al. (2015).
5.2. Excess of heavy elements in XO-2N?
The enrichment of refractory elements in XO-2N when compared with XO-2S could be due to accretion of material onto the star and subsequent ingestion of rocky material coming from already formed planets or from the inner part of the disk and pushed into XO-2N by its hot Jupiter as it migrated inward to the current position, most likely as a result of planet-planet scattering (Gonzalez 1997; Ida & Lin 2008; Raymond et al. 2011). We discussed in Paper II that migration to the current close orbit of XO-2Nb cannot be due to Kozai interaction for the current orbit configuration, supporting a phase of dynamical instability in the planetary system. The almost null eccentricity and the low spin-orbit angle of XO-2Nb (see Paper II, and references therein) are not relevant for inferences on the original system configuration and migration history, as they are expected to be due to tidal effects considering the planet characteristics, the size of the stellar convective envelope, and the system age.
The dynamical instability could have been triggered by modifications of the binary orbit caused, for example, by stellar encounter in a dense stellar environment or a former hierarchical triple system that became unstable after the planets completed their growth around the primary star (Marzari & Barbieri 2007). Kaib et al. (2013) studied very wide binaries, indicating that they may reshape the planetary systems they host, changing the orbital eccentricity or causing the ejection of planets, or favoring the ingestion of material by the host star. In particular, the authors demonstrated that in binary systems with stellar masses and a mean separation similar to those of XO-2N/S, 90% of instabilities occur after ~ 100 Myr, that is, after planet formation is complete. This might cause ingestion of planetesimals and/or planet ejections of one or more objects. This scenario has the advantage that the dynamical instability and the successive system reconfiguration could have occurred well after the shrinking of the outer stellar convective zone after the pre-main-sequence phase, which would avoid one of the difficulties in the planetary accretion scenario.
The different situation of the HAT-P-1 system might be a challenge. Its secondary also hosts a hot Jupiter with mass of 0.53 MJ and orbital period 4.46529 days (Bakos et al. 2007), which means that it is not markedly different from XO-2Nb. The component masses of the system are slightly higher than those of the XO-2 system (1.16 M⊙ and 1.12 M⊙) and the binary separation is also large (1550 AU), similar as for the XO-2 system. However, no significant abundance differences between the components have been reported by Liu et al. (2014). It was suggested that while the smaller size of the convective envelope could facilitate the imprinting of any planetary signature on the system, the higher stellar mass favored a faster system evolution, with accretion before the shrinking of the convective zone, as more massive stars seem to have shorter disk lifetimes (Williams & Cieza 2011). More likely, the stochastic nature of the dynamical instability events imply different outcomes for the ingestion of already formed planets and planetary debris.
The amount of heavy elements to be ingested in the XO-2N enrichment scenario obviously corresponds to that assumed to be locked into planetary bodies in the XO-2S depletion scenario. As shown above, low-mass giant planets could have heavy element contents of several tens of Earth masses, making the ingestion of an individual planet with peculiar characteristics a possible cause for the whole abundance difference.
6. Conclusions
We performed an accurate differential analysis of abundances of iron-peak, α-, s-process, r-process, and other elements for the dual-planet-hosting binary XO-2, in which the stars show very similar stellar parameters (Teff ~ 5300 K, log g ~ 4.43, M⋆ ~ 0.97 M⊙, R⋆ ~ 1.0 R⊙, and [Fe/H] ~ 0.35 dex). To our knowledge, this is the first binary system in which both components host planets and where elemental abundance differences were revealed (see also Teske et al. 2015; Ramírez et al. 2015).
We found significative abundance differences in almost all 25 elements, in the sense that the slightly cooler component XO-2N is also the star with higher content of elemental abundances, with stronger enhancement in the refractories. The abundance differences range from ~ 0 dex for the volatiles to up to ~ 0.11 dex for the refractory elements, with a significance at the 2σ level for almost all elements.
The differential abundances of XO-2N relative XO-2S show positive trends with TC, with a significance of the slope at the 5σ level considering all elements. This could mean that both components experienced the accretion of rocky planetary interior to the subsequent giant planets. We discussed the possibilities of interpreting this result as the signature of abundance deficiencies in XO-2S or excesses in XO-2N, that is, due to the ingestion of material by XO-2N or depletion by locking of heavy elements by the XO-2S planets, respectively. We estimated a mass of several tens of the Earth mass as the amount in heavy elements that are accreted or depleted. We currently do not know which of these two scenarios dominates or which is the most appropriate and conclude that both are plausible. Future detailed numerical simulations and theoretical interpretations are needed to try to distinguish between these possibilities and clarify whether one of the two hypotheses is most probable or if both are at work in this system. This is beyond the aim of this work, which examined possible differences in elemental abundances in a planet-hosting binary.
We confirm that binaries hosting stars are useful tools to derive elemental abundance differences in a very accurate way. Future detailed studies on the chemical composition of double systems hosting planets can provide important constraints on stellar or planetary formation and the subsequent evolution. Studies of the influence of planet formation on the chemical composition of hosted stars can be important to select future exoplanet searches.
Damasso et al. (2015) measured the XO-2 rotation periods, finding a value of 41.6 days for XO-2N and a value between 26 and 34.5 days for XO-2S, combined with slight decreases in the activity levels of both stars at the end of the 2013–2014 season. Analyzing new APACHE photometric data taken from October 2014 to April 2015, neither of these findings are confirmed, probably as a result of the still decreased magnetic activity.
After this paper was submitted, an independent work by Ramírez et al. (2015) based on different spectroscopic data and methodologies was published; the results agree well and are consistent with our analysis.

Acknowledgments
This Italian GAPS project acknowledges support from INAF through the “Progetti Premiali” funding scheme of the Italian Ministry of Education, University, and Research. We thank the TNG staff for help with the observations. K.B. also thanks V. D’Orazi and C. Sneden for fruitful discussions of heavy elements.
References
- Adibekyan, V. Zh, Santos, N. C., Sousa, S. G., et al. 2012, A&A, 543, A89 [NASA ADS] [CrossRef] [EDP Sciences] [Google Scholar]
- Adibekyan, V. Zh, González Hernández, J. I., Delgado Mena, E., et al. 2014, A&A, 564, L15 [NASA ADS] [CrossRef] [EDP Sciences] [Google Scholar]
- Alibert, Y., Mordasini, C., Benz, W., & Winisdoerffer, C. 2005, A&A, 434, 343 [NASA ADS] [CrossRef] [EDP Sciences] [Google Scholar]
- Anders, E., & Grevesse, N. 1989, Geochim. Cosmoch. Acta, 53, 197 [Google Scholar]
- Asplund, M., Grevesse, N., Sauval, A. J., & Scott, P. 2009, ARA&A, 47, 481 [NASA ADS] [CrossRef] [Google Scholar]
- Bakos, G. Á., Shporer, A., Pál, A., et al. 2007, ApJ, 671, 173 [Google Scholar]
- Bensby, T., Feltzing, S., & Lundstroem, I. 2003, A&A, 410, 527 [NASA ADS] [CrossRef] [EDP Sciences] [Google Scholar]
- Biazzo, K., D’Orazi, V., Desidera, S., et al. 2012, MNRAS, 427, 2905 [NASA ADS] [CrossRef] [Google Scholar]
- Brooke, J. S. A., Bernath, P. F., Schmidt, T. W., & Bacskay, G. B. 2013, J. Quant. Spectr. Radiat. Trans., 124, 11 [NASA ADS] [CrossRef] [Google Scholar]
- Burke, C. J., McCullough, P. R., Valenti, J. A., et al. 2007, ApJ, 671, 2115 [NASA ADS] [CrossRef] [Google Scholar]
- Butler, R. P., Vogt, S., Marcy, G. W., et al. 2000, ApJ, 545, 504 [NASA ADS] [CrossRef] [Google Scholar]
- Chambers, J. E. 2010, ApJ, 724, 92 [NASA ADS] [CrossRef] [Google Scholar]
- Cosentino, R., Lovis, C., Pepe, F., et al. 2012, in SPIE Conf. Ser., 8446 [Google Scholar]
- Covino, E., Esposito, M., Barbieri, M., et al. 2013, A&A, 554, A28 [NASA ADS] [CrossRef] [EDP Sciences] [Google Scholar]
- Damasso, M., Biazzo, K., Bonomo, A. S., et al. 2015, A&A, 575, A111 [NASA ADS] [CrossRef] [EDP Sciences] [Google Scholar]
- Den Hartog, E. A., Lawler, J. E., Sneden, C., & Cowan, J. J. 2003, ApJS, 148, 543 [Google Scholar]
- Desidera, S., Gratton, R. G., Scuderi, S., et al. 2004, A&A, 420, 683 [NASA ADS] [CrossRef] [EDP Sciences] [Google Scholar]
- Desidera, S., Gratton, R. G., Lucatello, S., & Claudi, R. U. 2006, A&A, 454, 581 [NASA ADS] [CrossRef] [EDP Sciences] [Google Scholar]
- Desidera, S., Carolo, E., Gratton, R., et al. 2011, A&A, 533, A90 [NASA ADS] [CrossRef] [EDP Sciences] [Google Scholar]
- Desidera, S., Gratton, R. G., Carolo, E., et al. 2012, A&A, 546, A108 [NASA ADS] [CrossRef] [EDP Sciences] [Google Scholar]
- Desidera, S., Bonomo, A. S., Claudi, R. U., et al. 2014, A&A, 567, L6 [NASA ADS] [CrossRef] [EDP Sciences] [Google Scholar]
- Dodson-Robinson, S. E., & Bodenheimer, P. 2009, ApJ, 695, L159 [NASA ADS] [CrossRef] [Google Scholar]
- Draine, B. T., Dale, D. A., Bendo, G., et al. 2007, ApJ, 663, 866 [NASA ADS] [CrossRef] [Google Scholar]
- Fischer, D. A., & Valenti, J. 2005, ApJ, 622, 1102 [NASA ADS] [CrossRef] [Google Scholar]
- Fortney, J. J., Saumon, D., Marley, M. S., Lodders, K., & Freedman, R. S. 2006, ApJ, 642, 495 [NASA ADS] [CrossRef] [Google Scholar]
- Gallagher, A. J., Ryan, S. G., García Pérez, A. E., & Aoki, W. 2010, A&A, 523, A24 [NASA ADS] [CrossRef] [EDP Sciences] [Google Scholar]
- Gonzalez, G. 1997, MNRAS, 285, 403 [NASA ADS] [CrossRef] [Google Scholar]
- González Hernández, J. I., Delgado Mena, E., Sousa, S. G., et al. 2013, A&A, 552, A6 [NASA ADS] [CrossRef] [EDP Sciences] [Google Scholar]
- Gratton, R. G., Bonanno, G., Claudi, R. U., et al. 2001, A&A, 377, 123 [NASA ADS] [CrossRef] [EDP Sciences] [Google Scholar]
- Grevesse, N., Scott, P., Asplund, M., & Sauval, A. J. 2015, A&A, 573, A27 [NASA ADS] [CrossRef] [EDP Sciences] [Google Scholar]
- Ida, S., & Lin, D. N. C. 2004, ApJ, 604, 388 [NASA ADS] [CrossRef] [PubMed] [Google Scholar]
- Ida, S., & Lin, D. N. C. 2008, ApJ, 673, 487 [NASA ADS] [CrossRef] [Google Scholar]
- Johnson, A. J., Ivans, I. I., & Stetson, P. B. 2006, ApJ, 640, 801 [NASA ADS] [CrossRef] [Google Scholar]
- Jones, H., Butler, P., Tinney, Ch., et al. 2006, MNRAS, 369, 249 [NASA ADS] [CrossRef] [Google Scholar]
- Kaib, N. A., Raymond, S. N., & Duncan, M. 2013, Nature, 493, 381 [NASA ADS] [CrossRef] [Google Scholar]
- Kurucz, R. L. 1993, Phys. Scr. T, 47, 110 [NASA ADS] [CrossRef] [Google Scholar]
- Lawler, J. E., Bonvallet, G., & Sneden, C. 2001a, ApJ, 556, 452 [NASA ADS] [CrossRef] [Google Scholar]
- Lawler, J. E., Wickliffe, M. E., Den Hartog, E. A., & Sneden, C. 2001b, ApJ, 563, 1075 [CrossRef] [Google Scholar]
- Laws, C., & Gonzalez, G. 2001, ApJ, 533, 405 [NASA ADS] [CrossRef] [Google Scholar]
- Laws, C., Gonzalez, G., Walker, K. M., et al. 2003, AJ, 125, 2664 [NASA ADS] [CrossRef] [Google Scholar]
- Lepine, S., & Shara, M. M. 2005, AJ, 129, 1483 [NASA ADS] [CrossRef] [Google Scholar]
- Liu, F., Asplund, M., Ramírez, I., Yong, D., & Meléndez, J. 2014, MNRAS, 442, L51 [NASA ADS] [CrossRef] [Google Scholar]
- Ljung, G., Nilsson, H., Asplund, M., & Johansson, S. 2006, A&A, 456, 1181 [NASA ADS] [CrossRef] [EDP Sciences] [Google Scholar]
- Lodders, K. 2003, ApJ, 591, 1220 [NASA ADS] [CrossRef] [Google Scholar]
- Mack, C. E. III, Schuler, S. C., Stassun, K. G., & Norris, J. 2014, ApJ, 787, 98 [NASA ADS] [CrossRef] [Google Scholar]
- Maldonado, J., Eiroa, C., Villaver, E., Montesinos, B., & Mora, A. 2015, A&A, 579, A20 [NASA ADS] [CrossRef] [EDP Sciences] [Google Scholar]
- Marzari, F., & Barbieri, M. 2007, A&A, 467, 347 [NASA ADS] [CrossRef] [EDP Sciences] [Google Scholar]
- Meléndez, J., Asplund, M., Gustafsson, B., & Yong, D. 2009, ApJ, 704, L66 [NASA ADS] [CrossRef] [Google Scholar]
- Metcalfe, T. S., Chaplin, W. J., Appourchaux, T., et al. 2012, ApJ, 748, L10 [NASA ADS] [CrossRef] [Google Scholar]
- Mishenina, T. V., Soubiran, C., Kovtyukh, V. V., & Korotin, S. A. 2004, A&A, 418, 551 [NASA ADS] [CrossRef] [EDP Sciences] [Google Scholar]
- Mordasini, C., Alibert, Y., Klahr, H., & Henning, T. 2012, A&A, 547, A111 [NASA ADS] [CrossRef] [EDP Sciences] [Google Scholar]
- Mortier, A., Santos, N. C., Sozzetti, A., et al. 2012, A&A, 543, A45 [NASA ADS] [CrossRef] [EDP Sciences] [Google Scholar]
- Murray, N., Chaboyer, B., Arras, P., Hansen, B., & Noyes, R. W. 2001, ApJ, 555, 801 [NASA ADS] [CrossRef] [Google Scholar]
- Neveu-Vanmalle, M., Queloz, D., Anderson, D., et al. 2014, A&A, 572, A49 [NASA ADS] [CrossRef] [EDP Sciences] [Google Scholar]
- Parke Loyd, R. O., & France, K. 2014, ApJS, 211, 9 [NASA ADS] [CrossRef] [Google Scholar]
- Pei, Y. C., & Fall, S. M. 1995, ApJ, 454, 69 [NASA ADS] [CrossRef] [Google Scholar]
- Pinsonneault, M. H., DePoy, D. L., & Coffee, M. 2001, ApJ, 556, L59 [NASA ADS] [CrossRef] [Google Scholar]
- Pollack, J. B., Hubickyj, O., Bodenheimer, P., et al. 1996, Icarus, 124, 62 [NASA ADS] [CrossRef] [Google Scholar]
- Press, W. H., Teukolsky, S. A., Wetterling, W. T., & Flannery, B. P. 1986, Numerical Recipes, The Art of Scientific Computing, 2nd edn. (Cambridge University Press) [Google Scholar]
- Prochaska, J. X., Naumov, S. O., Carney, B. W., McWilliam, A., & Wolfe, A. M. 2000, AJ, 120, 2513 [NASA ADS] [CrossRef] [Google Scholar]
- Ram, R. S., Brooke, J. S. A., Bernath, P. F., Sneden, C., & Lucatello, S. 2014, ApJS, 211, 5 [Google Scholar]
- Ramírez, I., Meléndez, J., & Asplund, M. 2009, A&A, 508, L17 [NASA ADS] [CrossRef] [EDP Sciences] [Google Scholar]
- Ramírez, I., Asplund, M., Baumann, P., Meléndez, J., & Bensby, T. 2010, A&A, 521, A33 [NASA ADS] [CrossRef] [EDP Sciences] [Google Scholar]
- Ramírez, I., Meléndez, J., Cornejo, D., Roederer, I. U., & Fish, J. R. 2011, ApJ, 740, 76 [NASA ADS] [CrossRef] [Google Scholar]
- Ramírez, I., Meléndez, J., & Asplund, M. 2014, A&A, 561, A7 [NASA ADS] [CrossRef] [EDP Sciences] [Google Scholar]
- Ramírez, I., Khanal, S., Aleo, P., et al. 2015, ApJ, 808, 13 [NASA ADS] [CrossRef] [Google Scholar]
- Rowe, J., Bryson, T., Marcy, G., et al. 2014, ApJ, 784, 45 [NASA ADS] [CrossRef] [Google Scholar]
- Raymond, S. N., Armitage, P. J., Moro-Martín, A., et al. 2011, A&A, 530, A62 [NASA ADS] [CrossRef] [EDP Sciences] [Google Scholar]
- Santos, N. C., Israelian, G., & Mayor, M. 2004, A&A, 415, 1153 [NASA ADS] [CrossRef] [EDP Sciences] [Google Scholar]
- Sato, B., Fischer, D. A., Henry, G. W., et al. 2005, ApJ, 633, 465 [NASA ADS] [CrossRef] [Google Scholar]
- Scott, P., Asplund, M., Grevesse, N., Bergemann, M., & Sauval, A. J. 2015a, A&A, 573, A26 [NASA ADS] [CrossRef] [EDP Sciences] [Google Scholar]
- Scott, P., Grevesse, N., Asplund, M., et al. 2015b, A&A, 573, A25 [NASA ADS] [CrossRef] [EDP Sciences] [Google Scholar]
- Schuler, S. C., Cunha, K., Smith, V., et al. 2011a, ApJ, 737, L32 [NASA ADS] [CrossRef] [Google Scholar]
- Schuler, S. C., Flateau, D., Cunha, K., et al. 2011b, ApJ, 732, 55 [NASA ADS] [CrossRef] [Google Scholar]
- Smith, V. V., Cunha, K., & Lazzaro, D. 2001, AJ, 121, 3207 [NASA ADS] [CrossRef] [Google Scholar]
- Sneden, C. A. 1973, ApJ, 184, 839 [NASA ADS] [CrossRef] [Google Scholar]
- Sneden, C., Lucatello, S., Ram, R. S., Brooke, J. S. A., & Bernath, P. 2014, ApJS, 214, 26 [Google Scholar]
- Soubiran, C., & Girard, P. 2005, A&A, 438, 139 [NASA ADS] [CrossRef] [EDP Sciences] [Google Scholar]
- Sozzetti, A., Young, D., Carney, B. W., et al. 2006, ApJ, 131, 2274 [Google Scholar]
- Sozzetti, A., Torres, G., Latham, D. W., et al. 2009, ApJ, 697, 544 [NASA ADS] [CrossRef] [Google Scholar]
- Takeda, Y. 2005, PASJ, 57, 83 [NASA ADS] [Google Scholar]
- Teske, J. K., Schuler, S. C., Cunha, K., Smith, V., & Griffith, C. 2013, ApJ, 768, L12 [NASA ADS] [CrossRef] [Google Scholar]
- Teske, J. K., Ghezzi, L., Cunha, K., et al. 2015, ApJ, 801, L10 [NASA ADS] [CrossRef] [Google Scholar]
- Tucci Maia, M., Meléndez, J., & Ramírez, I. 2014, ApJ, 790, L25 [NASA ADS] [CrossRef] [Google Scholar]
- Udry, S., & Santos, N. C. 2007, ARA&A, 44, 397 [NASA ADS] [CrossRef] [Google Scholar]
- Williams, J. P., & Cieza, L. A. 2011, ARA&A, 49, 67 [NASA ADS] [CrossRef] [Google Scholar]
- Yong, D., Meléndez, J., & Grundahl, F. 2013, MNRAS, 434, 3542 [NASA ADS] [CrossRef] [Google Scholar]
- Zuckerman, B., Koester, D., Reid, I. N., & Hünsch, M. 2003, ApJ, 596, 477 [NASA ADS] [CrossRef] [Google Scholar]
All Tables
Comparison between our measured solar abundances and standard values from the literature.
Mean internal errors in abundance determinations caused by given uncertainties (ΔTeff, Δlog g, and Δξ) in stellar parameters for XO-2N and XO-2S.
All Figures
|
Fig. 1 Comparison between observed (black line) and synthetic spectra for XO-2S in the region around the [O i] line at 6300.3 Å. The synthetic spectra have been computed for log n(O) = 9.15 (blue line), 9.20 (red line), and 9.25 (green line), respectively. We note that several CN lines are also present in this spectral region; as a result of the coupling between C and O, the strength of these features is anticorrelated with that of O. |
| In the text | |
|
Fig. 2 Comparison between observed (black line) and synthetic spectra for XO-2S in the region around the bandhead of C2 at 5635 Å. The synthetic spectra have been computed for log n(C) = 8.83 (blue line), 8.88 (red line), and 8.93 (green line), respectively. |
| In the text | |
|
Fig. 3 Elemental abundance difference between XO-2N and XO-2S as a function of the atomic number Z (upper panel) and ionization potential I (lower panel). In both panels, the dotted line refers to a null difference, the dashed line represents the mean value of the difference, and the filled gray area is the ± 1σ level. |
| In the text | |
|
Fig. 4 Differential elemental abundances of XO-2N − XO-2S versus condensation temperatures. The solid blue line is the unweighted linear least-squares fit to our data. The horizontal dotted blue line represents the average of the volatiles, while the other dotted blue line is the trend of the refractory elements. The dashed red line is the mean trend obtained by Meléndez et al. (2009) for eleven solar twins with respect to the Sun, after a vertical shift was applied to match the refractory elements. |
| In the text | |
|
Fig. 5 [α/Fe] versus [Fe/H] for the Adibekyan et al. (2012) sample, where open circles, open squares, and asterisks represent stars with Pthin ≥ 0.90, Pthick ≥ 0.90, and Phalo ≥ 0.90 (from Bensby et al. 2003), respectively. Filled circles and squares show the stars within the Soubiran & Girard (2005) sample with Pthin ≥ 0.90 and Pthick ≥ 0.90 (from Mishenina et al. 2004), respectively. The positions of the two targets XO-2N and XO-2S are displayed with large yellow and green five-pointed star symbols, respectively. |
| In the text | |
Current usage metrics show cumulative count of Article Views (full-text article views including HTML views, PDF and ePub downloads, according to the available data) and Abstracts Views on Vision4Press platform.
Data correspond to usage on the plateform after 2015. The current usage metrics is available 48-96 hours after online publication and is updated daily on week days.
Initial download of the metrics may take a while.