Fig. 1
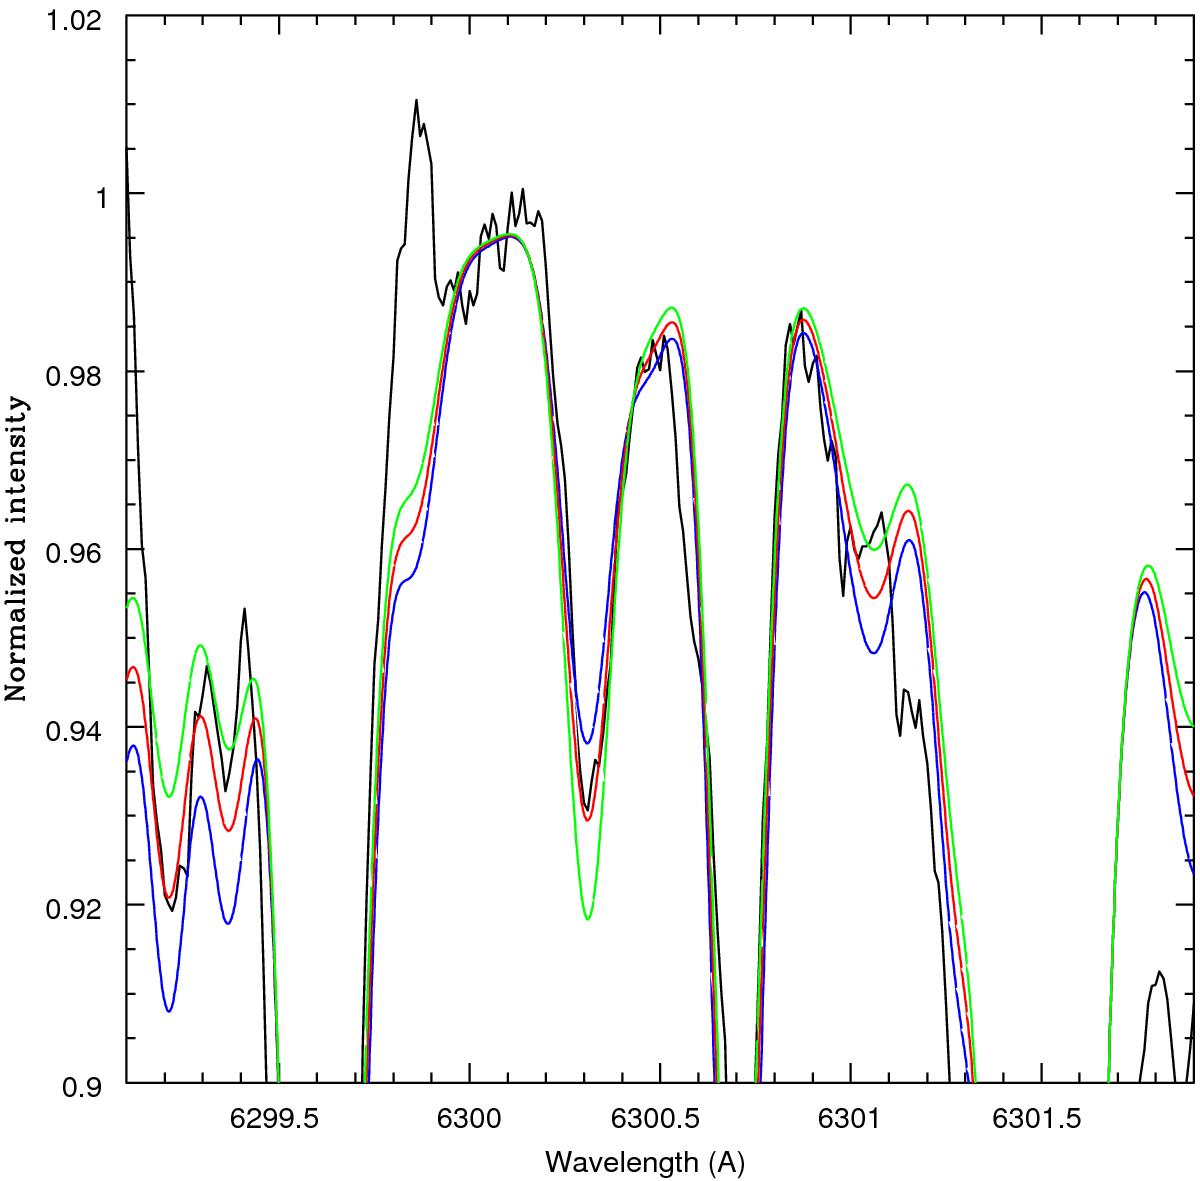
Comparison between observed (black line) and synthetic spectra for XO-2S in the region around the [O i] line at 6300.3 Å. The synthetic spectra have been computed for log n(O) = 9.15 (blue line), 9.20 (red line), and 9.25 (green line), respectively. We note that several CN lines are also present in this spectral region; as a result of the coupling between C and O, the strength of these features is anticorrelated with that of O.
Current usage metrics show cumulative count of Article Views (full-text article views including HTML views, PDF and ePub downloads, according to the available data) and Abstracts Views on Vision4Press platform.
Data correspond to usage on the plateform after 2015. The current usage metrics is available 48-96 hours after online publication and is updated daily on week days.
Initial download of the metrics may take a while.