Free Access
Fig. 3
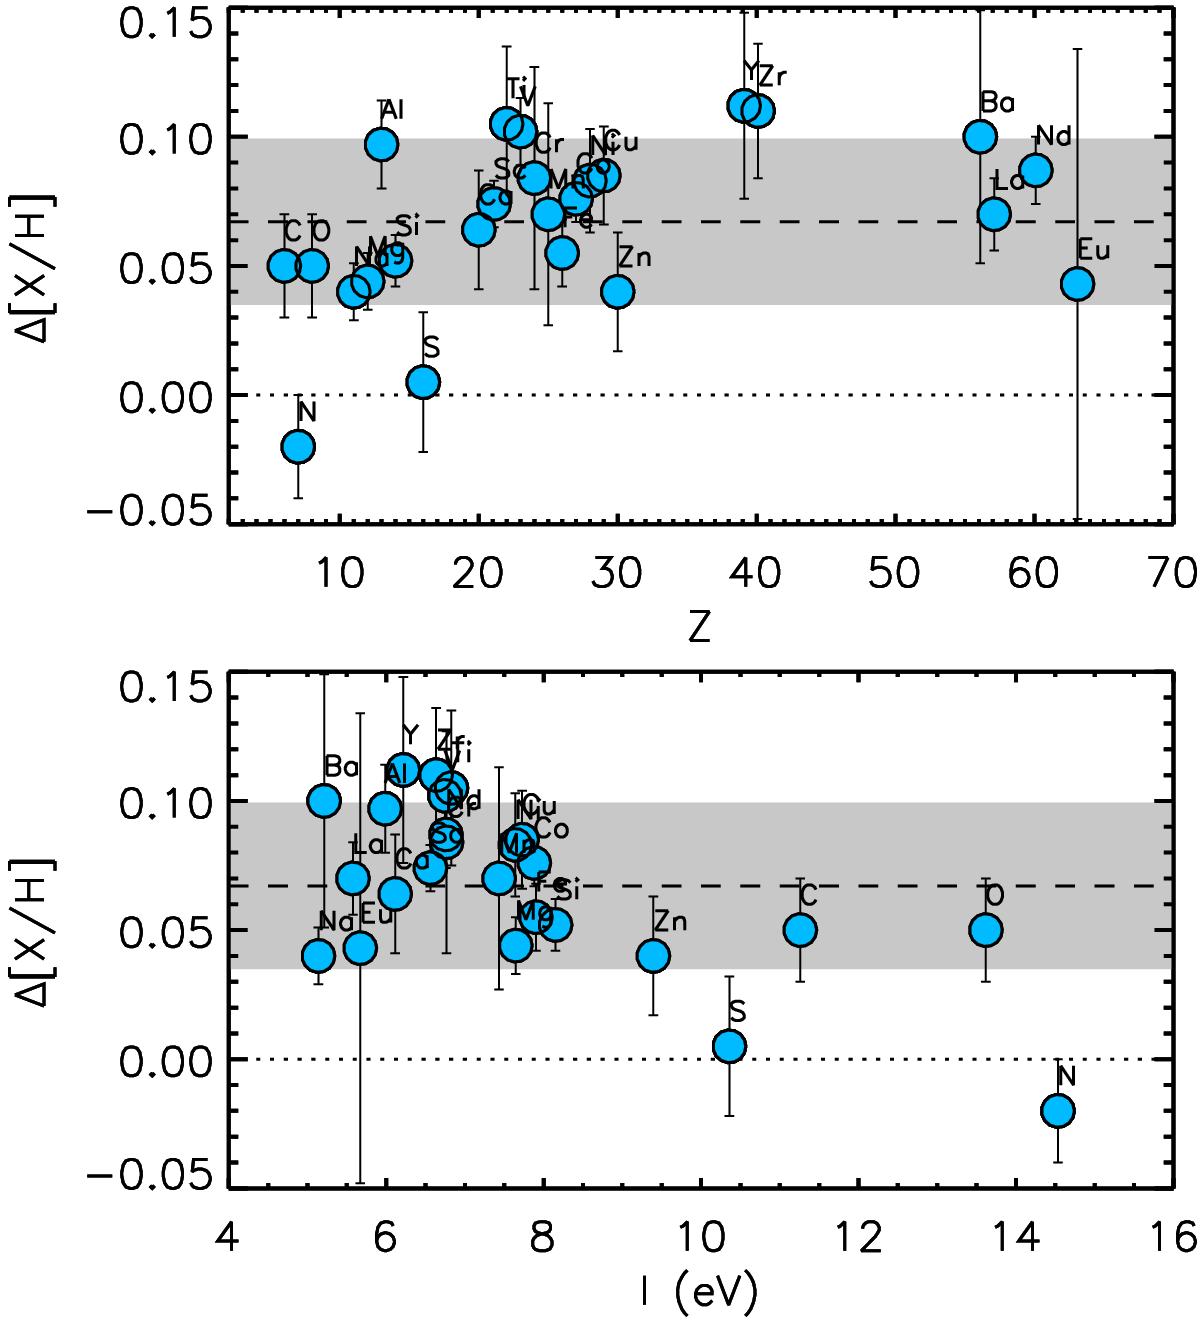
Elemental abundance difference between XO-2N and XO-2S as a function of the atomic number Z (upper panel) and ionization potential I (lower panel). In both panels, the dotted line refers to a null difference, the dashed line represents the mean value of the difference, and the filled gray area is the ± 1σ level.
Current usage metrics show cumulative count of Article Views (full-text article views including HTML views, PDF and ePub downloads, according to the available data) and Abstracts Views on Vision4Press platform.
Data correspond to usage on the plateform after 2015. The current usage metrics is available 48-96 hours after online publication and is updated daily on week days.
Initial download of the metrics may take a while.