| Issue |
A&A
Volume 582, October 2015
|
|
|---|---|---|
| Article Number | A88 | |
| Number of page(s) | 28 | |
| Section | Interstellar and circumstellar matter | |
| DOI | https://doi.org/10.1051/0004-6361/201526751 | |
| Published online | 14 October 2015 | |
The molecular composition of the planet-forming regions of protoplanetary disks across the luminosity regime⋆
1
Leiden Observatory, Leiden University, PO Box 9513
2300 RA
Leiden
The Netherlands
e-mail: This email address is being protected from spambots. You need JavaScript enabled to view it.
2
Department of Earth and Planetary Sciences, Tokyo Institute of
Technology, 2-12-1 Ookayama,
Meguro-ku, 152-8551
Tokyo,
Japan
3
Max-Planck-Institut für extraterretrische Physik,
Giessenbachstrasse 1,
85748
Garching,
Germany
Received:
15
June
2015
Accepted:
30
July
2015
Abstract
Context. Near- to mid-infrared observations of molecular emission from protoplanetary disks show that the inner regions are rich in small organic volatiles (e.g., C2H2 and HCN). Trends in the data suggest that disks around cooler stars (Teff ≈ 3000 K) are potentially (i) more carbon-rich; and (ii) more molecule-rich than their hotter counterparts (Teff ≳ 4000 K).
Aims. We explore the chemical composition of the planet-forming region (<10 AU) of protoplanetary disks around stars over a range of spectral types (from M dwarf to Herbig Ae) and compare with the observed trends.
Methods. Self-consistent models of the physical structure of a protoplanetary disk around stars of different spectral types are coupled with a comprehensive gas-grain chemical network to map the molecular abundances in the planet-forming zone. The effects of (i) N2 self shielding; (ii) X-ray-induced chemistry; and (iii) initial abundances, are investigated. The chemical composition in the “observable” atmosphere is compared with that in the disk midplane where the bulk of the planet-building reservoir resides.
Results. M dwarf disk atmospheres are relatively more molecule rich than those for T Tauri or Herbig Ae disks. The weak far-UV flux helps retain this complexity which is enhanced by X-ray-induced ion-molecule chemistry. N2 self shielding has only a small effect in the disk molecular layer and does not explain the higher C2H2/HCN ratios observed towards cooler stars. The models underproduce the OH/H2O column density ratios constrained in Herbig Ae disks, despite reproducing (within an order of magnitude) the absolute value for OH: the inclusion of self shielding for H2O photodissociation only increases this discrepancy. One possible explanation is the adopted disk structure. Alternatively, the “hot” H2O (T ≳ 300 K) chemistry may be more complex than assumed. The results for the atmosphere are independent of the assumed initial abundances; however, the composition of the disk midplane is sensitive to the initial main elemental reservoirs. The models show that the gas in the inner disk is generally more carbon rich than the midplane ices. This effect is most significant for disks around cooler stars. Furthermore, the atmospheric C/O ratio appears larger than it actually is when calculated using observable tracers only. This is because gas-phase O2 is predicted to be a significant reservoir of atmospheric oxygen.
Conclusions. The models suggest that the gas in the inner regions of disks around cooler stars is more carbon rich; however, calculations of the molecular emission are necessary to definitively confirm whether the chemical trends reproduce the observed trends.
Key words: astrochemistry / protoplanetary disks / stars: formation
Appendix A is available in electronic form at http://www.aanda.org
© ESO, 2015
1. Introduction
Protoplanetary disks provide the ingredients – dust, gas, and ice – for planets and planetesimals such as comets (for a review, see, e.g., Williams & Cieza 2011). In disks around low-mass stars (≲2 M⊙), planetary systems are thought to form relatively close to the parent star (≲10 AU); hence, the chemical composition of the inner disk region sets the initial conditions and available elemental components for planetary systems. The molecular material within ≈10 AU is generally dense (≳108 cm-3) and can reach high temperatures (≳100 K) allowing (ro)vibrational excitation of molecules which emit radiation at near- to mid-infrared (IR) wavelengths. The physical conditions within this region drive the chemistry towards the formation of small, simple, stable molecules most of which, fortunately, also have strong (ro)vibrational transitions.
Near- to mid-IR spectroscopy of nearby primordial protoplanetary disks has demonstrated that the inner planet-forming regions are rich in organic volatiles. The Spitzer Space Telescope allowed the first detection of simple organic molecules in protoplanetary disks at IR wavelengths. Lahuis et al. (2006) reported absorption bands of C2H2, HCN, and CO2 in the spectrum of the low-mass young stellar object, IRS 46, attributed to absorption from hot molecules in a disk within a few AU of the embedded star. The following year, Gibb et al. (2007) detected absorption bands from CO, C2H2, and HCN in the disk around a member of the binary system, GV Tau, using NIRSPEC on Keck. Ongoing efforts have detected additional molecules in either emission or absorption, including, OH, H2O, and CH4, in several nearby disks using both Spitzer and ground-based facilities (see, e.g., Carr & Najita 2008; Salyk et al. 2008; Pascucci et al. 2009; Pontoppidan et al. 2010; Carr & Najita 2011; Fedele et al. 2011; Salyk et al. 2011; Mandell et al. 2012; Bast et al. 2013; Najita et al. 2013; Gibb & Horne 2013; Pascucci et al. 2013). Because of dust opacity, such observations probe the composition of the disk atmosphere only. It remains unclear whether the atmospheric composition is representative of that of the disk midplane within which planetesimals sweep up the bulk of their material.
Several interesting trends have been noticed in the IR observations. Pascucci et al. (2008, 2009) presented results from a low-resolution (R ≈ 64−128) Spitzer/IRS survey of more than 60 sources ranging from brown dwarfs (Teff ≈ 3000 K) to Sun-like stars (Teff ≈ 5000 K). The observations demonstrated an underabundance of HCN relative to C2H2 in disks around M dwarfs compared with those around T Tauri stars. The authors postulate this could be due to the difference in far-ultraviolet (FUV) luminosity: M dwarf stars have insufficient FUV photons to dissociate N2, the main nitrogen reservoir, thereby trapping elemental nitrogen which would otherwise be available to form other nitrogen-containing species, e.g., HCN. The authors have since published additional observations at higher spectral resolution (R ≈ 600) and find the same result: the ratio of C2H2/HCN line flux and relative column density decreases with increasing spectral type (Pascucci et al. 2013). They also find that the HCN/H2O line flux ratios are higher for M dwarf stars than for T Tauri stars leading the authors to conclude that the C/O ratio in the inner regions of M dwarf and brown dwarf disks is higher (≈1) than that for disks around T Tauri stars (<1). Within the subset of T Tauri disks, Najita et al. (2013) postulated that a second trend was present. They found a correlation between the HCN/H2O line flux ratio and disk mass. Their hypothesis is that planetesimal formation is more efficient in higher mass disks and is able to lock up a significant fraction of oxygen (in the form of water ice) thereby increasing the C/O ratio in the inner region of the disk. In summary, the C/O ratio in the inner regions of protoplanetary disks appears to increase with decreasing spectral type, and within a particular sub class of star-disk systems, to increase with increasing disk mass.
Pontoppidan et al. (2010) conducted a similar survey in the 10−36 μm wavelength range, with a source list also covering Herbig Ae/Be stars (Teff ≳ 10 000 K). They detected strong H2O mid-IR line emission from 22 T Tauri stars in their sample, with a detection rate on the order of 2/3; however, to their surprise, no disks in their sample of 25 Herbig stars exhibited water (nor OH) line emission. At near-IR wavelengths, Fedele et al. (2011) conducted a high-resolution spectroscopic survey (L-band) of Herbig Ae/Be disks. OH emission was detected in only four objects, mainly flared disks, and, similar to that found by Pontoppidan et al. (2010), H2O was not detected. Both sets of authors suggested that the stronger FUV flux from the Herbig Ae/Be stars dissociates molecules in the unshielded inner disk region thereby lowering the line flux in relation to the stellar luminosity. Observations from Herschel support this hypothesis: most of the Herbig Ae/Be disks in the GASPS and DIGIT key programmes exhibit strong OI emission 63 μm with a sub sample also showing OH emission (Meeus et al. 2012; Fedele et al. 2013). Many of these sources also have strong OI emission at 6300 Å (see e.g., Acke et al. 2005). In contrast, only HD 163296 (which is a “flat” or settled disk) has a robust (>3σ) water detection between 50 and 220 μm (Fedele et al. 2012, 2013).
One of the first chemical models which concentrated solely on the inner disk (≲ 10 AU) of a T Tauri star is presented in Markwick et al. (2002); however, the authors neglected the influence of the stellar and interstellar radiation fields on the disk physics and chemistry using the reasoning that viscous heating will dominate the inner disk structure. The initial detections of volatiles in the inner regions of protoplanetary disks (Lahuis et al. 2006; Gibb et al. 2007; Carr & Najita 2008) prompted a flurry of astrochemical models mainly focussed on T Tauri disks (e.g, Agúndez et al. 2008; Willacy & Woods 2009; Woods & Willacy 2009; Walsh et al. 2010; Najita et al. 2011). These models differed somewhat in their level of complexity. Agúndez et al. (2008) adapted a model used for photon-dominated regions (PDRs) but neglected heating due to UV excess emission and X-rays and also assumed that the dust and gas temperatures were equal. Willacy & Woods (2009) and Woods & Willacy (2009) calculated the gas temperature by solving the equation of thermal balance; however, the dust temperature and density were assumed and heating by UV excess emission from the star was neglected (D’Alessio et al. 2006). Najita et al. (2011) adopted a similar approach albeit using a reduced chemical network. Walsh et al. (2010) used a self-consistent model for the protoplanetary disk structure including the effects of heating by UV excess emission and X-rays (Nomura & Millar 2005; Nomura et al. 2007) and a chemical network similar in complexity to the work of Willacy & Woods (2009), excluding deuterium. Several works have also concentrated solely on water production in the inner regions of protoplanetary disks (Glassgold et al. 2009; Bethell & Bergin 2009; Meijerink et al. 2009; Woitke et al. 2009; Ádámkovics et al. 2014; Du & Bergin 2014); however, to date, there has been no detailed study of chemistry in the inner regions of M dwarf nor Herbig Ae stars, especially to address the trends seen in the C2H2/HCN line ratios.
In this work, we compute the physical and chemical structure of the planet-forming region (≲10 AU) of a protoplanetary disk around stars of different spectral types: (i) an M dwarf star, (ii) a T Tauri star, and (ii) a Herbig Ae star. Our aim is to investigate whether the stellar radiation field plays a role in the observed trends in C2H2/HCN and OH/H2O ratios derived from the mid-IR observations. Given the proposed importance of N2 photodissociation for the formation of HCN, we investigate the effect of N2 self shielding using recently computed shielding functions (Li et al. 2013a) on the subsequent nitrogen chemistry. We also use these models to probe the connection between the “observable” gas emission from the disk atmosphere (at near- to mid-IR wavelengths) with the chemical composition of the midplane within which forming planets and planetesimals sweep up the bulk of their elemental building blocks.
The remainder of the paper is structured as described. In Sect. 2, we outline the methods for computing the disk physical and chemical structure, in Sect. 3 we present our results, and in Sects. 4 and 5, we discuss the implications of this work and summarise the main results, respectively.
Star and disk parameters.
 |
Fig. 1 FUV radiation fields at a distance of 1 AU from the central star (see text for details). |
2. Protoplanetary disk models
2.1. Physical model
The physical structure of each disk model is calculated using the methods outlined in Nomura & Millar (2005) with the addition of X-ray heating as described in Nomura et al. (2007). Because the methodology is covered in detail in a series of previous publications (see, e.g., Nomura & Millar 2005; Nomura et al. 2007; Walsh et al. 2010, 2012, 2014), here, we highlight the important parameters only.
For each disk model, we assume the disk is steady, axisymmetric, and in Keplerian rotation about the central star. We parametrise the kinematic viscosity via the dimensionless α parameter which scales the maximum size of turbulent eddies by the disk scale height, H, and the sound speed of the gas, cs, i.e., ν ≈ αHcs. For protoplanetary disks, α ≈ 0.01. We model the structure of a disk surrounding a star of three different spectral types: an M dwarf star, a T Tauri star, and a Herbig Ae star. We list the stellar mass, M⋆, stellar radius, R⋆, and effective temperature, T⋆, of each host star in Table 1. We also list the adopted mass accretion rate of each star-disk system, Ṁ, and the gas mass surface density at 10 AU, Σ10 AU. We assume the T Tauri and Herbig Ae systems have a mass accretion rate typical for pre-main-sequence stars, ~10-8 M⊙ yr-1. Because the accretion signatures from lower-mass stars are not as strong as for the higher-mass systems, we assume a lower accretion rate for the M dwarf system, ~10-9 M⊙ yr-1 (see, e.g., Herczeg & Hillenbrand 2009). We calculate the dust temperature assuming local radiative equilibrium between the absorption and reemission of radiation by dust grains. For the calculation of the FUV extinction by dust grains, we adopt a dust-grain size distribution which replicates the extinction curve observed in dense clouds (Weingartner & Draine 2001). We calculate the gas temperature assuming detailed thermal balance between the heating and cooling of the gas. We include heating via photoelectric emission from dust grains induced by FUV photons and heating due to the X-ray ionisation of H atoms. The cooling mechanisms included are gas-grain collisions and line transitions. The radiation field of each star is simulated as a black body at the stellar effective temperature (as listed in Table 1) with UV excess emission scaled to the relative mass accretion rates for the M dwarf and T Tauri disks. The stellar FUV (912−2100 Å) radiation field at 1 AU is shown in Fig. 1 for all three central stars. The UV excess emission has two components derived from a best-fit model of the observed TW Hya spectrum: a diluted black-body spectrum to simulate bremsstrahlung emission (Tbr ~ 25 000 K) and Lyman-α line emission. The Lyman-α line is modelled as a Gaussian with a width ≈2 Å and the peak flux is determined assuming a line/continuum luminosity ratio of 103 (see Nomura & Millar 2005, and references therein). Because young stars also exhibit strong X-ray emission, we use a TW Hya-like X-ray spectrum (generated by fitting the observed XMM-Newton spectrum) for the M dwarf and T Tauri stars, with a total luminosity, Lx~ 1030 erg s-1 (Preibisch et al. 2005) and assume Lx ≈ 3 × 1029 erg s-1 and Tx ≈ 1.0 keV for the X-ray spectrum of the Herbig Ae star (see, e.g., Zinnecker & Preibisch 1994; Hamaguchi et al. 2005).
2.2. Chemical model
The network we use to calculate the disk chemical evolution includes gas-phase reactions, gas-grain interactions (freezeout and desorption), and grain-surface chemistry.
2.2.1. Gas-phase network
The basis for the gas-phase chemistry is the complete network from the recent release of the UMIST Database for Astrochemistry (UDfA) termed “Rate12” which is publicly available1 (McElroy et al. 2013).Rate12 includes gas-phase two-body reactions, photodissociation and photoionisation, direct cosmic-ray ionisation, and cosmic-ray-induced photodissociation and ionisation. In this work, the photodissociation and photoionisation rates are calculated by integrating over the specific reaction cross section for each species and the calculated FUV spectrum at each point in the disk (Walsh et al. 2012) using the cross sections from van Dishoeck et al. (2006). Similar to previous work, we have supplemented this gas-phase network with direct X-ray ionisation reactions and X-ray-induced ionisation and dissociation processes (as described in Walsh et al. 2012, and see Sect. 2.2.5). We have also added a set of three-body reactions compiled for use in combustion chemistry models2 (see, e.g., Baulch et al. 2005) which are necessary because three-body processes become increasingly important in the inner disk region where the density and temperature are sufficiently high (≳1010 cm-3 and ≳1000 K). We have also included at least one collisional dissociation reaction (AB + M → A + B + M) for all neutral species expected to be abundant in the inner disk. We include a small chemical network involving vibrationally excited, or “hot”, H2. For each gas-phase neutral-neutral reaction involving H2 which also possesses an activation barrier, we include a duplicate reaction involving hot H2 with a barrier reduced by the internal energy of the excited H2 (≈30 163 K, see, e.g., Bruderer et al. 2012, and references therein).
2.2.2. Gas-grain interactions
We allow the freezeout (adsorption) of molecules on dust grains forming ice mantles and the desorption (sublimation) of ices via thermal desorption and photodesorption (Tielens & Hagen 1982; Hasegawa et al. 1992; Walsh et al. 2010, 2012). We adopt the set of molecular binding energies compiled for use in conjunction with Rate12 (McElroy et al. 2013). We have updated the binding energies in light of recent measurements for HCN (Noble et al. 2012). To simplify the calculation of the gas-grain interaction rates, we assume compact spherical grains with a radius of 0.1 μm and a fixed density of ~10-12 relative to the gas number density. Each grain thus has ~106 surface binding sites. We include photodesorption by both external photons and photons generated internally via the interaction of cosmic rays with H2 molecules. We use experimentally determined photodesorption yields where available (see, e.g., Öberg et al. 2009a,b,c). For all other species we use a yield of 10-3 molecules photon-1. In the calculation of the freezeout rates, we assume a sticking coefficient, S ~ 1, for all species except H, for which we use a temperature-dependent expression which takes into account both physisorption and chemisorption and describes the decreased sticking probability at higher temperatures (Sha et al. 2005; Cuppen et al. 2010b). We assume the rate of H2 formation equates to half the rate of arrival of H atoms on dust grain surfaces.
2.2.3. Grain-surface network
For completeness, we also supplement our reaction scheme with grain-surface association reactions extracted from the publicly available Ohio State University (OSU) network3 (Garrod et al. 2008). For those species important in grain-surface chemical reaction schemes, e.g., the CH3O radical, which are not included in Rate12, we also extract the corresponding gas-phase formation and destruction reactions from the OSU network. The grain-surface network has been further updated to include all studied routes to water formation under interstellar and circumstellar conditions (Cuppen et al. 2010a; Lamberts et al. 2013). The grain-surface reaction rates are calculated assuming the Langmuir-Hinshelwood mechanism only, and using the rate-equation method as described in Hasegawa et al. (1992). We limit the chemically “active” zone to the top two monolayers of the ice mantle. We assume the size of the barrier to surface diffusion is 0.3× the binding energy; in this way, volatile species diffuse at a faster rate than strongly bound species. This value lies at the optimistic end of the range determined by recent off-lattice kinetic Monte Carlo simulations of surface diffusion of CO and CO2 on crystalline water ice (Karssemeijer & Cuppen 2014). This allows the efficient formation of complex organic molecules via radical-radical association reactions at ≳20 K (see, e.g., Vasyunin & Herbst 2013; Walsh et al. 2014). For the lightest reactants, H and H2, we use either the classical diffusion rate or the quantum tunnelling rate depending on which is fastest (see, e.g., Tielens & Hagen 1982; Hasegawa et al. 1992). For the latter rates, we follow Garrod & Pauly (2011) and adopt a rectangular barrier of width 1.5 Å. We also include reaction-diffusion competition in which the reaction probability is determined by the relative rates between the barrier-mediated reaction and thermal diffusion (see, e.g., Chang et al. 2007; Garrod & Pauly 2011). Although still relatively simplistic, this takes into account the increased probability of reaction in the limit where the thermal diffusion of the reactants away from a common binding site is slow compared with the barrier-mediated reaction rate.
2.2.4. Photodissociation
One further important process now included is a more robust description of the photodissociation rate of N2 which includes the effects of self shielding and mutual shielding by H and H2. N2 is important because it is thought to be the main nitrogen-bearing molecule in interstellar and circumstellar media. Self (and mutual) shielding occurs predominantly for those species which dissociate via line transitions and occurs when foreground material removes photons necessary for dissociation deeper into the cloud. In this way, the photodissociation rate of molecules which can self shield is reduced relative to the dissociation rates for those species which dissociate via the absorption of continuum photons only. H2 and CO are famous examples of molecules which can self shield (see, e.g., Federman et al. 1979; Glassgold et al. 1985; van Dishoeck & Black 1988; Lee et al. 1996). H2 also possesses line transitions which overlap with dissociative states of CO and N2 leading to shielding of CO and N2 by foreground H2, a process termed “mutual” shielding.
The inclusion of the self (and mutual) shielding of N2 is now possible due to the work by Li et al. (2013a) in which they present parametrised shielding functions calculated using a high-resolution model spectrum of N2. These shielding functions are publicly available for download4 to use in astrochemical models. To use the computed shielding functions which are parametrised in temperature and H, H2, and N2 column density, one needs to a priori calculate the foreground column densities of each species. In protoplanetary disk models this is not trivial because the dissociating radiation can have multiple sources (e.g., stellar photons and interstellar photons). In addition, the chemistry needs to be calculated in series (from the inside outwards and from the surface downwards) rather than in parallel which can significantly increase computation time. For these reasons, a more pragmatic approach is adopted here, similar to that used in Visser et al. (2011): an “effective” shielding column is calculated based on the calculated FUV integrated flux relative to that assuming no intervening material. The FUV extinction, τUV, is given by ![Mathematical equation: \begin{equation} \tau_\mathrm{UV}(R,Z) = - \ln \left [ \frac{G_\mathrm{UV}(R,Z)}{G_\star(R,Z)+ G_\mathrm{ext}} \right ], \\ \end{equation}](/articles/aa/full_html/2015/10/aa26751-15/aa26751-15-eq57.png) (1)where GUV(R,Z) and G⋆(R,Z) are the calculated and the geometrically diluted unattenuated stellar FUV integrated fluxes at a grid point (R,Z), and Gext is the external unattenuated FUV flux. The effective visual extinction is related to the UV extinction via the empirical relation,
(1)where GUV(R,Z) and G⋆(R,Z) are the calculated and the geometrically diluted unattenuated stellar FUV integrated fluxes at a grid point (R,Z), and Gext is the external unattenuated FUV flux. The effective visual extinction is related to the UV extinction via the empirical relation,  ≈ τUV(R,Z) / 3.02 mag, and the “effective” H2 column density is calculated using,
  ≈ 0.5 × (1.59 × 1021) × cm-2 (Bohlin et al. 1978). For simplicity, the effective shielding column densities for N2 at each point in the disk are estimated by assuming N2 has a fixed (rather conservative) fractional abundance, ~10-5, with respect to H2. Finally, the photodissociation rate for N2 is given by,
 ![Mathematical equation: \begin{eqnarray} k_\mathrm{ph}^{N_2}(R,Z) \!= \! k_0^{N_2}(R,Z) \!\times\! \theta_{N_2} \left[N'_{H_2}(R,Z),N'_{N_2}(R,Z),T(R,Z) \right] \quad \mathrm{s}^{-1}, \end{eqnarray}](/articles/aa/full_html/2015/10/aa26751-15/aa26751-15-eq67.png) (2)where
(2)where  is the unshielded photodissociation rate for N2 and θN2 is the shielding function which is a function of H2 and N2 column density and temperature, T.
We adopt a similar method for the computation of the H2 and CO photodissociation rates using shielding functions calculated by Lee et al. (1996) and Visser et al. (2009), respectively.
2.2.5. X-ray-induced reactions
We include a set of X-ray-induced reactions which we duplicate from the existing set of cosmic-ray-induced reactions contained in Rate12 (McElroy et al. 2013). The reaction rates are estimated by scaling the cosmic-ray-induced reaction rate by the ratio of the local X-ray and cosmic-ray ionisation rates, i.e., kXR ≈ kCR × (ζXR/ζCR). This is a common assumption in chemical models of X-ray irradiated environments (see, e.g., Maloney et al. 1996; Stäuber et al. 2005). The “secondary” X-ray ionisation rate, ζXR, is calculated at each grid point in the disk by taking into account the local X-ray spectrum and the explicit elemental composition of the gas (Glassgold et al. 1997). We also include a set of “primary” X-ray ionisation reactions (for further details see Walsh et al. 2012).
2.2.6. Initial Abundances
To generate a set of initial abundances for input into the disk model, we run a dark cloud model (Tgas = Tdust = 10 K, n = 104 cm-3, and AV = 10 mag). We use the low-metal elemental abundances from Graedel et al. (1982) supplemented with updated values for O, C, and N based on diffuse cloud observations: 3.2 × 10⁻⁴, 1.4 × 10⁻⁴, and 7.5 × 10⁻⁵ relative to total hydrogen nuclei density, respectively (Cardelli et al. 1991, 1996; Meyer et al. 1998). In this way, we begin the disk calculations with an appreciable ice reservoir on the grain mantle built up over the lifetime of the pre-stellar core prior to disk formation.
In Table 2 we list the abundances (with respect to total H nuclei density) of abundant C-, N-, and O-bearing species at times of 1.0, 3.2, and 10.0 × 10⁵ years. We limit the listed species to those which have an abundance ≳1% that of water ice, the dominant O-bearing species at late times (>105 years). Over the relatively large time steps listed, the trend from atomic to molecular gas can be seen, as can the freezeout of volatile species formed in the gas phase, such as CO and N2. Ice species formed in situ via hydrogenation of atoms on and within the grain mantle (CH4, NH3, and H2O) show a general trend of increasing abundance towards late times (~106 years) as does the abundance of CO2 ice which is formed primarily via the reaction between CO and OH. The behaviour of H2CO and CH3OH is more complex: although both are formed via the hydrogenation of CO ice, over time, processing of the ice by the cosmic-ray-induced UV field causes a depletion in CH3OH at late times in favour of H2CO.
The median relative ice abundances in dense, quiescent clouds measured in absorption against background stars is 100:31:38:4 for H2O:CO:CO2:CH3OH (Öberg et al. 2011). These values are also in line with those measured in low-mass protostellar envelopes which also include measurements for NH3 and CH4 (H2O:NH3:CH4 = 100:5:5, Öberg et al. 2011). We opt to use initial abundances at a time of 3.2 × 10⁵ years which corresponds to an ice ratio of 100:15:6:1 for H2O:CO:CO2:CH3OH and 100:7:22 for H2O:NH3:CH4. This is a compromise between the set of abundances at early and late times: at the former, the CO abundance is low compared with observations, whereas at the latter, the CH3OH abundance is low compared with observations. However, for the physical conditions in the inner disk, we expect the initial abundances to be important only in the midplane of the disk where the chemical timescales can be long compared with the disk lifetime.
Abundances with respect to total H nuclei density for the dark cloud model and used as initial abundances in the disk model.
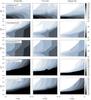 |
Fig. 2 Number density (top row), gas temperature (second row), dust temperature (middle row), FUV flux (forth row) and X-ray flux (bottom row) as a function of disk radius and disk height (scaled by the radius) for the M dwarf disk (left column), the T Tauri disk (middle column) and the Herbig Ae disk (right column). |
3. Results
3.1. Disk physical structure
In Fig. 2 we display the physical structure of each disk as a function of radius and height (scaled by the radius) for the M dwarf disk (left-hand column), T Tauri disk (middle column), and Herbig Ae disk (right-hand column). The lower density in the atmosphere of the Herbig Ae disk is because the scale height of the Herbig disk is smaller than that for the disks around the lower-mass stars ( , where cs and Ω are the sound speed and Keplerian angular velocity, respectively). The surface density of the M dwarf disk is around an order of magnitude lower than the other two objects; hence, the lower number density of gas throughout. In all three disks, the gas and dust temperatures decouple in the disk atmosphere such that the gas is significantly hotter than the dust. There are several general trends with increasing spectral type: (i) the gas and dust temperatures increase; (ii) the strength of the FUV flux in the disk surface increases; (iii) the strength of the X-ray flux in the disk surface decreases. For the M dwarf and T Tauri disks, the X-rays penetrate deeper into the disk atmosphere than the FUV photons. For all three disks, the midplane is effectively shielded from all sources of external radiation, including the central star and the interstellar radiation field. The increasing importance of viscous heating in the midplane is indicated by a temperature inversion below which the temperature begins to increase with depth (see the second and third rows of Fig. 2).
 |
Fig. 3 Fractional abundance relative to total gas number density of C2H2 (top row) and HCN (bottom row) for the M dwarf disk (left-hand column), T Tauri disk (middle column), and Herbig Ae disk (right-hand column). The dotted and dot-dashed lines indicate the dust column density (integrated from the surface downwards) at which τ ≈ 1 at 3 μm and 14 μm, respectively. |
 |
Fig. 4 Dominant reactions controlling the abundance of C2H2 and related species at the position of peak fractional abundance in the disk atmospheres at a radius of 1 AU. The solid lines indicate gas-phase two-body reactions and the dotted lines indicate UV or X-ray-induced reactions. The width of the arrows for the gas-phase reactions shows the magnitude of the activation barrier. The left-hand side, highlighted in red, is the chemistry most dominant in UV-dominated gas with a higher gas temperature (e.g., in Herbig Ae disks), whereas that highlighted in blue on the right-hand side is that which dominates in X-ray irradiated gas with a lower gas temperature (e.g., in X-ray irradiated M dwarf disks). |
3.2. C2H2 and HCN
3.2.1. Chemical structure
In Fig. 3 we display the fractional abundance with respect to gas number density of C2H2 and HCN as a function of disk radius, R, and disk height divided by radius, Z/R. The dotted and dot-dashed lines represent the τ = 1 surface at 3 and 14 μm, respectively. These are determined using the dust opacity table adopted in the computation of the disk physical structure. Throughout the remainder of the paper, we adopt the ad hoc definition of the disk atmosphere as the material above the τ(14 μm) = 1 surface.
As the stellar effective temperature increases, several trends are evident: (i) the disk molecular layer is pushed deeper into the disk atmosphere; (ii) the fractional abundances of C2H2 and HCN decrease in the atmosphere; and (iii) the extent over which both species reach a significant abundance increases in the disk midplane. C2H2 and HCN are relatively abundant in the molecular layer of the M dwarf disk reaching maximum fractional abundances of ≈5 × 10⁻⁶ and ≈5 × 10⁻⁵, respectively. The peak C2H2 fractional abundance in the molecular layer of the T Tauri disk is ≈1 × 10⁻⁷, whereas that for the Herbig Ae disk is negligible (<10-11). The peak HCN fractional abundance in the molecular layer for the T Tauri and Herbig Ae disks is around two (~10-7) and four (~10-9) orders of magnitude lower than that for the M dwarf disk. Thus, the model results suggest that the relative molecular complexity in the disk atmosphere decreases with increasing stellar effective temperature in line with increased photodestruction.
C2H2 reaches a relatively large fractional abundance (≳10-6) only in specific regions in the midplane of the T Tauri and Herbig Ae disks whereas in the M dwarf midplane it is much lower (≲10-9). In contrast, HCN reaches a relatively high fractional abundance (≳10-6) over a greater spatial extent when compared with C2H2. An apparent HCN “snow line” moves outwards as the disk midplane temperature increases (see Fig. 3). However, emission from midplane HCN at near- to mid-IR wavelengths is likely obscured by dust in the disk atmosphere as shown by the locations of the τ = 1 surface at 3 and 14 μm in Fig. 3.
3.2.2. Chemistry of C2H2 and HCN
A snapshot of the dominant chemical reactions controlling the abundance of C2H2 and HCN (and related species) in the disk atmosphere is given in Figs. 4 and 5, respectively. The reactions shown are those which contribute ≳ 10% to the formation and destruction rates at the position of peak fractional abundance in the atmosphere at a radius of 1 AU. The networks are similar to those presented in Agúndez et al. (2008) and Bast et al. (2013) except that we also include the dominant destruction mechanisms.
Free carbon and nitrogen (necessary for incorporation into molecules and radicals such as CH, NH, CN, and C2) are released from the main gas-phase reservoirs (CO and N2) via photodissociation for the Herbig Ae disk. For the two cooler disks, both X-ray-induced dissociation and reactions with He+ (which itself is produced by direct X-ray ionisation) are dominant. Many reactions involving He+ have measured rate coefficients (Adams & Smith 1979; Anicich et al. 1977).
Whether or not a molecule survives in the disk atmosphere with an appreciable abundance requires a delicate balance between formation (via neutral-neutral chemistry or ion-molecule chemistry) and destruction (via photodissociation or X-ray-induced dissociation). The abundance and distribution of HCN in the atmosphere of all three disks is primarily controlled by formation via H2 + CN (Baulch et al. 1994), and destruction via photodissociation (van Dishoeck et al. 2006). In the Herbig Ae disk, destruction via reaction with atomic hydrogen also plays a minor role. This reaction has a large reaction barrier (12 500 K, Tsang & Herron 1991) and is only significant in very hot gas (≳1000 K). CN has numerous formation routes via neutral neutral reactions: N + C2 (Smith et al. 2004), NH + C (Brownsword et al. 1996), and NO + C (Chastaing et al. 2000) where NO is formed via the reaction, N + OH (Wakelam et al. 2012). Only the formation of NH (via N + H2) possesses a substantial reaction barrier (18 095 K, McElroy et al. 2013).
For the M dwarf and T Tauri disks, photodissociation at Lyman-α is more significant than that by the FUV continuum background because around 70−80% of the FUV flux is contained in the Lyman-α line (see also Fogel et al. 2011). This percentage is in line with that determined towards observations of M dwarf and classical T Tauri stars (see, e.g., France et al. 2013, 2014). HCN is treated as though it photodissociates via line transitions (see, e.g., Lee 1994) and it also has a non-negligible photodissociation cross section at 1216 Å (σ = 3× 10-17 cm2, van Dishoeck et al. 2006).
HCN is relatively more abundant in the M Dwarf disk due to the weaker FUV flux leading to decreased destruction via photodissociation. Ion-molecule reactions also contribute to HCN formation in the M dwarf disk (via HCNH+ + e−) and destruction (via HCN + X+, where X+ is H+, C+, H , H3O+, and He+) as shown in Fig. 5. These reactions all have measured rate coefficients (Huntress 1977; Clary et al. 1985; Anicich et al. 1993; Semaniak et al. 2001). X-ray-induced photodissociation also contributes to the destruction of HCN at the level of 15−20%. The ion-molecule formation route is triggered by the formation of CN+ and HCN+ via the reactions, N + CH+, NH + C+, and N + CH
 (Viggiano et al. 1980; Prasad & Huntress 1980). HCN+ and HCNH+ are then formed via CN+ + H2 and HCN+ + H2 (Raksit et al. 1984; Huntress 1977).
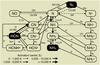 |
Fig. 5 Dominant reactions controlling the abundance of HCN and related species at the position of peak fractional abundance in the disk atmospheres at a radius of 1 AU. The solid lines indicate gas-phase two-body reactions and the dotted lines indicate UV or X-ray-induced reactions. The width of the arrows for the gas-phase reactions shows the magnitude of the activation barrier. |
In all cases, midplane gas-phase HCN is synthesised via neutral-neutral chemistry: it is not related to the desorption of HCN ice as is the case for traditional snow lines. The abundance is mediated by formation via H2 and CN and destruction via collisional dissociation (Baulch et al. 1994; Tsang & Herron 1991). This formation route has a reaction barrier of 820 K and thus requires warm temperatures for activation (>200 K). These temperatures are surpassed in the midplane of each disk due to the inclusion of heating via viscous dissipation (for details see Nomura & Millar 2005, and references therein). Viscous heating dominates over stellar heating in the midplane within radii of ≈0.40, 2.5, and 1.1 AU for the M dwarf, T Tauri, and Herbig Ae disks, respectively. The Herbig Ae transition radius is less than that for the T Tauri disk because the former has significantly stronger stellar heating.
 |
Fig. 6 Column density of C2H2 (top row) and HCN (bottom row) as a function of radius for each disk model for the entire vertical extent of the disk (left-hand column) and down to the τ = 1 surface at 14 μm (right-hand column). The solid coloured and hatched regions indicate the range of observed values for the T Tauri (Carr & Najita 2011; Salyk et al. 2011) and M dwarf (Pascucci et al. 2013) disks, respectively. |
In Fig. 4, a snapshot of the chemistry of C2H2 is presented. In all three disks, the formation and destruction of C2H2 in the atmosphere is dominated by the neutral-neutral reaction H2 + C2H (Laufer & Fahr 2004) and photodissociation (van Dishoeck et al. 2006), respectively. C2H2 is also preferentially photodissociated at Lyman-α wavelengths in both cases (σ≥ 4 × 10-17 cm2, van Dishoeck et al. 2006), for similar reasons as discussed above for HCN. In the M dwarf disk, C2H2 is also destroyed via reactions with C, H, and He+ (Kim & Huntress 1975; Chastaing et al. 1999; Laufer & Fahr 2004), as well as via X-ray-induced photodissociation (at the level of ≈15−20%). There are also formation routes via ion-molecule chemistry (C2H + e−) which contribute at the level of a few percent and are barrierless.
C2H2 is significantly less abundant in the atmosphere of the Herbig Ae disk than in the other two disks. In the absence of efficient ion-molecule pathways (triggered by the formation of C+ via CO + He+), an important first step in the formation of carbon-chain molecules is the formation of CH via C + H2 which has a large reaction barrier (11 700 K). CH can then react barrierlessly with atomic C to give C2. In the atmospheres of protoplanetary disks, the gas temperature is controlled by the strength of the UV field. Carbon-chain growth is impeded in the atmosphere of the Herbig Ae disk because the increased photodissociation counteracts the temperature-activated gas-phase chemistry. In Fig. 4, we split the carbon chemistry into that dominated by UV radiation (and a higher gas temperature) highlighted in red on the left-hand side, and that dominated by X-ray radiation (and a lower gas temperature) highlighted in blue on the right-hand side. The left-hand side represents the chemistry more dominant in Herbig Ae disks and the right-hand side represents the chemistry more important in M dwarf disks. The chemistry tends towards the middle of this reaction scheme in environments where the UV radiation is too strong for the survival of species other than CO, C, and C+.
In summary, the gas-phase chemistry depends, not only on the strength of the FUV radiation (which controls the gas temperature), but also on the adopted ionisation sources and spectra and corresponding rates propagated throughout the disk. This is especially true for the M dwarf disk in which ion-molecule chemistry also plays a role in the formation and destruction of HCN and C2H2 as shown in Figs. 4 and 5. The liberation of free carbon and nitrogen is the principle underlying reason for the importance of X-ray chemistry.
3.2.3. Column densities
A higher C2H2 and HCN fractional abundance is seen in the M dwarf disk atmosphere compared with the others; however, this does not necessarily translate into an observable column density, especially given the more tenuous nature of the M dwarf disk and the fact that the molecules peak in fractional abundance higher in the disk atmosphere (where the density is also lower). Figure 6 displays the vertically integrated column densities of both species as a function of disk radius over the entire vertical extent (left-hand column) and down to the τ = 1 surface at 14 μm (right-hand column). There is a general trend that the column density peaks at inner radii, then falls off sharply at a particular radius which moves outwards with increasing stellar spectral type. This fall off occurs at a smaller radius for C2H2 than for HCN. This behaviour is also seen in the T Tauri model presented in Agúndez et al. (2008).
For C2H2, the T Tauri and Herbig Ae disks achieve a similar peak column density ~1020 cm-2 at radii of ≈0.2 and 0.3 AU respectively. The column density then falls with increasing radius to ≲1017 cm-2 beyond 0.5 AU for the T Tauri star and beyond 1 AU for the Herbig Ae star. The total column density for the M dwarf disk lies orders of magnitude lower, reaching a peak value of ~1017 cm-2 at 0.1 AU and falling to ≲1015 cm-2 beyond 1 AU. Comparing with the column densities calculated down to the τ(14 μm) = 1 surface, for the two warmer disks, the values are lower by between three and four orders of magnitude because the total column density is dominated by midplane C2H2. In contrast, the values for the M dwarf disk remain comparable beyond ≈1 AU because in this case, the total column is dominated by atmospheric C2H2. The M dwarf disk has a larger column density in the atmosphere than the T Tauri disk beyond 0.2 AU. Although C2H2 does not appear to be abundant in the atmosphere of the Herbig Ae disk (according to Fig. 3), there is still a significant column density: this is because there is a thin layer (only one to two grid cells wide) of relatively abundant C2H2 which overlaps with the τ = 1 surfaces. This is likely a feature of the grid resolution of our model and thus is a numerical artefact.
For HCN, the T Tauri and Herbig Ae disks reach a peak column density of ~1021 cm-2 at similar radii to those for C2H2. The radial behaviour of the column density then follows the spatial extent of HCN in the disk midplane (see Fig. 3). Similar to C2H2, the peak value for the M dwarf disk is lower (~1020 cm-2 at 0.1 AU), and the column density remains constant beyond ≈0.8 AU at a few ×1015 cm-2. For the corresponding values down to the τ(14 μm) = 1 surface, the M dwarf disk has a higher column density than the T Tauri and Herbig Ae disks beyond 0.6 AU and 4 AU, respectively. Although the fractional abundance of HCN is lower in the Herbig Ae disk, the molecular layer is located deeper in the disk atmosphere where the density is higher leading to the apparently large calculated column density of HCN (for R< 4 AU).
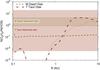 |
Fig. 7 Ratio of C2H2 and HCN column densities in the disk atmosphere as a function of radius for the M dwarf disk (gold dotted lines) and T Tauri disk (red dashed lines). The solid coloured and hatched regions correspond to the range of observed values for T Tauri (Carr & Najita 2011; Salyk et al. 2011) and M dwarf (Pascucci et al. 2013) disks, respectively. The thick and fine lines represent the ratios down to the τ = 1 surface at 14 and 3 μm. |
 |
Fig. 8 Fractional abundance relative to total gas number density of OH (top row) and H2O (bottom row) for the M dwarf disk (left-hand column), T Tauri disk (middle column), and Herbig Ae disk (right-hand column). The dotted and dot-dashed lines indicate the dust column density (integrated from the surface downwards) at which τ ≈ 1 at 3 μm and 14 μm, respectively. |
3.2.4. Comparison with observed trends
The preferred method for comparing model results with observations is the simulation of the line emission; however, this is a non-trivial matter involving careful consideration of collisional and radiative excitation in the IR (see, e.g., Pontoppidan et al. 2009; Meijerink et al. 2009; Thi et al. 2013; Bruderer et al. 2015). Moreover, the dust properties and size distribution (including, e.g., grain growth) become crucial for the calculation of the emitted spectrum (see, e.g., Meijerink et al. 2009). This is beyond the scope of the work presented here which is focussed on the chemistry; however, this is planned future work. Here, we compare the calculated column densities (and ratios) with those derived from observations to investigate if the chemical models are at least able to reproduce the observed abundances and related trends.
The C2H2/HCN column density ratio derived for disks around cool stars ranges from 0.87 to 4.3 (see Table 6 in Pascucci et al. 2013). In contrast, the C2H2/HCN column density ratios derived for T Tauri disks lies between 0.006 and 0.43 (see Table 4 in Carr & Najita 2011). Salyk et al. (2011) derive a range from 0.13 to 20 for their sample of T Tauri stars. In Fig. 7, the model ratios in the disk atmosphere are plotted as a function of radius for the T Tauri disk (red dashed lines) and M dwarf disk (gold dotted lines), overlaid with the observed range. The fine lines are the equivalent ratios for the column densities integrated down to the τ = 1 surface at 3 μm. The ratio is flat for the M dwarf disk (~0.1) and lies roughly one order of magnitude lower than the observed range (gold hatched zone). On the other hand, the ratio for the T Tauri disk increases with radius reaching a peak of ≈4. Also, the T Tauri ratios beyond 0.7 AU lie well within the wide range of observed values (red shaded zone).
For HCN, Carr & Najita (2011) derive best-fit column densities for their sample of T Tauri disks between 1.8 and 6.5 × 1016 cm-2; however, assuming extremes in the optical depth of the HCN emission expands this to between 0.2 and 31 × 1016 cm-2. For C2H2, the derived range is 0.02 to 1.6 × 1016 cm-2. Salyk et al. (2011) derive column densities between 0.05 and 0.63 × 1016 cm-2 and between 0.05 and 1.0 × 1016 cm-2 for HCN and C2H2 respectively. The observed column density ranges are indicated by the solid colour regions in Fig. 6. The T Tauri model results give good agreement with both the absolute column densities and the ratio of C2H2/HCN in the vicinity of the radius within which the observed emission originates.
In the inner region of the disk (≲2 AU), the models qualitatively reproduce the trend that the C2H2/HCN ratio is higher in M dwarf disks than in T Tauri disks; however, the ratio predicted in the model lies lower than that observed. Hence, the M dwarf model is either overpredicting the HCN column density or underpredicting the C2H2 column density. Pascucci et al. (2013) derive column densities ranging from 4.5 to 50.1 × 1016 cm-2 for C2H2 and from 1.1 to 18.1 × 1016 cm-2 for HCN. The range of observed column densities are indicted by the gold hatched regions in Fig. 6. The model values for C2H2 are more than one order of magnitude lower whereas the values for HCN lie within a factor of a few of the observed column densities. However, the absolute values will depend to a degree on the adopted model parameters, such as disk surface density. It is also possible that the excitation mechanisms for C2H2 and HCN differ in cool stars relative to T Tauri stars which means that the relative line emission no longer traces the relative abundances nor column densities. The excitation of HCN in protoplanetary disks was investigated in detail by Bruderer et al. (2015) who conclude that HCN abundances derived assuming LTE should differ by no more than a factor of three from those derived assuming non-LTE. They also conclude that C2H2 will behave similarly to HCN because of the presence of similar infrared bands through which the excitation can be pumped. We plan to test this via simulations of the molecular emission in future work.
Pascucci et al. (2013) speculate that the self-shielding of N2 may play a role in determining the C2H2/HCN ratio: this can potentially lock up a greater fraction of atomic nitrogen thereby impeding the production of other nitrogen-bearing species, such as HCN. Here, we have also shown that X-ray-induced chemistry may play an important role in both the production and destruction of molecules in the atmosphere of disks around cool stars. We further investigate the role of N2 self-shielding and X-ray-induced chemistry in Sects. 4.1 and 4.2, respectively.
3.3. OH and H2O
3.3.1. Chemical structure
Another interesting trend seen in the IR data is the lack of water detections in disks around hotter stars. In Fig. 8 we display the fractional abundance of OH (top row) and H2O (bottom row) as a function of radius (R) and height divided by the radius (Z/R). OH is more extended and resides in a layer slightly higher in the disk than HCN, C2H2, and H2O, in line with the hypothesis that the OH chemistry is driven by photodissociation. The peak fractional abundance of OH is 8, 5, and 4 × 10⁻⁵ for the M dwarf, T Tauri, and Herbig Ae disks, respectively. The corresponding values for H2O are 5, 5, and 4 × 10⁻⁴, again showing a general (albeit very shallow) decline in molecular complexity with increasing spectral type. The fractional abundance of OH is negligible (<10-11) in the midplane of all three disks. The extent over which H2O is abundant in the disk midplane is related to the thermal desorption of H2O ice (we assume a binding energy of 5570 K, Fraser et al. 2001). The H2O “snow line” shifts outwards in radius with increasing stellar spectral type with positions at 0.35, 1.5, and 6.1 AU for the M dwarf, T Tauri, and Herbig Ae disk, respectively. Beyond these radii, H2O is frozen out on dust grains in the midplane.
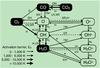 |
Fig. 9 Dominant reactions controlling the abundance of OH and H2O and related species at the position of peak fractional abundance in the disk atmospheres at a radius of 1 AU. The solid lines indicate gas-phase two-body reactions and the dotted lines indicate UV or X-ray-induced reactions. The width of the arrows for the gas-phase reactions shows the magnitude of the activation barrier. |
 |
Fig. 10 Column density of OH (top row) and H2O (bottom row) as a function of radius for each disk model for the entire vertical extent of the disk (left-hand column) and down to the τ = 1 surface at 14 μm (right-hand column). The solid coloured and striped regions indicate the range of observed values for the T Tauri (Carr & Najita 2011; Salyk et al. 2011) and Herbig Ae (Fedele et al. 2011; Salyk et al. 2011) disks, respectively. |
3.3.2. Chemistry of OH and H2O
Figure 9 shows a snapshot of the dominant reactions contributing to the formation and destruction of OH and H2O (and related species) at the position of peak abundance in the disk atmosphere at a radius of 1 AU. Gas-phase H2O is predominantly produced in the disk atmosphere via the neutral-neutral reaction, H2 + OH (using the rate coefficient from Oldenborg et al. 1992). In the cooler M dwarf disk, thermal desorption of water ice dominates at small radii (≈1 AU). Destruction is typically via photodissociation: for the M dwarf and T Tauri disks, this is again dominated by Lyman-α photons (van Dishoeck et al. 2006). In the M dwarf disk, there are additional destruction routes via ion-molecule reactions with H+ and H (Kim et al. 1974; Smith et al. 1992) and X-ray-induced photodissociation contributes at the level of 12−15% (similar to that found for C2H2 and HCN). Similarly, the gas-phase abundance of OH is mediated by production via the photodissociation of H2O and the reaction between H2 and O (Baulch et al. 1992), with destruction via photodissociation (van Dishoeck et al. 2006) and reactions with H2 and H (Tsang et al. 1986; Oldenborg et al. 1992). As in the case for H2O, dissociation by Lyman-α dominates over that by the background FUV continuum. This can be summarised in the following, rather succinct, reaction scheme,
![Mathematical equation: \begin{equation} O \xrightleftharpoons[H,\,h\nu]{H_2} OH \xrightleftharpoons[H,\,h\nu]{H_2} H_2O \xrightleftharpoons[\mathrm{desorption}]{\mathrm{freezeout}} H_2O_{\mbox{ice}} \label{waterformation} \end{equation}](/articles/aa/full_html/2015/10/aa26751-15/aa26751-15-eq119.png) (3)(see also Bethell & Bergin 2009; Woitke et al. 2009, and Fig. 9). Thus, the water chemistry in the disk atmosphere is rather simple with the relative abundances of O, OH, and H2O controlled primarily by the relative abundances of H and H2, the gas temperature (which needs to be sufficiently high to activate the neutral-neutral chemistry) and the strength of the FUV radiation field (necessary for photodissociation). We find that reactions with vibrationally excited or “hot” H2 (see Sect. 2.2.1) increase in importance towards the upper atmosphere. However, these reactions do not contribute significantly at the position of peak abundance and deeper and hence, do not influence the total column density of neither OH nor H2O. For a detailed review of water chemistry see van Dishoeck et al. (2013).
(3)(see also Bethell & Bergin 2009; Woitke et al. 2009, and Fig. 9). Thus, the water chemistry in the disk atmosphere is rather simple with the relative abundances of O, OH, and H2O controlled primarily by the relative abundances of H and H2, the gas temperature (which needs to be sufficiently high to activate the neutral-neutral chemistry) and the strength of the FUV radiation field (necessary for photodissociation). We find that reactions with vibrationally excited or “hot” H2 (see Sect. 2.2.1) increase in importance towards the upper atmosphere. However, these reactions do not contribute significantly at the position of peak abundance and deeper and hence, do not influence the total column density of neither OH nor H2O. For a detailed review of water chemistry see van Dishoeck et al. (2013).
3.3.3. Column densities
Figure 10 shows the vertically integrated column densities of OH (top row) and H2O (bottom row) as a function of radius over the entire vertical extent of the disk (left-hand columns) and down to the τ = 1 surface at 14 μm (right-hand column). The column densities show less structure compared with those for C2H2 and HCN. Because the majority of OH is in the disk atmosphere, the column densities for both cases are similar and range between a few times 1015 to 1017 cm-2. The OH column density also does not vary greatly with radius. The Herbig Ae disk generally has the largest column density and the M dwarf has the lowest, although the values for the T Tauri and M dwarf disks are similar beyond ≈1.6 AU. All three disks show very high total column densities of H2O (≳1021 cm-2) within each respective snow line. The H2O column densities also show a similar trend to that for C2H2 and HCN. The column densities start high in the inner disk then fall off sharply at a distinct radius for each disk (which moves outwards with increasing spectral type). This radius generally lies beyond that for C2H2 and HCN. Similar to the case for HCN, gas-phase H2O in the disk midplane is likely obscured by dust at near- to mid-IR wavelengths. The bottom right-hand panel shows that the column density of “visible” H2O is on the order of a few times 1019 cm-2 within the snow line for the T Tauri and Herbig Ae disks. The column density drops to ~1016 cm-2 beyond 1.5 AU for the T Tauri disk. The value for the M dwarf model remains constant over most of the radial extent of the disk at ~1017 cm-2.
3.3.4. Comparison with observed trends
Here, we compare the column densities calculated by the models with those derived from the observations to test whether the chemical calculations are able to reproduce the observed abundances and trends. For their sample of classical T Tauri stars in which both OH and H2O were detected, Salyk et al. (2011) derive OH column densities from 0.04 to 6 × 1016 cm-2. The H2O column densities range from 4 × 10¹⁷ to 1.8 × 1018 cm-2. Carr & Najita (2011) derive a wider range of values (4 × 10¹⁷ to 7.9 × 1020 cm-2). The observed ranges are indicated by the solid colour shaded regions in Figure 10. Despite the model T Tauri disk not being representative of any particular source, there is significant overlap between the calculated column densities in the disk atmosphere and observed values for both species.
For the Herbig Ae disks, only OH has been robustly detected at IR wavelengths (Fedele et al. 2012, with one exception discussed below). The range of observed column densities (derived from VLT/CRIRES data) lie between 1.3 and 20 × 1016 cm-2 and the model values lie within a factor of a few of this range (indicated by the striped region in Fig. 10, Fedele et al. 2011). The maximum model H2O column density in the disk atmosphere is more than an order of magnitude larger than the maximum upper limits derived by both Salyk et al. (2011) and Fedele et al. (2011). OH and H2O have been detected in the disk around HD 163296 in Herschel/PACS data at far-IR wavelengths with a relative column density of OH/H2O ≈ 1 and an excitation temperature ranging from 200−500 K (Fedele et al. 2012). However, this emission originates further out in the disk atmosphere (15−20 AU) than that expected at shorter wavelengths (see also the analysis in Fedele et al. 2013).
 |
Fig. 11 Ratio of OH and H2O column densities in the disk atmosphere as a function of radius for the T Tauri disk (blue dashed lines) and Herbig Ae disk (green dot-dashed lines). The solid coloured region corresponds to the range of observed values for T Tauri disks (Carr & Najita 2011; Salyk et al. 2011) and the green diamond and arrow indicates the ratio range observed for HD 163296 (Fedele et al. 2012). The thick and fine lines represent the ratios down to the τ = 1 surface at 14 and 3 μm. |
The Herbig Ae model appears to overproduce gas-phase water in the inner disk atmosphere relative to observations; however, the derived upper limits are dependent on the chosen emitting radius and gas temperature. Figure 11 shows the ratio of OH to H2O column density as a function of disk radius for the T Tauri model (blue dashed lines) and the Herbig Ae model (green dot-dashed lines). The fine lines represent the equivalent ratios for the columns integrated down to the τ(3 μm) = 1 surface. The model T Tauri ratios lie within the observed range for radii less than ≈1 AU. The ratio for the Herbig Ae model has a value ~10-3−10-2 within ≈ 8 AU, beyond which it increases and quickly tends to ≈1 at larger radii. The analysis of the non-detections of OH and H2O in Salyk et al. (2011) suggest a lower limit to the OH/H2O ratio of a few × 10-3 assuming an emitting radius which ranges from a few AU to several 10’s of AU. Fedele et al. (2011) suggest a ratio of > 1−25 within an emitting radius as far out as 30 AU based on near-IR data. The model values are on the cusp of the Salyk et al. (2011) lower limit in the very inner region and tend towards the Fedele et al. (2011) lower limit at 10 AU.
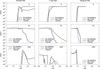 |
Fig. 12 Fractional abundance with respect to gas number density of N (top row), N2 (middle row), and HCN (bottom row) as a function of Z/R at R = 1 AU for each disk model. The black dashed lines, purple solid lines, and green solid lines represent results from the fiducial model (including N2 shielding and X-rays), the model with N2 switched off, and the model with X-rays switched off, respectively. |
The lack of hot water emission from the innermost regions of disks around Herbig Ae stars remains a puzzle, especially given the hypothesis that water can shield itself from photodissociation by the stellar radiation field at column densities, N(H2O) ≳ 2 × 1017 cm-2 (assuming a photodissociation cross section, σH2O ≈ 5 × 10-18 cm2; Bethell & Bergin 2009; Du & Bergin 2014; Ádámkovics et al. 2014). The column densities predicted here for the Herbig Ae disk are in line with those by other work (see, e.g., Woitke et al. 2009). One possible explanation is that turbulent mixing within the planet-forming region can help sequester water in the midplane where, if the temperature is sufficiently low, it can become trapped as ice on dust grains. This would require that as the dust grain grow, either via ice mantle growth or via coagulation, they become decoupled from the gas and remain in the shielded (and cold) midplane (see, e.g., Stevenson & Lunine 1988). There are two caveats to this theory: the first is that the temperature of the midplane would need to be below ≈150 K within ≈10 AU. The midplane temperature in our Herbig Ae model is generally too high for water to reside as ice on dust grains except beyond ≈6 AU (see Fig. 2); however, the exact temperature profile of the disk is sensitive to numerous factors including, for example, the adopted disk surface density, dust-grain size distribution, and degree of flaring (see later). It also remains to be demonstrated whether large-scale radial mixing between the warm inner midplane and cold outer midplane is a viable mechanism in disks around hotter stars. The second caveat is that one would expect the abundance of OH to also be affected by vertical mixing in the atmosphere since OH and H2O are chemically coupled. For a given radiation field, the rate coefficients for the primary routes to formation and destruction are known; hence, there may be additional destruction routes for gas-phase water, not yet included in the networks. One potential explanation which remains to be explored in protoplanetary disks is the effect of rotationally excited OH which can be produced via photodissociation of H2O at Lyman-α wavelengths (see, e.g., Fillion et al. 2001). The rate coefficient for the OH(v,j) + H reaction can be enhanced by several orders of magnitude relative to that for ground state OH (Li et al. 2013b). These reactions may be important for shifting the ratio of O/OH/H2O in the disk atmosphere (see Eq. (3)).
Pontoppidan et al. (2010) also extensively discuss several hypotheses for the lack of hot H2O in Herbig Ae disks; including (i) an intrinsically lower abundance by an, as yet, unknown physical or chemical mechanism; (ii) veiling of the molecular features by the strong mid-IR background (if the water line luminosity is a weaker function of stellar spectral type than the continuum); and (iii) a well-mixed disk atmosphere with the canonical gas-to-dust mass ratio of 100. The results presented here show that for a well-mixed atmosphere, the observable column density of water vapour remains high. However, a second outcome of grain growth in protoplanetary disks (in addition to that discussed above) is the greater penetration of FUV radiation which can push the molecular layer deeper into the disk atmosphere (see, e.g., Aikawa & Nomura 2006); hence, a higher fraction of the gas-phase water may be “hidden” from view. This remains to be confirmed specifically for the inner regions of disks. Another factor to consider, and mentioned previously, is the disk gas and dust structure. Disks around Herbig Ae/Be stars have been classified into groups based on the shapes of their SED at mid-IR wavelengths (Meeus et al. 2001). Group I disks are postulated to have a flared structure which allows the disk to capture more FUV photons which increases the gas and dust temperature throughout the disk, whereas group II disks are “flatter”, capture less FUV and are thus much colder. Dust grain growth and settling has been postulated as the reason behind the apparent dichotomy of Herbig Ae/Be disks (see, e.g., Dullemond & Dominik 2004) and it has also been suggested that group I disks may be transitional in nature, i.e., they have evidence (usually confirmed by spatially resolved imaging) of a significant gap in the inner disk (see, e.g., Grady et al. 2015). The disk model we have used assumes a flared disk in hydrostatic equilibrium without a gap: whether significant grain growth and the presence of an inner gap affects the abundance and distribution of gas-phase water remains to be explored.
4. Discussion
4.1. On the importance of N2 self shielding
To quantify the importance of N2 shielding in the disk atmosphere, in Fig. 12, we show the fractional abundance of N, N2, and HCN as a function of Z/R at R = 1 AU. An equivalent figure for R = 10 AU is shown in Fig. A.1. Results from three different models are presented: (i) the fiducial model (black dashed lines, with N2 shielding and X-rays included); (ii) a model without N2 shielding (purple lines); and (iii) a model without X-ray-induced chemistry (green lines). The inclusion of shielding has an affect on the relative abundances of N and N2 in a narrow region of the disk only at both 1 and 10 AU for all disks. The ratio of N/N2 is generally more affected as the central stellar effective temperature increases. Although the fractional abundance of atomic nitrogen can vary by more than one order of magnitude, this translates to a difference on the order of a factor of a few only for the HCN abundance. The results demonstrate that N2 shielding alone is not able to account for the change in C2H2/HCN column densities and line flux ratios seen from M dwarf to T Tauri stars.
 |
Fig. 13 Fractional abundance with respect to gas number density of C2H2 as a function of Z/R at R = 1 AU for the M dwarf and T Tauri disk models. The black dashed lines and orange solid lines represent results from the fiducial model (including N2 shielding and X-rays) and the model with X-rays switched off, respectively. |
The above conclusion holds for models in which the dust and gas are assumed to be well mixed. If a significant fraction of the dust has grown and settled to the midplane (see, e.g., Dominik et al. 2005), this can lead to a relatively dust-poor disk atmosphere and allow greater penetration of FUV radiation. In that case, the importance of molecular (or self) shielding increases relative to dust shielding (Visser et al. 2009; Li et al. 2013a). Whether the same conclusion holds for M dwarf disks with advanced grain growth and settling remains to be confirmed.
4.2. On the importance of X-ray-induced chemistry
In Fig. 12 (and Fig. A.1) models with and without X-ray-induced chemistry are also shown (black dashed lines versus green solid lines). X-ray-induced chemistry is significantly more important for the M dwarf and T Tauri disks than for the Herbig Ae disk. In both cases and at both radii, the abundance of N2 is significantly increased in the disk atmosphere when X-ray chemistry is neglected which leads to a decrease in the ratio of N/N2. The abundance of HCN is also significantly perturbed by the exclusion of X-ray chemistry. The abundance of HCN is increased in the disk atmosphere despite the reduction in available free nitrogen indicating that X-rays are important for HCN destruction even at heights where the FUV field is strong. The higher penetration depth of X-rays versus FUV photons allows an increase in N/N2 deeper into each disk and hence leads to an increase in HCN in the molecular layer (see also Aikawa & Herbst 1999). For the T Tauri disk at 1 AU, X-rays also help to destroy HCN deeper down towards the disk midplane.
The results show that the inclusion or exclusion of X-ray-induced chemistry can have a profound affect on the position and the value of peak fractional abundance of molecules such as HCN. To investigate whether carbon-bearing species are similarly affected, in Fig. 13, the fractional abundance of C2H2 is shown as a function of Z/R at a radius of 1 AU for both the M dwarf and T Tauri disks with and without X-ray-induced chemistry (black dashed lines and orange solid lines, respectively). The results show that X-rays are important in the disk molecular layer for releasing free carbon into the gas phase for incorporation into species such as C2H2. The inclusion of X-rays in the M dwarf disk increases the peak abundance of C2H2 by more than two orders of magnitude and increases the extent over which C2H2 is relatively abundant ≳10-9 with respect to gas number density. The results for the T Tauri disk are even more extreme with a three orders of magnitude increase in the peak fractional abundance from ≈ 10-11 to ≳10-8 when X-ray-induced chemistry is included.
As discussed in Sect. 3.2, the efficacy of the X-ray-induced chemistry is because of the generation of He+ which in turn reacts with those molecules robust to photodissociation, CO and N2. This creates a steady supply of free and reactive atomic atoms and ions for incorporation into other molecules via more traditional ion-molecule chemistry (see, e.g., Herbst 1995). C2H2 is more reliant on efficient ion-molecule chemistry for its formation than HCN because neutral-neutral pathways to carbon-chain growth have significant activation barriers (see Fig. 4). The barriers en route to HCN, in comparison, are lower (as discussed in Sect. 3.2). Thus, switching off X-ray chemistry has a larger effect on the magnitude of the peak abundance reached by C2H2 in the atmosphere as both ion-molecule and neutral-neutral pathways are inhibited in the cooler disks.
4.3. On the influence of initial nitrogen reservoirs
The results have so far suggested that X-ray-induced chemistry is crucial for efficient molecular synthesis in the disk atmosphere in the planet-forming regions of protoplanetary disks around cool stars. An additional scenario to consider is the effect of the assumed initial abundances at the beginning of the calculation. In the results presented thus far, a set of initial abundances from the output of a dark cloud model were used (see Table 2). The calculations begin with a ratio of N:N2:N2ice:NH3ice equal to 1.0:0.21:0.39:0.26. Taking inspiration from the recent work by Schwarz & Bergin (2014), we run an additional set of calculations in which we assume all species are in atomic form and (i) nitrogen is also in atomic form; (ii) nitrogen begins as N2 gas; (iii) nitrogen begins as N2 ice; and (iv) nitrogen begins as NH3 ice. In this way, we investigate the degree of chemical processing in the disk atmosphere for each initial nitrogen reservoir.
 |
Fig. 14 Fractional abundance with respect to gas number density of N2 (top row), NH3 (middle row), and HCN (bottom row) as a function of Z/R at R = 1 AU for each disk model. The black dashed lines, orange lines, cyan lines, green lines, and gold lines represent results from the fiducial model and a model in which (i) all species are initially atomic; (ii) all nitrogen is in N2 gas; (iii) all nitrogen is in N2 ice; and (iv) all nitrogen is in NH3 ice, respectively. |
In Fig. 14, the fractional abundances of gas-phase N2 (top row), NH3 (middle row), and HCN (bottom row) are shown as a function of Z/R at 1 AU. An equivalent plot for R = 10 AU is presented in Fig. A.2. The results show that the calculated abundances in the disk atmosphere (Z/R≳ 0.1) are independent of the form of the initial nitrogen reservoir at a radius of both 1 and 10 AU for all models. The chemistry in the disk atmosphere has achieved steady state by 106 years and has “forgotten” its origins. On the other hand, the abundances in the disk midplane are very sensitive to the initial nitrogen reservoir. The results for cases (ii) and (iii) show that similar abundances are achieved regardless of whether N2 begins in gas or ice form. At 1 AU the dominant factor is whether nitrogen begins as NH3 ice (case (iv)). Here, the abundance of N2 in the midplane is lower relative to the fiducial model with the difference increasing with increasing spectral type. Correspondingly, the abundance of gas-phase NH3 is significantly higher increasing by around one order of magnitude compared with the fiducial model. At the other extreme, beginning with all species in atomic form generates the lowest abundance of NH3 in the disk midplane, especially in the case of the M dwarf and T Tauri disks with differences between 1 and 6 orders of magnitude when compared with the model in which nitrogen begins as ammonia ice. NH3 ice is thought to be produced in situ on the surfaces of grains or on or within the ice mantle; hence, the efficiency of the conversion from atomic N to NH3 is very sensitive to temperature and a sufficient flux of both atomic N and H must reside on the surface for the reaction to proceed.
The initial nitrogen reservoir also has an effect on the midplane HCN abundance. For the T Tauri and Herbig Ae disks, at 1 AU, HCN reaches the highest abundance for the atomic model, followed by the model in which N begins as ammonia ice. Both models which have nitrogen initially in the form of N2 produce the lowest abundance of HCN in the disk midplane. The results at 10 AU show less spread except in the case of the Herbig Ae disk. NH3 and HCN are both significantly enhanced in the midplane for the model in which N begins as NH3 ice.
At elevated temperatures, HCN is formed via the reaction between H2 and CN (Baulch et al. 1994), the latter of which has various routes to formation via atomic nitrogen and nitrogen hydrides, e.g., N + CH or C + NH. Both examples are barrierless reactions (Brownsword et al. 1996; Smith et al. 2004; Daranlot et al. 2013). Conversely, reactions which directly produce CN or HCN from N2 (e.g., C + N2 or CH + N2) have large reaction barriers (≫10 000 K, Baulch et al. 1994; Rodgers & Smith 1996). In the dense, warm midplane, NH3 is more easily broken apart by cosmic-ray-induced photodissociation than N2 thus releasing nitrogen hydrides into the gas phase (Gredel et al. 1989; Heays et al. 2014). There is also a direct (and barrierless) route to HCN from NH3,  (4)(Sims et al. 1994). Hence, the nitrogen chemistry in the disk midplane (and resultant abundance and distribution of N-bearing molecules) is sensitive to whether nitrogen begins in the form of N2 or NH3 with the latter resulting in an increase in N-bearing species in the midplane.
4.4. Comparison with previous models
Astrochemical models of the inner regions of protoplanetary disks have often been neglected in favour of the outer disk (≫10 AU), motivated by the larger molecular inventory observed via emission at (sub)mm wavelengths (see, e.g., the recent review by Dutrey et al. 2014). However, focus will return to the planet-forming regions of protoplanetary disks driven by spatially-resolved observations of molecules at (sub)mm wavelengths with the ALMA Large Millimeter/Submillimeter Array (ALMA, see, e.g., Qi et al. 2013) and the launch of the James Webb Space Telescope (JWST) in 2018 (see, e.g., Gardner et al. 2006).
Early models of the planet-forming region spanned a wide range of complexity in both physics and chemistry and have primarily focussed on disks around T Tauri stars. Willacy et al. (1998) used a one-dimensional dynamical model to determine the chemical composition of the midplane from 0.1 to 100 AU. They used a chemical network which included gas-phase chemistry and gas-grain interactions (freezeout and desorption). They conclude that neutral-neutral chemistry is more important than ion-molecule chemistry for controlling the abundances in the midplane, similar to that found here. They also concluded that the chemical composition of the inner midplane was not dependent on the initial molecular abundances. This is a different conclusion to that presented here where we find that the composition of the initial ice reservoir plays a crucial role in the subsequent gas-phase chemistry; however, the model presented here uses a chemical network which is significantly more expansive than that adopted in Willacy et al. (1998) and includes grain-surface chemistry and ice mantle processing.
Markwick et al. (2002) calculated the two-dimensional chemical composition of the inner region assuming a disk heated internally by viscous heating only, and using a similar chemical network to that from Willacy et al. (1998). They also included a simple prescription for the X-ray ionisation rate throughout the vertical extent. In general, Markwick et al. (2002) compute significantly higher column densities for C2H2 than found in this work and they also do not produce OH in the disk surface layer. This is because they neglected photodissociation and photoionisation by photons originating from the central star and the external interstellar radiation field, processes that we find are important for governing the chemistry in the “observable” molecular layer in the inner regions.
More recently, Agúndez et al. (2008) explored the chemistry in the inner regions of a disk around a T Tauri star using a model similar to that adopted for photon-dominated regions (PDRs). They find similar conclusions to here: temperature-activated neutral-neutral chemistry helps to build chemical complexity in the disk atmosphere. However, we also find that X-ray driven chemistry is potentially very important for building additional complexity, by releasing free atomic (or ionic) carbon and nitrogen into the gas deeper into the disk atmosphere. Qualitatively, we see the same behaviour in the column densities in the disk atmosphere with radius: the column density starts higher then decreases at a radius specific to each molecule. C2H2 decreases first followed by HCN, then H2O. OH, on the other hand remains flat. The peak column densities calculated for C2H2 and HCN by Agúndez et al. (2008) (~1016 cm-2) are somewhat lower than those computed here for the T Tauri disk. We also find much larger column densities for both OH and H2O in the atmosphere. The reason for the particularly low OH column density is unclear but Agúndez et al. (2008) do neglect heating via UV excess emission from the star and also assume that the gas and dust temperatures are equal; whereas we find that the gas is significantly hotter than the dust in the region of the inner disk atmosphere where the molecules reside. The column densities that we calculate for OH and H2O for the T Tauri disk are also in line with those determined in the work by Bethell & Bergin (2009) and Glassgold et al. (2009); however, unlike Bethell & Bergin (2009), we do not consider dust grain settling and so do not need to invoke H2O self shielding as a mechanism for explaining the survival of gas-phase water in the disk atmosphere. It is interesting that Bethell & Bergin (2009) (and follow up work by Du & Bergin 2014) also predict an increase in column density of H2O in the disk atmosphere with increasing stellar FUV luminosity (and corresponding hardening of the radiation field).
 |
Fig. 15 Percentage contribution of the dominant molecular carriers to the total elemental oxygen, carbon, and nitrogen column densities, as a function of radius. |
 |
Fig. 17 C/O ratio as a function of radius for the total ice column density (left panel), the total gas column density (middle panel), and for the “observable” disk atmosphere only (right panel). The grey dashed line indicates the underlying C/O elemental ratio (0.44). |
4.5. A connection between the disk atmosphere and the planet-forming midplane?
Currently, the only means to probe the inner planet-forming regions of protoplanetary disks is via near- to mid-infrared observations. Future high-angular-resolution observations at (sub)mm wavelengths with ALMA may also elucidate the molecular composition of the inner region; however, due to the high column densities in the inner disk, dust opacity begins to affect even (sub)mm line emission. The higher sensitivity and spectral resolution of JWST will also allow the measurement of absorption features by gases and ices other than water in nearby edge-on protoplanetary disk systems.
Given that forming planets sweep up material primarily from the disk midplane, it is worth exploring to what degree the composition of the disk atmosphere reflects that of the midplane. During the planet-formation process, the molecules accreted (whether gas or ice) are ultimately reprocessed in the planet atmosphere. Recent population synthesis models suggest that the main contribution to the heavy element content in the atmospheres of forming planets are ices accreted during the formation of the planetary embryo and icy planetesimals which are captured during the gas accretion stage and vaporised in the atmosphere (see, e.g., Thiabaud et al. 2014).
In Fig. 15, the percentage contribution of each of the dominant molecular carriers of oxygen (top row), carbon (middle row), and nitrogen (bottom row) are plotted as a function of radius. In Fig. 16, we present the equivalent data for the disk atmosphere only. The dominant carriers are identified as those species which contribute most to the total column density of each element (for the data plotted in Fig. 15) and to the column density in the disk atmosphere, down to the τ(14 μm) = 1 surface (for the case of the data plotted in Fig. 16). The data identified as “Other” refers to the summation over all other species which contribute to the elemental abundance, but which individually do not contribute significantly. The identity of “Other” depends on the location in the disk and the particular disk model but are typically complex organic ices (e.g., H2CO, CH3OH, etc.) in the outer regions of the two cooler disks, and gas-phase hydrocarbons (e.g., CnHm) in the inner regions of the two warmer disks. For the most part, the plotted species contribute ≈90−100% to the total elemental abundance.
The dominant carriers throughout the vertical extent is set by the locations of snow lines: gas-phase H2O in the inner regions is superseded by H2O ice once the snow line is surpassed. An interesting result for the M dwarf disk is that CO2 ice carries most of the oxygen beyond ≈3 AU indicating an efficient conversion from H2O ice to CO2 ice on and within ice mantles. This is not seen in the two warmer disks because the higher temperatures make it difficult for CO to reside on the grains sufficiently long for reaction with OH. Beyond the H2O snowline, the dominant gas-phase carrier of elemental oxygen is CO: thus the gas-phase C/O ratio seemingly tends towards 1, whereas the ice mantle remains oxygen-rich. However, in each disk, there are regions where molecular oxygen has a non-negligible contribution to the total oxygen column, on the order of 10%. The two-dimensional fractional abundances of important gas-phase oxygen-bearing molecules not discussed in detail in the text, such as CO, O2, and CO2, are presented in Fig. A.3.
The dominant carbon carrier is CO; in the outer disk of the cooler M dwarf, CO2 ice and other complex organic ices such as CH3OH take over. In the inner region of the T Tauri and Herbig Ae disks, gas-phase CH4 and other hydrocarbons begin to contribute at the level of 30−40%: the physical conditions in the inner regions of the hotter disks are such that the chemistry tends towards thermochemical equilibrium in which hydrocarbons dominate over CO. In the outer regions of the two hotter disks, again either CO2 ice or gas also contributes at the level of 30%. For the disk around TW Hya, Bergin et al. (2014) suggest that gas-phase CO is an order of magnitude lower in abundance than that expected if 100% of the freely available (i.e., not contained in refractory material) elemental carbon were locked up in gas-phase CO. Our results for the M dwarf disk show a depletion in CO in the outermost regions consistent with this level of depletion; however, we find that significantly more carbon is contained in CO gas in the warmer disks (≈40−50%, at least within a radius of 10 AU).
The picture for nitrogen is more simple: in all cases, gas-phase N2 is the primary carrier. In the M dwarf disk, NH3 contributes at the level of 10% whereas in the two hotter disks, there is a region where the contribution from gas-phase NH3 approaches 50% which is temperature dependent. This is again because the conditions in the inner disk midplane approach thermochemical equilibrium. The low abundance of NH3 ice in this region suggests that planetary atmospheres which gain the bulk of their heavy elements from planetesimal accretion will be depleted in nitrogen relative to carbon and oxygen. The two-dimensional fractional abundances of important gas-phase nitrogen-bearing molecules not discussed in detail in the text, such as N2 and NH3, are presented in Fig. A.6.
In Fig. 16, the equivalent values for the disk atmosphere are plotted. For the oxygen carriers, the main difference is the increased contribution of gas-phase O2 to the oxygen budget in the atmosphere (up to ≈50%). Where O2 dominates the oxygen budget depends on the disk model, moving from the innermost regions of the M dwarf disk to the outermost region of the Herbig Ae disk. O2 is formed in the atmosphere via reaction between atomic oxygen and OH and destroyed via reaction with atomic hydrogen and carbon, with photodissociation increasing in importance as the spectral type of the star increases. Figure 9 shows the dominant formation and destruction mechanisms for O2 in the disk atmosphere, and the two-dimensional abundance distributions and column densities of atomic and molecular oxygen are given in the Appendix. Where O2 dominates, CO2 also makes a non-negligible contribution in the atmosphere (up to ≈30%).
The story for carbon is more simple: CO dominates in the disk atmosphere over much of the radial extent of all disks, with some contribution from CO2, as found for the full column values. In the two warmer disks, the gas-phase carbon carriers in the disk atmosphere switch to “Other”, in this case, various gas-phase hydrocarbons, CnHm, which is not representative of the total column. Gas-phase HCN also has a non-negligible contribution to both the carbon and nitrogen budget in the atmosphere (up to 30% and 60% respectively).
Similarly, gas-phase N2 dominates the nitrogen budget throughout most of the disk atmosphere; however, in the innermost regions of the two warmer disks, gas-phase NH3 and HCN take over. Again, this is not representative of the nitrogen budget throughout the disk vertical extent which is dominated by N2 (≈90%). In Fig. 5 we also show those reactions responsible for the formation and destruction of N2 and NH3 in the disk atmosphere.
In Fig. 17, the C/O ratio is plotted as a function of radius for three cases. Also plotted is the assumed underlying elemental ratio (C/O = 0.44, grey dashed lines). The left-hand panel shows the ratio when summed over the dominant ice reservoirs (H2O and CO2 ice). The ice is more oxygen rich than the underlying elemental ratio; however, for the two cooler disks, as CO2 begins to freezeout and/or form, the C/O ratio of the ice tends towards the underlying ratio. On the other hand, the gas is either representative of the elemental ratio or more carbon rich (as shown in the middle panel). The behaviour of the C/O ratio depends on the locations of the H2O and CO2 snow lines which move outwards with increasing stellar spectral type. When H2O ice freezes out and/or forms, the C/O ratio in the gas increases as oxygen is removed. Once CO2 ice begins to freeze out and/or form, the gas C/O ratio begins to decrease again and the ice correspondingly becomes relatively more carbon rich. This is most clearly seen for the M dwarf disk. In the final panel, the C/O ratio calculated using “observable” tracers only is shown (CO, CO2, H2O, C2H2, CH4, and HCN gas). Comparing the final panel with the middle panel, for the two cooler disks, the gas in the disk atmosphere appears significantly more carbon rich when calculated using just the listed tracers. Notably, the C/O ratio for the M dwarf disk appears ≳ 1 throughout most of the disk atmosphere (≳1 AU). This is primarily due to the presence of gas-phase O2 in the atmosphere which is another “hidden” reservoir of atomic oxygen (in addition to H2O ice and CO2 ice).
The chemical model results suggest that disks around cooler stars might appear more carbon rich without the need for additional sinks (neither chemical nor physical) to account for the depletion of oxygen. However, we stress that detailed radiative transfer calculations are necessary to confirm definitively whether the chemical models replicate the trends seen in the observations. Because this is a non-trivial calculation for a two-dimensional disk structure requiring careful consideration of the dust structure and size distribution, this is beyond the scope of the work presented here but is planned future work. Assuming that the trends in the chemical models do translate into trends in the simulated emission, the derivation of the C/O ratio using CO, CO2, H2O, CH4, C2H2, and HCN alone, may overestimate the underlying C/O ratio by up to a factor of two. Similarly, the C/N ratio may be overestimated by between one and several orders of magnitude if observations of HCN and NH3 in the disk atmosphere alone are used to determine the underlying C/N ratio. In the case that the dominant source of heavy elements in a planetary atmosphere is icy planetesimals rather than the gas, then this overestimation increases to a factor of 10. Although less extreme than the estimation of the C/N ratio, a factor of two is sufficient to incorrectly assume the formation of carbon-rich versus oxygen-rich planetary atmospheres, and the dominant carbon and oxygen carriers subsequently found therein (see, e.g., Madhusudhan et al. 2013).
4.6. On the abundance of O2 in protoplanetary disks
The models predict that gas-phase O2 is a significant oxygen reservoir in the inner regions of protoplanetary disks. O2 may contain up to 10% of the total available oxygen over the full vertical extent of the disk, and this increases to up to 50% when the disk atmosphere only is considered (see Figs. 15 and 16).
O2 has proven to be a somewhat elusive molecule in interstellar and circumstellar environments. Upper limits determined by Submillimeter Wave Astronomy Satellite (SWAS) and Odin towards nearby molecular clouds constrain O2/H2 ≲ 10-7 (Goldsmith et al. 2000; Pagani et al. 2003). On the other hand, ISO upper limits for the abundance of O2 ice in dark clouds are much more conservative (O2/H2O < 0.6, Vandenbussche et al. 1999). However, gas-phase O2 has been successfully detected towards two warmer sources, the dense core, ρ Oph A (Larsson et al. 2007; Liseau et al. 2012), and Orion (Goldsmith et al. 2011). Furthermore, Yildiz et al. (2013) report a deep Herschel-determined upper limit towards the low-mass Class 0 protostar, NGC 1333-IRAS 4A (O2/H2 < 6 × 10⁻⁹). The authors find that O2 is absent in both the outer cold envelope and inner hot core and conclude that the material entering protoplanetary disks is likely poor in molecular oxygen (gas and ice).
Early gas-phase only chemical models routinely overpredicted the abundance of O2 in dark clouds, which was postulated to form primarily via ion-molecule chemistry (see, e.g., Bergin et al. 2000). More modern and sophisticated gas-grain models are able to reproduce the low gas-phase abundance of O2 provided the conversion of O2 ice into H2O ice is included, and the chemistry is allowed to evolve for sufficiently long time scales (see, e.g., Bergin et al. 2000; Roberts & Herbst 2002; Yildiz et al. 2013). Recent laboratory experiments have shown that the hydrogenation of O2 ice is rapid at low temperatures (Ioppolo et al. 2008; Miyauchi et al. 2008).
The origin of gas-phase O2 in the inner regions of protoplanetary disks is different to that expected in dark clouds. In both cases, the vital reaction is formation via O + OH. This reaction has been well studied5 across the temperature range of interest for circumstellar environments. However, the origin of OH in dark clouds is via the dissociative recombination of H3O+ which is generated via successive proton-donation reactions originating from O + H. In the inner regions of disks, OH is generated via the reaction between O + H2, and atomic oxygen, in turn is released from CO via photodissociation, X-ray-induced dissociation, or via reaction with He+. O2 is destroyed via photodissociation and reactions with C and H to yield CO and OH, respectively (see Fig. 9). These latter two reactions have well-constrained rate coefficients (Geppert et al. 2000; Miller et al. 2005). Gas-phase O2 is able to persist in the disk atmosphere for the same reasons as gas-phase H2O: the gas temperature is sufficiently high to activate the required neutral-neutral chemical reactions. The model T Tauri disk generates column densities of OH and H2O in good agreement with those observed towards T Tauri stars (see Fig. 10); hence, given that the rate coefficients for the important reactions are well studied, the prediction that gas-phase O2 may also be relatively abundant in T Tauri disks is substantive.
5. Summary
In this work, the chemistry and resulting molecular composition of the planet-forming regions (<10 AU) of protoplanetary disks has been explored, with the aim to investigate potential reasons for the trends seen in near- to mid-infrared observations. The results demonstrate that, as the effective temperature of the central star increases, the molecular complexity of the disk atmosphere decreases, showing that the FUV luminosity of the host star plays an important role in determining the molecular composition of the disk atmosphere. The weaker FUV flux impinging upon disks hosted by M dwarf stars allows molecules to reach relatively high abundances in the atmosphere: X-ray-induced chemistry can further increase molecular complexity by driving a rich ion-molecule chemistry, helping to qualitatively explain the large column densities of small organic molecules, such as, C2H2 and HCN seen in M dwarf disk atmospheres. The key process is the liberation of free carbon and nitrogen from their main molecular reservoirs (CO and N2, respectively) via X-rays. The results shown here, in conjunction with the mid-IR observations, suggest that these objects are good targets for ALMA which can further help elucidate chemistry in disks towards the low-mass low-luminosity regime.
The chemical models suggest that the gas in the inner regions of M dwarf disks is generally more carbon rich than that in disks around T Tauri stars. When the C/O gas-phase ratio is calculated using only observable tracers in the disk atmosphere, then the ratio appears larger than it actually is (and C/O → 1). This is because the models predict that gas-phase O2 is a significant reservoir of oxygen in the disk atmosphere beyond the water snowline.
The results also demonstrate a degree of chemical decoupling between the disk atmosphere and the midplane. The gas is generally more carbon-rich than the midplane ices (see Fig. 17). This is further corroborated by our studies on the importance of the initial nitrogen reservoir (whether atomic nitrogen, molecular nitrogen, or ammonia). We find that this does not play a role in determining the resulting composition of the observable molecular layer: the chemistry is at steady state. However, the initial reservoir is important for determining the composition in the disk midplane where, generally, the chemical timescales are longer. For example, icy planetesimals forming in disks where much of the initial nitrogen is locked up in NH3 ice may be more nitrogen rich than those for which nitrogen was contained primarily in the more volatile N2 (see also Schwarz & Bergin 2014).
Whether the trends seen in the chemical models can reproduce those derived from observations remains to be confirmed via calculations of the molecular emission and will be conducted in future work. Assuming that the chemical trends do translate into observable trends, near- to mid-IR observations of the dominant tracers in the atmosphere may overestimate the underlying C/O and C/N ratios of the gas and ice in the region in which forming planets sweep up most of their material by up to a factor of 10 and more than an order of magnitude, respectively.
Despite the results qualitatively demonstrating some of the observed trends, several issues remain. The large column densities of water vapour and correspondingly strong water emission lines at near- to mid-IR wavelengths predicted by models of Herbig Ae disks have not been confirmed by observations, indicating that there may be a heretofore unconsidered destruction mechanism for gas-phase water at high temperatures. For example, reactions of rovibrationally excited OH with atomic hydrogen may shift the ratio of O/OH/H2O in the atmosphere. Alternative hypotheses are that the molecular line emission is veiled by the strong stellar continuum emission (as discussed in Pontoppidan et al. 2010) or that the disk dust structure plays an important role.
A further issue is that the M dwarf disk model predicts a C2H2/HCN ratio which is an order of magnitude lower relative to the observations. An increase in the underlying C/O or C/N elemental ratio in the disk atmosphere may help explain the high C2H2/HCN ratio in M dwarf disks with the enrichment in carbon relative to oxygen and nitrogen caused by vertical or radial mixing. In this scenario, less volatile species (e.g., H2O and NH3) are transported to regions where it is sufficiently cold for freezeout onto dust grains (see, e.g., Stevenson & Lunine 1988; Meijerink et al. 2009). If the ice-coated dust grains are sufficiently large, they become decoupled from the gas and settle to the disk midplane. In this way, the gas can become enriched in more volatile species, e.g., CO, which alters the underlying elemental balance of the atmosphere. However, as shown in the results here, molecular nitrogen (which is volatile) is significantly more abundant in the disk atmosphere than NH3. Hence, this mechanism is unlikely to enrich the disk atmosphere in carbon relative to nitrogen but perhaps the chemistry of nitrogen-bearing species is perturbed by the depletion of oxygen via this mechanism.
The gas-phase chemical network used for HCN and C2H2 is (to our knowledge) relatively complete, with experimentally measured and/or critically reviewed reaction rate coefficients used where available. We have shown that self-shielding of N2 alone is not sufficient to explain C2H2/HCN in the inner regions and has a more significant effect in disks around stars with a higher FUV luminosity. It remains to be confirmed whether this also holds for disks in which grain growth and settling have generated a relatively dust-poor atmosphere for which molecular shielding dominates over dust shielding. Instead, X-ray-induced chemistry is more important for releasing atomic nitrogen from N2 in the M dwarf disk. Furthermore, we find that the exclusion of X-ray-induced chemistry only increases the discrepancy with observation, because the formation of C2H2 is primarily driven by ion-molecule chemistry in the M dwarf disk atmosphere, as shown in Figs. 4 and 13. However, all chemical networks suffer from a degree of uncertainty; hence, a systematic sensitivity study of the relative abundance of these two species over the parameter space of physical conditions in protoplanetary disks around cool stars, is worthy of further exploration. This would also confirm the hypothesis presented here, that is, that X-ray chemistry is responsible for the higher C2H2/HCN ratio observed in cool stars.
We finish by stating that the future is bright for near- to mid-IR astronomy with Mid-InfraRed Instrument (MIRI, Wright et al. 2004) on JWST and METIS (Brandl et al. 2014), currently being developed for installation on the European Extremely Large Telescope (E-ELT). Both facilities will have significantly higher spectral resolution (~3000 and 100 000 respectively) across the wavelength range of interest for probing the molecular composition of the planet-forming regions of nearby protoplanetary disks.
Online material
Appendix A: Supplementary figures
In Figs. A.1 and A.2, we show results at a radius of 10 AU from the same models described in Figs. 12 and 14.
In Figs. A.3 to A.6 we show the fractional abundances
as a function of radius, R, and height scaled by the radius, Z/R, for those species not discussed in detail in the text. These include important oxygen- (e.g., O2, CO, and CO2), carbon- (e.g., CnHm) and nitrogen-bearing species (e.g., N2 and NH3).
 |
Fig. A.1 Fractional abundance with respect to gas number density of N (top row), N2 (middle row), and HCN (bottom row) as a function of Z/R at R = 10 AU for each disk model. The black dashed lines, purple solid lines, and green solid lines represent results from the fiducial model (including N2 shielding and X-rays), the model with N2 switched off, and the model with X-rays switched off, respectively. |
 |
Fig. A.2 Fractional abundance with respect to gas number density of N2 (top row), NH3 (middle row), and HCN (bottom row) as a function of Z/R at R = 10 AU for each disk model. The black dashed lines, orange lines, cyan lines, green lines, and gold lines represent results from the fiducial model and a model in which (i) all species are initially atomic; (ii) all nitrogen is in N2 gas; (iii) all nitrogen is in N2 ice, and (iv) all nitrogen is in NH3 ice, respectively. |
 |
Fig. A.3 Fractional abundance relative to total gas number density of oxygen-bearing species for the M dwarf disk (left-hand column), T Tauri disk (middle column), and Herbig Ae disk (right-hand column). The dotted and dot-dashed lines indicate the dust column density (integrated from the surface downwards) at which τ ≈ 1 at 3 μm and 14 μm, respectively. |
 |
Fig. A.4 Fractional abundance relative to total gas number density of carbon-bearing species for the M dwarf disk (left-hand column), T Tauri disk (middle column), and Herbig Ae disk (right-hand column). The dotted and dot-dashed lines indicate the dust column density (integrated from the surface downwards) at which τ ≈ 1 at 3 μm and 14 μm, respectively. |
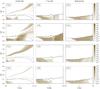 |
Fig. A.5 Fractional abundance relative to total gas number density of carbon-bearing species for the M dwarf disk (left-hand column), T Tauri disk (middle column), and Herbig Ae disk (right-hand column). The dotted and dot-dashed lines indicate the dust column density (integrated from the surface downwards) at which τ ≈ 1 at 3 μm and 14 μm, respectively. |
 |
Fig. A.6 Fractional abundance relative to total gas number density of nitrogen-bearing species for the M dwarf disk (left-hand column), T Tauri disk (middle column), and Herbig Ae disk (right-hand column). The dotted and dot-dashed lines indicate the dust column density (integrated from the surface downwards) at which τ ≈ 1 at 3 μm and 14 μm, respectively. |
Acknowledgments
The authors thank Drs. Alan Heays, Kenji Furuya, and Mihkel Kama for useful discussions and an anonymous referee for their insightful comments. C.W. acknowledges support from the European Union A-ERC grant 291141 CHEMPLAN and from the Netherlands Organisation for Scientific Research (NWO, program number 639.041.335). H.N. acknowledges the Grant-in-Aid for Scientific Research 23103005 and 25400229. She also acknowledges support from the Astrobiology Project of the CNSI, NINS (grant numbers AB261004, AB261008). A portion of the numerical calculations were carried out on SR16000 at YITP in Kyoto University.
References
- Acke, B., van den Ancker, M. E., & Dullemond, C. P. 2005, A&A, 436, 209 [NASA ADS] [CrossRef] [EDP Sciences] [Google Scholar]
- Ádámkovics, M., Glassgold, A. E., Najita, J. R. 2014, ApJ, 786, 135 [NASA ADS] [CrossRef] [Google Scholar]
- Adams, N. G., & Smith, D. 1976, Int. J. Mass Spectrom. Ion Phys., 21, 349 [NASA ADS] [CrossRef] [Google Scholar]
- Agúndez, M., Cernicharo, J., & Goicoechea, J. R. 2008, A&A, 483, 831 [NASA ADS] [CrossRef] [EDP Sciences] [Google Scholar]
- Aikawa, Y., & Herbst, Y. 1999, A&A, 351, 233 [NASA ADS] [Google Scholar]
- Aikawa, Y., & Nomura, H. 2006, ApJ, 642, 1152 [NASA ADS] [CrossRef] [Google Scholar]
- Anicich, V. G. 1993, J. Phys. Chem. Ref. Data, 22, 1469 [NASA ADS] [CrossRef] [Google Scholar]
- Anicich, V. G., Laudenslager, J. B., Huntress, W. T., & Futrell, J. H. 1977, J. Chem. Phys., 67, 4340 [NASA ADS] [CrossRef] [Google Scholar]
- Bast, J. E., Lahuis, F., van Dishoeck, E. F., & Tielens, A. G. G. M. 2013, A&A, 551, A118 [NASA ADS] [CrossRef] [EDP Sciences] [Google Scholar]
- Baulch, D. L., Cobos, C. J., Cox, R. A., et al. 1992, J. Phys. Chem. Ref. Data, 21, 411 [NASA ADS] [CrossRef] [Google Scholar]
- Baulch, D. L., Cobos, C. J., Cox, R. A., et al. 1994, J. Phys. Chem. Ref. Data, 23, 847 [NASA ADS] [CrossRef] [Google Scholar]
- Baulch, D. L., Bowman, C. T., Cobos, C. J., et al. 2005, J. Phys. Chem. Ref. Data, 34, 757 [NASA ADS] [CrossRef] [Google Scholar]
- Bethell, T., & Bergin, E. A. 2009, Science, 326, 1675 [NASA ADS] [CrossRef] [Google Scholar]
- Bohlin, R. C., Savage, B. D., & Drake, J. F. 1978, ApJ, 224, 132 [NASA ADS] [CrossRef] [Google Scholar]
- Bergin, E. A., Melnick, G. J., Stauffer, J. R., et al. 2000, ApJ, 538, L129 [NASA ADS] [CrossRef] [Google Scholar]
- Bergin, E., Cleeves, L. I., Crockett, N., & Blake, G. 2014, Faraday Discus., 168, 61 [Google Scholar]
- Brandl, B. R., Feldt, M., Glasses, A., et al. 2014, in SPIE Conf. Ser. 9147, eds. S. Ramsey, I. S. McLean, & H. Takami, 914721 [Google Scholar]
- Brownsword, R. A., Gatenby, S. D., Herbert, L. B., et al. 1996, J. Chem. Soc. Faraday Trans., 92, 723 [CrossRef] [Google Scholar]
- Bruderer, S., van Dishoeck, E. F., Doty, S. D., & Herczeg, G. J. 2012, A&A, 541, A91 [NASA ADS] [CrossRef] [EDP Sciences] [Google Scholar]
- Bruderer, S., Harsono, D., & van Dishoeck, E. F. 2015, A&A, 575, A94 [NASA ADS] [CrossRef] [EDP Sciences] [Google Scholar]
- Cardelli, J. A., Savage, B. D., & Ebbets, D. C. 1991, ApJ, 383, L23 [Google Scholar]
- Cardelli, J. A., Meyer, D. M., Jura, M., Savage, B. D. 1996, ApJ, 467, 334 [NASA ADS] [CrossRef] [Google Scholar]
- Carr, J. S., & Najita, J. R. 2008, Science, 319, 1504 [NASA ADS] [CrossRef] [PubMed] [Google Scholar]
- Carr, J. S., & Najita, J. R. 2011, ApJ, 733, 102 [NASA ADS] [CrossRef] [Google Scholar]
- Chang, Q, Cuppen, H. M., & Herbst, E. 2007, A&A, 469, 973 [NASA ADS] [CrossRef] [EDP Sciences] [Google Scholar]
- Chastaing, D., James, P L., Sims, I. R., & Smith, I. W. M. 1999, Phys. Chem. Chem. Phys., 1, 2247 [Google Scholar]
- Chastaing, D., Le Picard, S. D., & Sims, I. R. 2000, J. Chem. Phys., 112, 8466 [Google Scholar]
- Clary, D. C., Smith, D., & Adams, N. G. 1985, Chem. Phys. Lett., 119, 320 [NASA ADS] [CrossRef] [Google Scholar]
- Cuppen, H. M., Ioppolo, S., Romanzin, C., & Linnartz, H. 2010a, PCCP, 12, 12077 [Google Scholar]
- Cuppen, H. M., Kristensen, L. E., & Gavardi, E. 2010b, MNRAS, 406, L11 [NASA ADS] [Google Scholar]
- D’Alessio, P., Calvet, N., Hartmann, L., Franco-Hernández, R., & Sérvin, H. 2006, ApJ, 638, 314 [NASA ADS] [CrossRef] [Google Scholar]
- Daranlot, J., Hu, X., Xie, C., et al. 2013, Phys. Chem. Chem. Phys., 15, 13888 [NASA ADS] [CrossRef] [Google Scholar]
- Dominik, C., Blum, J., Cuzzi, J. N., & Wurm, G. 2007, Protostars & Planets V, 783 [Google Scholar]
- Dullemond, C. P., & Dominik, C. 2004, A&A, 417, 159 [NASA ADS] [CrossRef] [EDP Sciences] [Google Scholar]
- Du, F., & Bergin, E. A. 2014, ApJ, 792, 2 [NASA ADS] [CrossRef] [Google Scholar]
- Dutrey, A., Semenov, D., Chapillon, E., et al. 2014, Protostars & Planets VI, 317 [Google Scholar]
- Fedele, D., Pascucci, I., Brittain, S., et al. 2011, ApJ, 732, 106 [NASA ADS] [CrossRef] [Google Scholar]
- Fedele, D., Bruderer, S., van Dishoeck, E. F., et al. 2012, A&A, 544, L9 [Google Scholar]
- Fedele, D., Bruderer, S., van Dishoeck, E. F., et al. 2013, A&A, 559, A77 [NASA ADS] [CrossRef] [EDP Sciences] [Google Scholar]
- Federman, S. R., Glassgold, A. E., & Kwan, J. 1985, ApJ, 227, 466 [Google Scholar]
- Fillion, J. H., van Harrevelt, R., Ruiz, J., et al. 2001, J. Phys. Chem. A, 105, 11414 [CrossRef] [Google Scholar]
- Fogel, J. K. J., Bethell, T. J., Bergin, E. A., Calvet, N., & Semenov, D. 2011, ApJ, 726, 29 [NASA ADS] [CrossRef] [Google Scholar]
- France, K., Froning, C. S., Linsky, J. L., et al. 2013, ApJ, 763, 149 [NASA ADS] [CrossRef] [Google Scholar]
- France, K., Schindhelm, E., Bergin, E. A., Roueff, E., & Abgrall, H. 2014, ApJ, 784, 127 [NASA ADS] [CrossRef] [Google Scholar]
- Fraser, H. J., Collings, M. P., McCoustra, M. R. S., & Williams, D. A. 2001, MNRAS, 327, 1165 [NASA ADS] [CrossRef] [Google Scholar]
- Gardner, J. P., Mather, J. C., Clampin, M., et al. 2006, Space Sci. Rev., 123, 485 [NASA ADS] [CrossRef] [Google Scholar]
- Garrod, R. T., & Pauly, T. 2011, ApJ, 735, 15 [NASA ADS] [CrossRef] [Google Scholar]
- Garrod, R. T., Widicus Weaver, S. L., & Herbst, E. 2008, ApJ, 682, 283 [NASA ADS] [CrossRef] [Google Scholar]
- Geppert, W. D., Reignier, D., Stoecklin, T., et al. 2000, Phys. Chem. Chem. Phys., 2, 2873 [CrossRef] [Google Scholar]
- Gibb, E. L., & Horne, D. 2013, ApJ, 776, L28 [NASA ADS] [CrossRef] [Google Scholar]
- Gibb, E. L., van Brunt, K. A., Brittain, S. D., & Rettig, T. W. 2007, ApJ, 660, 1572 [NASA ADS] [CrossRef] [Google Scholar]
- Glassgold, A. E., Huggins, P. J., & Langer, W. D. 1985, ApJ, 290, 615 [NASA ADS] [CrossRef] [Google Scholar]
- Glassgold, A. E., Najita, J., Igea, J. 1997, ApJ, 480, 344 [NASA ADS] [CrossRef] [Google Scholar]
- Glassgold, A. E., Meijerink, R., & Najita, J. R. 2009, ApJ, 701, 142 [NASA ADS] [CrossRef] [Google Scholar]
- Goldsmith, P. F., Melnick, G. J., Bergin, E. A., et al. 2000, ApJ, 539, L123 [NASA ADS] [CrossRef] [Google Scholar]
- Goldsmith, P. F., Liseau, R., Bell, T. A., et al. 2011, ApJ, 737, 96 [Google Scholar]
- Graedel, T. E., Langer, W. D., & Frerking, M. A. 1982, ApJS, 48, 321 [NASA ADS] [CrossRef] [Google Scholar]
- Grady, C., Fukugawa, M., Maruta, Y., et al. 2015, Ap&SS, 355, 253 [NASA ADS] [CrossRef] [Google Scholar]
- Gredel, R., Lepp, S., Dalgarno, A., & Herbst, E. 1989, ApJ, 347, 289 [NASA ADS] [CrossRef] [Google Scholar]
- Hamaguchi, K., Yamauchi, S., & Koyama, K. 2005, ApJ, 618, 360 [NASA ADS] [CrossRef] [Google Scholar]
- Hasegawa, T. I., Herbst, E., & Leung, C. M. 1992, ApJ, 82, 167 [NASA ADS] [Google Scholar]
- Herbst, E. 1995, Ann. Rev. Phys. Chem., 46, 27 [Google Scholar]
- Heays, A. N., Visser, R., Gredel, R., et al. 2014, A&A, 562, A61 [NASA ADS] [CrossRef] [EDP Sciences] [Google Scholar]
- Herczeg, G. J., & Hillenbrand, L. A., 2009, ApJ, 681, 594 [Google Scholar]
- Huntress, W. T. 1997, ApJS, 33, 495 [Google Scholar]
- Ioppolo, S., Cuppen, H. M., Romanzin, C., van Dishoeck, E. F., & Linnartz, H. 2008, ApJ, 686, 1474 [NASA ADS] [CrossRef] [Google Scholar]
- Lahuis, F., van Dishoeck, E. F., Boogert, A. C. A., et al. 2006, ApJ, 636, L145 [NASA ADS] [CrossRef] [Google Scholar]
- Lamberts, T., Cuppen, H. M., Ioppolo, S., & Linnartz, H. 2013, Phys. Chem. Chem. Phys., 15, 8287 [CrossRef] [Google Scholar]
- Larsson, B., Liseau, L., Pagani, L., et al. 2007, A&A, 466, 999 [Google Scholar]
- Laufer, A. H., & Fahr, A. 2004, Chem. Rev., 104, 2813 [CrossRef] [Google Scholar]
- Lee, L. C. 1984, ApJ, 282, 172 [NASA ADS] [CrossRef] [Google Scholar]
- Lee, H. H., Herbst, E., Pineau de Forêts, G., Roueff, E., & Le Bourlot, J. 1996, A&A, 311, 690 [NASA ADS] [Google Scholar]
- Li, X., Arasa, C., van Dishoeck, E. F., & van Hemert, M. 2013, J. Phys. Chem. A, 117, 12889 [CrossRef] [Google Scholar]
- Li, X., Heays, A. N., Visser, R., et al. 2013, A&A, 555, A14 [NASA ADS] [CrossRef] [EDP Sciences] [Google Scholar]
- Liseau, R., Goldsmith, P. F., Larsson, B., et al. 2012, A&A, 541, A73 [NASA ADS] [CrossRef] [EDP Sciences] [Google Scholar]
- Karssemeijer, L. J., & Cuppen, H. M. 2014, A&A, 569, A107 [NASA ADS] [CrossRef] [EDP Sciences] [Google Scholar]
- Kim, J. K., & Huntress, W. T. 1975, Int. J. Mass Spectrom. Ion Phys., 16, 451 [NASA ADS] [CrossRef] [Google Scholar]
- Kim, J. K., Theard, L. P., & Huntressm, W. T. 1974, Int. J. Mass Spectrom. Ion Phys., 15, 223 [NASA ADS] [CrossRef] [Google Scholar]
- Madhusudhan, N., Amin, M. A., & Kennedy, G. M. 2013, ApJ, 794, L12 [Google Scholar]
- Maloney, P. R., Hollenbach, D. J., & Tielens, A. G. G. M. 1996, ApJ, 466, 561 [NASA ADS] [CrossRef] [Google Scholar]
- Mandell, A. M., Bast, J., van Dishoeck, E. F., et al. 2012, ApJ, 747, 92 [Google Scholar]
- Markwick, A., Ilgner, M., Millar, T. J., & Henning, Th. 2002, A&A, 385, 632 [NASA ADS] [CrossRef] [EDP Sciences] [Google Scholar]
- Meeus, G., Waters, L. B. F. M., Bouwman, J., et al. 2001, A&A, 365, 476 [NASA ADS] [CrossRef] [EDP Sciences] [Google Scholar]
- Meeus, G., Montesinos, B., Mendigutía, I., et al. 2012, A&A, 544, A78 [NASA ADS] [CrossRef] [EDP Sciences] [Google Scholar]
- Meijerink, R., Pontoppidan, K. M., Blake, G. A., Poelman, D. R., & Dullemond, C. P. 2009, ApJ, 704, 1471 [NASA ADS] [CrossRef] [Google Scholar]
- Meyer, D. M., Jura, M., & Cardelli, J. A., 1998, ApJ, 493, 222 [NASA ADS] [CrossRef] [Google Scholar]
- McElroy, D., Walsh, C., Markwick, A. J., et al. 2013, A&A, 550, A36 [NASA ADS] [CrossRef] [EDP Sciences] [Google Scholar]
- Miyauchi, N., Hidaka, H., Chigai, T., et al. 2008, Chem. Phys. Lett., 456, 27 [NASA ADS] [CrossRef] [Google Scholar]
- Miller, J. A., Pilling, M. J., & Troe, J. 2005, in Proceedings of the Combustion Institute, 30, 43 [Google Scholar]
- Najita, J. R., Ádaámkovics, M., & Glassgold, A. E. 2011, ApJ, 743, 147 [NASA ADS] [CrossRef] [Google Scholar]
- Najita, J. R., Carr, J. S., Pontoppidan, K. M., et al. 2013, ApJ, 766, 134 [NASA ADS] [CrossRef] [Google Scholar]
- Noble, J., Theulé, P., Borget, F., et al. 2011, MNRAS, 428, 3232 [Google Scholar]
- Nomura, H., & Millar, T. J. 2005, A&A, 438, 923 [NASA ADS] [CrossRef] [EDP Sciences] [MathSciNet] [Google Scholar]
- Nomura, H., Aikawa, Y., Tsujimoto, M., Nakagawa, Y., & Millar, T. J. 2007, ApJ, 661, 334 [NASA ADS] [CrossRef] [Google Scholar]
- Öberg, K. I., van Dishoeck, E. F., & Linnartz, H. 2009a, A&A, 496, 281 [NASA ADS] [CrossRef] [EDP Sciences] [Google Scholar]
- Öberg, K. I., Linnartz, H., Visser, R., & van Dishoeck, E. F. 2009b, ApJ, 693, 1209 [NASA ADS] [CrossRef] [Google Scholar]
- Öberg, K. I., Garrod, R. T., van Dishoeck, E. F., & Linnartz, H. 2009c, A&A, 504, 891 [NASA ADS] [CrossRef] [EDP Sciences] [Google Scholar]
- Öberg, K. I., Boogert, A. C. A., Pontoppidan, K. M., et al. 2011, ApJ, 740, 109 [NASA ADS] [CrossRef] [Google Scholar]
- Oldenborg, R. C., Loge, G. W., Harradine, D. M., & Winn, K. R. 1992, J. Phys. Chem., 96, 8426 [CrossRef] [Google Scholar]
- Pagani, L., Olofsson, A. O. H., Bergman, P., et al. 2003, A&A, 402, L77 [NASA ADS] [CrossRef] [EDP Sciences] [Google Scholar]
- Pascucci, I., Apai, D., Hardegree-Ullman, E. E., et al. 2008, ApJ, 673, 477 [NASA ADS] [CrossRef] [Google Scholar]
- Pascucci, I., Luhman, K., Henning, Th., et al. 2009, ApJ, 696, 143 [NASA ADS] [CrossRef] [Google Scholar]
- Pascucci, I., Herczeg, G., Carr, J. S., & Bruderer, S. 2013, ApJ, 779, 178 [NASA ADS] [CrossRef] [Google Scholar]
- Pontoppidan, K. M., Meijerink, R., Dullemond, C. P., & Blake, G. A. 2009, ApJ, 704, 1482 [NASA ADS] [CrossRef] [Google Scholar]
- Pontoppidan, K. M., Salyk, C., Blake, G. A., et al. 2010, ApJ, 720, 887 [NASA ADS] [CrossRef] [Google Scholar]
- Prasad, S. S., & Huntress, W. T. 1980, ApJ, 43, 1 [NASA ADS] [Google Scholar]
- Preibisch, T., Kim, Y.-C., Favata, F., et al. 2005, ApJS, 160, 401 [NASA ADS] [CrossRef] [Google Scholar]
- Qi, C., Öberg, K. I., Wilner, D. J., et al. 2013, Science, 341, 630 [NASA ADS] [CrossRef] [PubMed] [Google Scholar]
- Raksit, A. B., Schiff, H. I., & Bohme, D. K. 1984, Int. J. Mass Spectrom. Ion Phys., 56, 321 [NASA ADS] [CrossRef] [Google Scholar]
- Roberts, H., & Herbst, E. 2002, A&A, 395, 233 [NASA ADS] [CrossRef] [EDP Sciences] [Google Scholar]
- Rodgers, A. S., & Smith, G. P. 1996, Chem. Phys. Lett., 253, 313 [NASA ADS] [CrossRef] [Google Scholar]
- Salyk, C., Pontoppidan, K. M., Blake, G. A., et al. 2008, ApJ, 676, L49 [NASA ADS] [CrossRef] [Google Scholar]
- Salyk, C., Pontoppidan, K. M., Blake, G. A., Najita, J. R., & Carr, J. S. 2011, ApJ, 731, 130 [NASA ADS] [CrossRef] [Google Scholar]
- Schwarz, K. R., & Bergin, E. A. 2014, ApJ, 797, 113 [NASA ADS] [CrossRef] [Google Scholar]
- Semaniak, J., Minaev, B. F., Derkatch, A. M., et al. 2001, ApJS, 135, 275 [NASA ADS] [CrossRef] [Google Scholar]
- Sha, X., Jackson, B., Lemoine, D., & Lepetit, B. 2010, J. Chem. Phys., 122, 14709 [Google Scholar]
- Sims, I. R., Queffelec, J.-L., Defrance, A. et al. 1994, J. Chem. Phys., 100, 4229 [NASA ADS] [CrossRef] [Google Scholar]
- Smith, D., Spanel, P., & Mayhew, C. A. 1992, Int. J. Mass Spectrom. Ion Phys., 117, 457 [Google Scholar]
- Smith, I. W. M., Herbst, E., & Chang, Q. 2004, MNRAS, 350, 323 [NASA ADS] [CrossRef] [Google Scholar]
- Stäuber, P., Doty, S. D., van Dishoeck, E. F., & Benz, A. O. 2005, A&A, 440, 949 [NASA ADS] [CrossRef] [EDP Sciences] [Google Scholar]
- Stevenson, D. J., & Lunine, J. I. 1988, Icarus, 75, 146 [NASA ADS] [CrossRef] [Google Scholar]
- Thi, W.-F., Kamp, I., Woitke, P., et al. 2013, A&A, 551, A49 [NASA ADS] [CrossRef] [EDP Sciences] [Google Scholar]
- Thiabaud, A., Marboeuf, U., Alibert, Y., Leya, I., & Mezger, K. 2014, A&A, 574, A138 [Google Scholar]
- Tielens, A. G. G. M., & Hagen, W. 1982, A&A, 114, 245 [NASA ADS] [Google Scholar]
- Tsang, W., & Hampson, R. F. 1986, J. Phys. Chem. Ref. Data, 15, 1087 [NASA ADS] [CrossRef] [Google Scholar]
- Tsang, W., & Herron, J. T. 1991, J. Phys. Chem. Ref. Data, 20, 609 [NASA ADS] [CrossRef] [Google Scholar]
- Vandenbussche, B., Ehrenfreund, P., Boogert, A. C. A., et al. 1999, A&A, 346, L57 [NASA ADS] [Google Scholar]
- van Dishoeck, E. F., & Black, J. H., 1988, ApJ, 334, 771 [NASA ADS] [CrossRef] [Google Scholar]
- van Dishoeck, E. F., Jonkheid, B., & van Hemert, M. C. 2006, Faraday Discuss., 133, 231 [Google Scholar]
- van Dishoeck, E. F., Herbst, E., & Neufeld, D. A. 2013, Chem. Rev., 113, 9043 [NASA ADS] [CrossRef] [PubMed] [Google Scholar]
- Vasyunin, A. I., & Herbst, E. 2013, ApJ, 762, 86 [NASA ADS] [CrossRef] [Google Scholar]
- Viggiano, A. A., Howorka, F., Albritton, D. L., et al. 1980, ApJ, 236, 492 [NASA ADS] [CrossRef] [Google Scholar]
- Visser, R., van Dishoeck, E. F., & Black, J. H. 2009, A&A, 503, 323 [NASA ADS] [CrossRef] [EDP Sciences] [Google Scholar]
- Visser, R., Doty, S. D., & van Dishoeck, E. F. 2011, A&A, 534, A132 [NASA ADS] [CrossRef] [EDP Sciences] [Google Scholar]
- Wakelam, V., Herbst, E., Loison, J.-C., et al. 2012, ApJ, 199, 21 [Google Scholar]
- Walsh, C., Millar, T. J., & Nomura, H. 2010, ApJ, 722, 1607 [NASA ADS] [CrossRef] [Google Scholar]
- Walsh, C., Nomura, H., Millar, T. J., & Aikawa, Y. 2012, ApJ, 747, 114 [NASA ADS] [CrossRef] [Google Scholar]
- Walsh, C., Millar, T. J., Nomura, H., et al. 2014, A&A, 563, A33 [NASA ADS] [CrossRef] [EDP Sciences] [Google Scholar]
- Weingartner, J. C., & Draine, B. T. 2001, ApJ, 548, 296 [NASA ADS] [CrossRef] [Google Scholar]
- Willacy, K., & Woods, P. M. 2009, ApJ, 703, 479 [NASA ADS] [CrossRef] [Google Scholar]
- Willacy, K., Klahr, H. H., Millar, T. J., & Henning, Th. 1998, A&A, 338, 995 [NASA ADS] [Google Scholar]
- Williams, J. P., & Cieza, L. A. 2011, ARA&A, 49, 67 [NASA ADS] [CrossRef] [Google Scholar]
- Woitke, P., Thi, W.-F., Kamp, I., & Hogerheijde, M. 2009, A&A, 501, L5 [NASA ADS] [CrossRef] [EDP Sciences] [Google Scholar]
- Woods, P. M., & Willacy, K. 2009, ApJ, 693, 1360 [NASA ADS] [CrossRef] [Google Scholar]
- Wright, G. S., Reike, G., van Dishoeck, E. F., et al. 2004, in SPIE Conf. Ser. 5487, ed. J. C. Mather, 653 [Google Scholar]
- Yildiz, U. A., Acharyya, K., Goldsmith, P. F., et al. 2013, A&A, 558, A58 [NASA ADS] [CrossRef] [EDP Sciences] [Google Scholar]
- Zinnecker, H., & Preibisch, Th. 1994, A&A, 292, 152 [NASA ADS] [Google Scholar]
All Tables
Abundances with respect to total H nuclei density for the dark cloud model and used as initial abundances in the disk model.
All Figures
|
Fig. 1 FUV radiation fields at a distance of 1 AU from the central star (see text for details). |
| In the text | |
|
Fig. 2 Number density (top row), gas temperature (second row), dust temperature (middle row), FUV flux (forth row) and X-ray flux (bottom row) as a function of disk radius and disk height (scaled by the radius) for the M dwarf disk (left column), the T Tauri disk (middle column) and the Herbig Ae disk (right column). |
| In the text | |
|
Fig. 3 Fractional abundance relative to total gas number density of C2H2 (top row) and HCN (bottom row) for the M dwarf disk (left-hand column), T Tauri disk (middle column), and Herbig Ae disk (right-hand column). The dotted and dot-dashed lines indicate the dust column density (integrated from the surface downwards) at which τ ≈ 1 at 3 μm and 14 μm, respectively. |
| In the text | |
|
Fig. 4 Dominant reactions controlling the abundance of C2H2 and related species at the position of peak fractional abundance in the disk atmospheres at a radius of 1 AU. The solid lines indicate gas-phase two-body reactions and the dotted lines indicate UV or X-ray-induced reactions. The width of the arrows for the gas-phase reactions shows the magnitude of the activation barrier. The left-hand side, highlighted in red, is the chemistry most dominant in UV-dominated gas with a higher gas temperature (e.g., in Herbig Ae disks), whereas that highlighted in blue on the right-hand side is that which dominates in X-ray irradiated gas with a lower gas temperature (e.g., in X-ray irradiated M dwarf disks). |
| In the text | |
|
Fig. 5 Dominant reactions controlling the abundance of HCN and related species at the position of peak fractional abundance in the disk atmospheres at a radius of 1 AU. The solid lines indicate gas-phase two-body reactions and the dotted lines indicate UV or X-ray-induced reactions. The width of the arrows for the gas-phase reactions shows the magnitude of the activation barrier. |
| In the text | |
|
Fig. 6 Column density of C2H2 (top row) and HCN (bottom row) as a function of radius for each disk model for the entire vertical extent of the disk (left-hand column) and down to the τ = 1 surface at 14 μm (right-hand column). The solid coloured and hatched regions indicate the range of observed values for the T Tauri (Carr & Najita 2011; Salyk et al. 2011) and M dwarf (Pascucci et al. 2013) disks, respectively. |
| In the text | |
|
Fig. 7 Ratio of C2H2 and HCN column densities in the disk atmosphere as a function of radius for the M dwarf disk (gold dotted lines) and T Tauri disk (red dashed lines). The solid coloured and hatched regions correspond to the range of observed values for T Tauri (Carr & Najita 2011; Salyk et al. 2011) and M dwarf (Pascucci et al. 2013) disks, respectively. The thick and fine lines represent the ratios down to the τ = 1 surface at 14 and 3 μm. |
| In the text | |
|
Fig. 8 Fractional abundance relative to total gas number density of OH (top row) and H2O (bottom row) for the M dwarf disk (left-hand column), T Tauri disk (middle column), and Herbig Ae disk (right-hand column). The dotted and dot-dashed lines indicate the dust column density (integrated from the surface downwards) at which τ ≈ 1 at 3 μm and 14 μm, respectively. |
| In the text | |
|
Fig. 9 Dominant reactions controlling the abundance of OH and H2O and related species at the position of peak fractional abundance in the disk atmospheres at a radius of 1 AU. The solid lines indicate gas-phase two-body reactions and the dotted lines indicate UV or X-ray-induced reactions. The width of the arrows for the gas-phase reactions shows the magnitude of the activation barrier. |
| In the text | |
|
Fig. 10 Column density of OH (top row) and H2O (bottom row) as a function of radius for each disk model for the entire vertical extent of the disk (left-hand column) and down to the τ = 1 surface at 14 μm (right-hand column). The solid coloured and striped regions indicate the range of observed values for the T Tauri (Carr & Najita 2011; Salyk et al. 2011) and Herbig Ae (Fedele et al. 2011; Salyk et al. 2011) disks, respectively. |
| In the text | |
|
Fig. 11 Ratio of OH and H2O column densities in the disk atmosphere as a function of radius for the T Tauri disk (blue dashed lines) and Herbig Ae disk (green dot-dashed lines). The solid coloured region corresponds to the range of observed values for T Tauri disks (Carr & Najita 2011; Salyk et al. 2011) and the green diamond and arrow indicates the ratio range observed for HD 163296 (Fedele et al. 2012). The thick and fine lines represent the ratios down to the τ = 1 surface at 14 and 3 μm. |
| In the text | |
|
Fig. 12 Fractional abundance with respect to gas number density of N (top row), N2 (middle row), and HCN (bottom row) as a function of Z/R at R = 1 AU for each disk model. The black dashed lines, purple solid lines, and green solid lines represent results from the fiducial model (including N2 shielding and X-rays), the model with N2 switched off, and the model with X-rays switched off, respectively. |
| In the text | |
|
Fig. 13 Fractional abundance with respect to gas number density of C2H2 as a function of Z/R at R = 1 AU for the M dwarf and T Tauri disk models. The black dashed lines and orange solid lines represent results from the fiducial model (including N2 shielding and X-rays) and the model with X-rays switched off, respectively. |
| In the text | |
|
Fig. 14 Fractional abundance with respect to gas number density of N2 (top row), NH3 (middle row), and HCN (bottom row) as a function of Z/R at R = 1 AU for each disk model. The black dashed lines, orange lines, cyan lines, green lines, and gold lines represent results from the fiducial model and a model in which (i) all species are initially atomic; (ii) all nitrogen is in N2 gas; (iii) all nitrogen is in N2 ice; and (iv) all nitrogen is in NH3 ice, respectively. |
| In the text | |
|
Fig. 15 Percentage contribution of the dominant molecular carriers to the total elemental oxygen, carbon, and nitrogen column densities, as a function of radius. |
| In the text | |
 |
Fig. 16 Same as Fig. 15 for the disk atmosphere only. |
| In the text | |
|
Fig. 17 C/O ratio as a function of radius for the total ice column density (left panel), the total gas column density (middle panel), and for the “observable” disk atmosphere only (right panel). The grey dashed line indicates the underlying C/O elemental ratio (0.44). |
| In the text | |
|
Fig. A.1 Fractional abundance with respect to gas number density of N (top row), N2 (middle row), and HCN (bottom row) as a function of Z/R at R = 10 AU for each disk model. The black dashed lines, purple solid lines, and green solid lines represent results from the fiducial model (including N2 shielding and X-rays), the model with N2 switched off, and the model with X-rays switched off, respectively. |
| In the text | |
|
Fig. A.2 Fractional abundance with respect to gas number density of N2 (top row), NH3 (middle row), and HCN (bottom row) as a function of Z/R at R = 10 AU for each disk model. The black dashed lines, orange lines, cyan lines, green lines, and gold lines represent results from the fiducial model and a model in which (i) all species are initially atomic; (ii) all nitrogen is in N2 gas; (iii) all nitrogen is in N2 ice, and (iv) all nitrogen is in NH3 ice, respectively. |
| In the text | |
|
Fig. A.3 Fractional abundance relative to total gas number density of oxygen-bearing species for the M dwarf disk (left-hand column), T Tauri disk (middle column), and Herbig Ae disk (right-hand column). The dotted and dot-dashed lines indicate the dust column density (integrated from the surface downwards) at which τ ≈ 1 at 3 μm and 14 μm, respectively. |
| In the text | |
|
Fig. A.4 Fractional abundance relative to total gas number density of carbon-bearing species for the M dwarf disk (left-hand column), T Tauri disk (middle column), and Herbig Ae disk (right-hand column). The dotted and dot-dashed lines indicate the dust column density (integrated from the surface downwards) at which τ ≈ 1 at 3 μm and 14 μm, respectively. |
| In the text | |
|
Fig. A.5 Fractional abundance relative to total gas number density of carbon-bearing species for the M dwarf disk (left-hand column), T Tauri disk (middle column), and Herbig Ae disk (right-hand column). The dotted and dot-dashed lines indicate the dust column density (integrated from the surface downwards) at which τ ≈ 1 at 3 μm and 14 μm, respectively. |
| In the text | |
|
Fig. A.6 Fractional abundance relative to total gas number density of nitrogen-bearing species for the M dwarf disk (left-hand column), T Tauri disk (middle column), and Herbig Ae disk (right-hand column). The dotted and dot-dashed lines indicate the dust column density (integrated from the surface downwards) at which τ ≈ 1 at 3 μm and 14 μm, respectively. |
| In the text | |
Current usage metrics show cumulative count of Article Views (full-text article views including HTML views, PDF and ePub downloads, according to the available data) and Abstracts Views on Vision4Press platform.
Data correspond to usage on the plateform after 2015. The current usage metrics is available 48-96 hours after online publication and is updated daily on week days.
Initial download of the metrics may take a while.