Fig. A.2
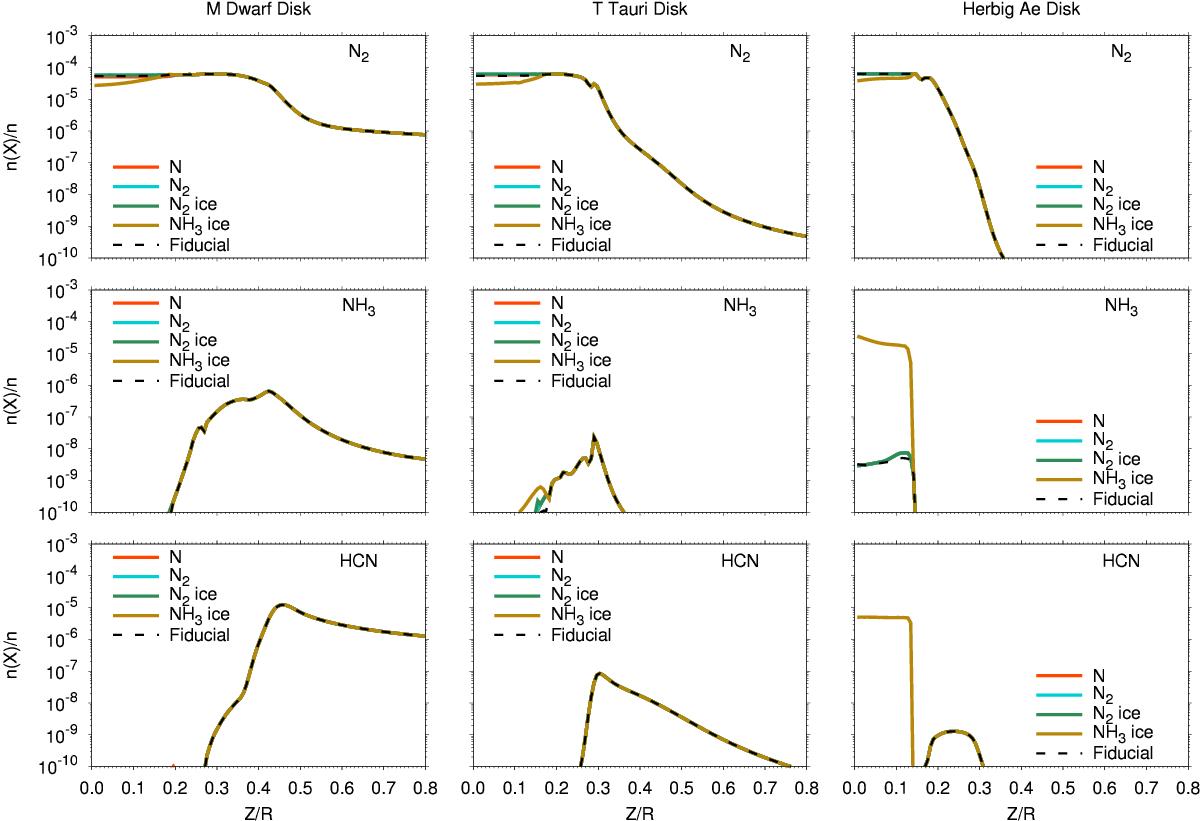
Fractional abundance with respect to gas number density of N2 (top row), NH3 (middle row), and HCN (bottom row) as a function of Z/R at R = 10 AU for each disk model. The black dashed lines, orange lines, cyan lines, green lines, and gold lines represent results from the fiducial model and a model in which (i) all species are initially atomic; (ii) all nitrogen is in N2 gas; (iii) all nitrogen is in N2 ice, and (iv) all nitrogen is in NH3 ice, respectively.
Current usage metrics show cumulative count of Article Views (full-text article views including HTML views, PDF and ePub downloads, according to the available data) and Abstracts Views on Vision4Press platform.
Data correspond to usage on the plateform after 2015. The current usage metrics is available 48-96 hours after online publication and is updated daily on week days.
Initial download of the metrics may take a while.