| Issue |
A&A
Volume 582, October 2015
|
|
|---|---|---|
| Article Number | A88 | |
| Number of page(s) | 28 | |
| Section | Interstellar and circumstellar matter | |
| DOI | https://doi.org/10.1051/0004-6361/201526751 | |
| Published online | 14 October 2015 | |
Online material
Appendix A: Supplementary figures
In Figs. A.1 and A.2, we show results at a radius of 10 AU from the same models described in Figs. 12 and 14.
In Figs. A.3 to A.6 we show the fractional abundances
as a function of radius, R, and height scaled by the radius, Z/R, for those species not discussed in detail in the text. These include important oxygen- (e.g., O2, CO, and CO2), carbon- (e.g., CnHm) and nitrogen-bearing species (e.g., N2 and NH3).
 |
Fig. A.1
Fractional abundance with respect to gas number density of N (top row), N2 (middle row), and HCN (bottom row) as a function of Z/R at R = 10 AU for each disk model. The black dashed lines, purple solid lines, and green solid lines represent results from the fiducial model (including N2 shielding and X-rays), the model with N2 switched off, and the model with X-rays switched off, respectively. |
| Open with DEXTER | |
 |
Fig. A.2
Fractional abundance with respect to gas number density of N2 (top row), NH3 (middle row), and HCN (bottom row) as a function of Z/R at R = 10 AU for each disk model. The black dashed lines, orange lines, cyan lines, green lines, and gold lines represent results from the fiducial model and a model in which (i) all species are initially atomic; (ii) all nitrogen is in N2 gas; (iii) all nitrogen is in N2 ice, and (iv) all nitrogen is in NH3 ice, respectively. |
| Open with DEXTER | |
 |
Fig. A.3
Fractional abundance relative to total gas number density of oxygen-bearing species for the M dwarf disk (left-hand column), T Tauri disk (middle column), and Herbig Ae disk (right-hand column). The dotted and dot-dashed lines indicate the dust column density (integrated from the surface downwards) at which τ ≈ 1 at 3 μm and 14 μm, respectively. |
| Open with DEXTER | |
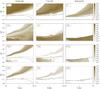 |
Fig. A.4
Fractional abundance relative to total gas number density of carbon-bearing species for the M dwarf disk (left-hand column), T Tauri disk (middle column), and Herbig Ae disk (right-hand column). The dotted and dot-dashed lines indicate the dust column density (integrated from the surface downwards) at which τ ≈ 1 at 3 μm and 14 μm, respectively. |
| Open with DEXTER | |
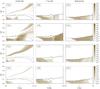 |
Fig. A.5
Fractional abundance relative to total gas number density of carbon-bearing species for the M dwarf disk (left-hand column), T Tauri disk (middle column), and Herbig Ae disk (right-hand column). The dotted and dot-dashed lines indicate the dust column density (integrated from the surface downwards) at which τ ≈ 1 at 3 μm and 14 μm, respectively. |
| Open with DEXTER | |
 |
Fig. A.6
Fractional abundance relative to total gas number density of nitrogen-bearing species for the M dwarf disk (left-hand column), T Tauri disk (middle column), and Herbig Ae disk (right-hand column). The dotted and dot-dashed lines indicate the dust column density (integrated from the surface downwards) at which τ ≈ 1 at 3 μm and 14 μm, respectively. |
| Open with DEXTER | |
© ESO, 2015
Current usage metrics show cumulative count of Article Views (full-text article views including HTML views, PDF and ePub downloads, according to the available data) and Abstracts Views on Vision4Press platform.
Data correspond to usage on the plateform after 2015. The current usage metrics is available 48-96 hours after online publication and is updated daily on week days.
Initial download of the metrics may take a while.